
As we on occasion do, let's start with stocks, their prices having gone gaga. And with respect to the S&P 500, the following may be deemed obscene; thus parental discretion is advised as we go to a favoured graphic, courtesy of the "Others Parrot; We Do The Math Dept." This is per the S&P's settle yesterday (Friday) at 4136 with Q4 Earnings Season in full array (or perhaps better stated, "disarray"):
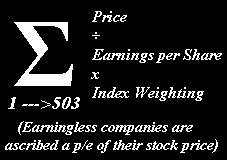 = 40.1x and unsustainably far too high!
What's going on?
Save for our website's various daily Top Ten ranking lists of the S&P's constituents, we otherwise don't focus on individual stocks per se, (as we oft tongue-in-cheek say our trading preference instead being the safety and security of the futures markets vs. the frightening risk of stock ownership). But certain stock stories are unavoidable from the FinMedia flow. To wit:
Meta Platforms (aka "Faceplant") just reported Q4 EPS which year-over-year declined -17% along with -4.5% revenue shrinkage ... and the shares then spiked +29%
Apple's Q4 EPS dropped -10% along with revenues -5.5% ... and the shares then rose +4%
Too, we've read of some non-S&P 500 "Me! Me!" stock called Carvana sporting a losing EPS of -$4, meaning by pure "portfolio theory" (is that still taught?) the stock price ought be less by that amount in a year's time ... yet money is being thrown at it for a six-week rise of +449%.
And speaking of money being thrown at the market, by our MoneyFlow page the weekly, monthly and quarterly measures value the S&P higher still by +175, +416, and +231 points respectively. Happy with your stock broker's discretionary decisions? Scary stuff.
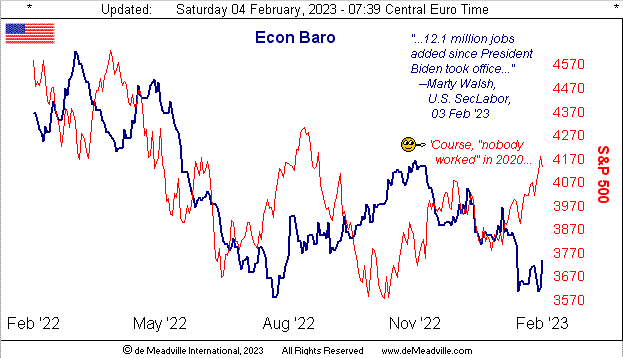
Oooh, and then there the Economic Barometer which as noted a week ago dropped like a stone per its Q4 metrics ... and yet The Bureau of Economic Analysis' initial report of Q4 Gross Domestic Product came in at +2.9%. How does this happen? A gob-smacker, that.
Certainly other like examples can be cited, but the bottom line from our purview is: the stock market clearly is not being utilized to accommodate prudent investment as obviously valuation means nothing, nor is it even being employed so as to engage in financial roulette. Rather it has morphed into Russian roulette. And as the demand for dough becomes status quo such that the chamber with the bullet comes to the fro ... look out below. We don't understand what the money-throwers are thinking ... or perhaps that's just it: they're not.
Either way, ever since dear old Dad taught us how to read the newspaper's stock tables back in '64, never have we witnessed such market mis-valuation, dislocation, and potential price devastation across those six decades.
Further as we've ad nauseam pointed out, the S&P's riskfull yield of now 1.622% is well less than half the three-month U.S. T-Bill's riskless 4.523% annualized yield. And amongst the S&P 500's heavy-weights are some ridiculous price/earnings ratios: for example Nvidia's 88.6x, Amazon's 92.7x, Berkshire's 308.5x and Salesforce's 613.7x.
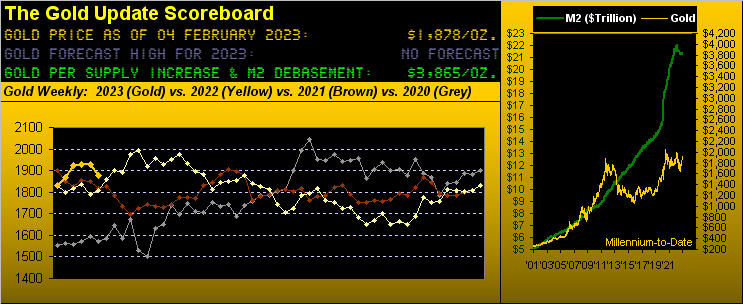
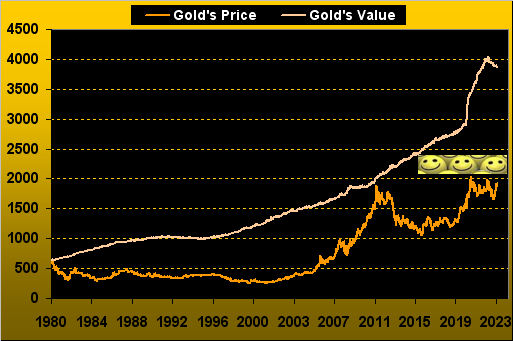
As well, the U.S. Debased Dollar has for nearly two years (until this past October) led The Ugly Dog Contest, and again is getting the bid as the Fed apparently is to maintain rate rises ahead. Remember from back in '92 then Vice Presidential candidate Algore's infamously annoying blurtation from Madison, WI that "Everything that should be down is up and everything that should be up is down"? 'Tis perfectly apropos today for the S&P and Gold. The good news is: everything eventually reverts to proper valuation, (see below our closing chart).
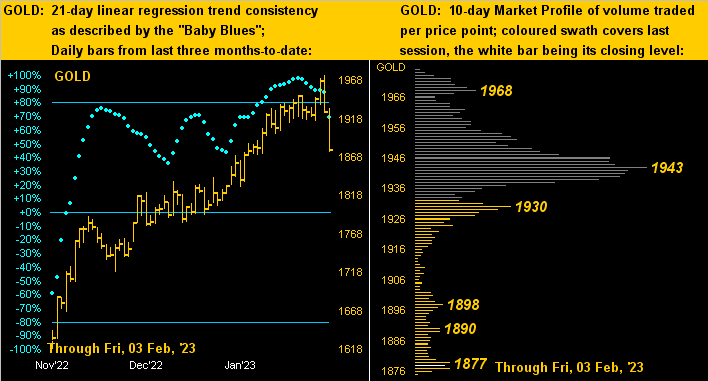
But as to The Now, let's move on to Gold's foreseen falling saga, price having dutifully returned down into the 1800s in settling out this past week at 1878.
"And a timely call there, mmb..."
Most kind, Squire, but 'tis not about us. We did herein suggest two weeks back (Gold then 1928) "...a test of those 1800s may be nigh..." However: we remain firmly bullish for far higher Gold levels, and continue to anticipate that this near-term excursion down into the 1800s shall prove to be price supportive. Moreover, Gold intra-week was very strong, reaching as high as 1975 on Thursday ... only to then plummet -100 points in just 35 hours to 1875 come yesterday.
Thus: was the Federal Open Market Committee premature in reducing its Bank's Funds Rate increase from +50bp to +25bp? After all, the Bureau of Labor Statistics came up with Non-Farm Payroll creation for January of 517,000, a six-month high and a +99% increase from December, albeit ADP's calculation of only 106,000 jobs was a -58% decrease. But it all depends upon who's counting what ... and perhaps to what end. And should you be scoring at home, ex-COVID, 'tis the second-largest job-count disparity in the 14 years these two measures have co-existed, (i.e. one of those things that makes you go "hmmm...").
Regardless of the slowing FedFunds rate increase, FedChair Powell & Co. continue to spread their hawkish wings in expectation of ongoing inflation, notably as spurred by employment and wage growth (if going by the BLS version which also included increases in Hourly Earnings and Hours Worked). And on this side of the Pond, both the European Central Bank and Bank of England maintained rate increases of +50bp.
In any event, the Dollar's post-FOMC firming during the week threw the spanner into the works of not just Gold, but also of Silver, Copper, Oil, the €uro, Swiss Franc and Bond. And that puts the longevity of Gold's weekly parabolic Long trend (now 13 weeks in length) in jeopardy. For as we below see, with Gold today at 1878 (and its array of conventional studies turning negative), price is now just 22 points above the 1856 level which if eclipsed in the ensuing week flips said trend to Short:
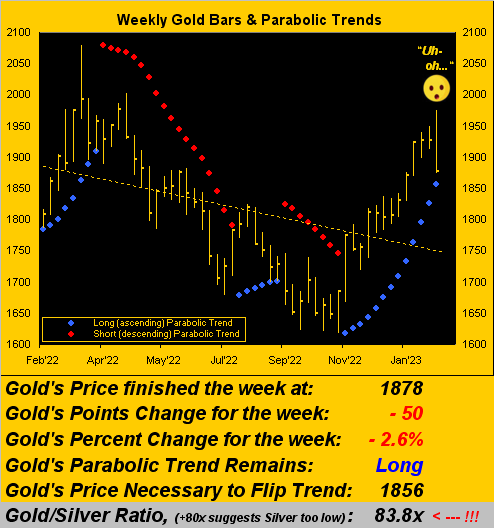
As to how low does Gold then go? Again we emphasize the 1800s as being supportive, so don't get overly nervous out there: however for the past 10 parabolic Short trends, the average decline from the flip price is -153 points, which in that vacuum from 1856 suggests 1703. That'd be quite the untoward hit but hopefully avoidable as "Gold Awareness" becomes more hip.
Now let's hop over to the Econ Baro which from an improved week for incoming metrics got a bit of a grip. Job gains helped as did December's Factory Orders, Q4's Productivity and the Institute for Supply Management's Services Index for January. However, the ISM's Manufacturing Index weakened, as did the month's Chicago Purchasing Managers' Index and the Conference Board's read of Consumer Confidence; too, December's Construction Spending shrank. But all-in, 'twas a net pop for the Baro:
As to our dual-panel zoom-in on Gold, the carnage is clear on the left per price's daily bars from three months ago-to-date as the rightmost bit goes to bits. And for the 10-day Market Profile on the right, Gold has made the trip from first to worst:
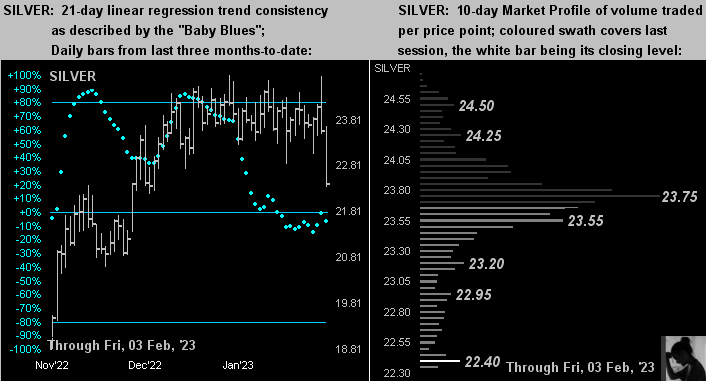
Then of course there's the poor ol' Sister Silver's two-panel dismantle. Per her "Baby Blues" having already dropped sub-0% (at left), that defines the past 21-days of regression trend as now negative. For her Profile (at right), being cellar-dweller is her plight:
We close it out for this week per the wry smile we got from this piece (hat-tip The BBC): "White House calls Exxon record profit 'outrageous'."
"So why the wry smile, mmb?"
Simple, dear Squire: because both Microsoft and Apple made even more in Q4, but apparently no mention was made there. Which provokes us to again ask...
What's going on?
Best to get on with getting some Gold before it reverts (way up) to its valuation!
Cheers!
...m...
About the author
