“Successful investing is anticipating the anticipation of others.”
—John Maynard Keynes, 1st Baron of Keynes, British economist whose ideas fundamentally changed the theory and practice of macroeconomics and economic policy, author of General Theory of Employment, Interest and Money (1936); 1883–1946
“Based on my own personal experience – both as an investor in recent years and an expert witness in years past – rarely do more than three or four variables really count. Everything else is noise.”
—Martin J. Whitman, American investment advisor, founder and co-Chief Investment Officer of Third Avenue Management and Portfolio Manager Third Avenue Value Fund; 1924–2018
“But how do we know when irrational exuberance has unduly escalated asset values, which then become subject to unexpected and prolonged contractions as they have in Japan over the past decade.”
—Alan Greenspan, American economist, 13th Chair of the Federal Reserve 1987–2006, consulting firm Greenspan & Associates, from a speech December 5, 1996 to the American Enterprise Institute; b. 1926
It’s October. The scary month, the jinx month, the month of crashes. But also a “bear killer.” Oh yes, the crashes: 1929 (the granddaddy of them all), 1987, Friday the 13th in 1989, massacres in October 1997, 1978, and 1979, and finally the Lehman Brothers meltdown in October 2008 that started in September. October marks the end of the so-called worst six months of the year. Bears ended in 1946, 1957, 1960, 1962, 1966, 1974, 1987, 1990, 1998, 2001, 2002, and 2011. A bear got underway in October 2007, the final top before the financial crash of 2008. October isn’t even the worst month, ranking 7th.
The month didn’t get off to a good start. Facebook went dark. Britain has crippled gas stations and now they are culling pigs because of labour shortages exacerbated by Brexit. Oh yes, Britain, once called the “empire on which the sun never sets” is not even sure the sun will actually come up every morning. The energy crisis is hitting even China. In hitting China, it is exacerbating the delivery of goods. There have been electricity blackouts in the country spawned by power shortages. Major tech giants are particularly impacted—Apple, Tesla, Microsoft, HP, and Dell have been forced to either curtail operations or stop them altogether. The clampdown on Chinese tech giants isn’t helping. Consumer products ranging from water to backpacks face caps on energy uses and agricultural plants have been forced to go dark for periods, impacting food supply. Next door, India is also experiencing an energy crunch with blackouts and more.
In the U.S., dozens of container ships are sitting offshore, unable to unload their contents due to labour shortages onshore. It is even suspected that an anchor from one of the container ships may have caught the underwater pipeline that burst, spilling upwards of 5,000 gallons of oil on to California beaches and wetlands. The supply shocks are feeding themselves into the economy with shortages of numerous products and resultant higher inflation. Given the sharp rise in energy prices over the past several months, consumers may face sticker shock when heating their homes this winter. Many are already seeing it at the gas pumps. Maybe inflation won’t be so transitory after all. Even Bank of Canada (BofC) governor Tiff MacKlem acknowledged that. Does this put pressure on the Fed and other central banks to hike interest rates? Possibly, but certainly not right away. Far too early. At best not until sometime well into 2022. And it would be a shock to the economy if they did. They’ll endure widening negative interest rates, although the U.S. 10-year has been rising, most recently at 1.60%.
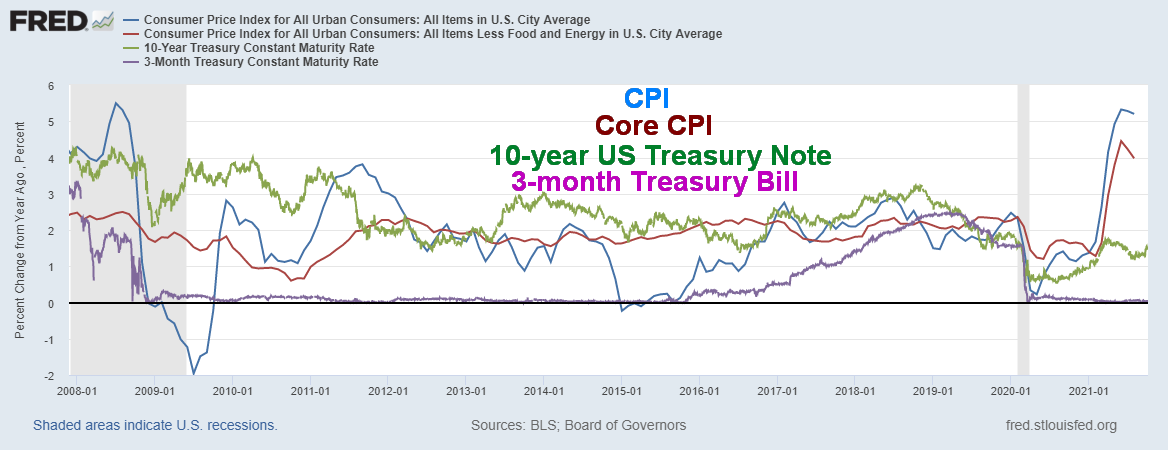
CPI, Core CPI, 10-year Treasury Note, 3-month Treasury Bill 2007–2021
Source: www.stlouisfed.org
The spread, as one can see, has become quite negative. CPI minus 10-year is 3.65%, CPI minus 3-month is 5.14%. With the Core CPI vs. the 10-year, the negative spread is 2.25 and with the 3-month negative 3.74%. The negative spread is starting to reach levels seen during the inflationary 1970s. It took former Fed Chair Paul Volker hiking the Fed Funds rate to 20% to wrestle the inflation rate to the ground. Throughout the 1970s the Fed rate and the 10-year remained under the rate of inflation. The sharp hike in interest rates in 1980 to quell inflation sparked a very steep recession that lingered into the mid-1980s.
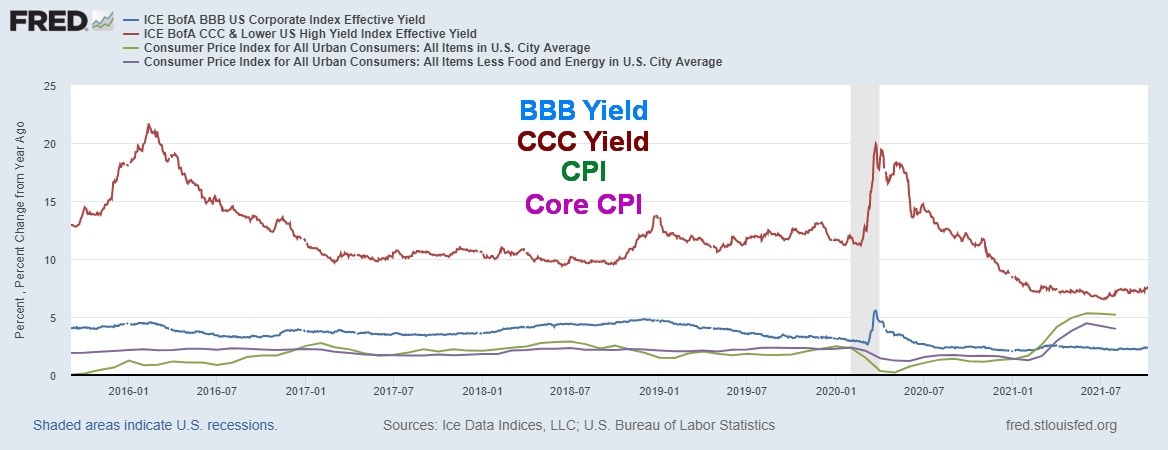
BBB Yield, CCC Yield, CPI, Core CPI 2016–2021
Source: www.stlouisfed.org
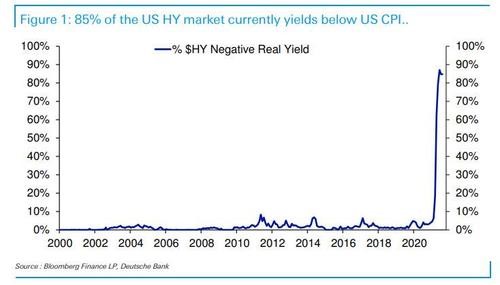
There is, however, a bigger problem. We looked at yields on CCC and BBB corporate bonds. BBB is the lowest investment grade bond while CCC is effectively junk bonds. With the BBB yield currently at 2.38% it too is trading below the rate of CPI (negative 2.82%) and Core CPI (negative 1.42%). It is estimated that upwards of $2 trillion of BBB rated debt matures between now and 2023. Add in BB rated down to C rated and with BBB rated they represent in excess of 65% of corporate debt in the U.S. BBB rated debt is the lowest investment grade debt. According to the current CCC yield, that is above the inflation rate but not by much. CCC yield is 7.64% for a positive spread of 2.44% to CPI and positive spread to Core CPI of 3.84%. But, according to the former Ronald Reagan budget chief David Stockman, while junk bonds have returned upwards of 10% thus far inn 2021, he notes that some 85% of junk bonds are yielding less than the CPI. He notes that the previous high level was 7% over the past 50 years. As the Fed keeps interest rates low, investors up their risk appetite by running into high yield bonds or the stock market.
Source: www.bloomberg.com, www.db.com, www.davidstockmancontracorner.com
Stockman goes on to relate how distorted the markets are by noting that in 1987 the U.S. GDP was $4.8 trillion while the total stock market capitalization was $3 trillion. We still had a stock market crash in 1987. Today GDP Is $22.7 trillion while the market cap of the Wilshire 5000 is $46.3 trillion. It should be $14.2 trillion, all things being equal to 1987. Are the stock markets overvalued? By some measurements, yes.
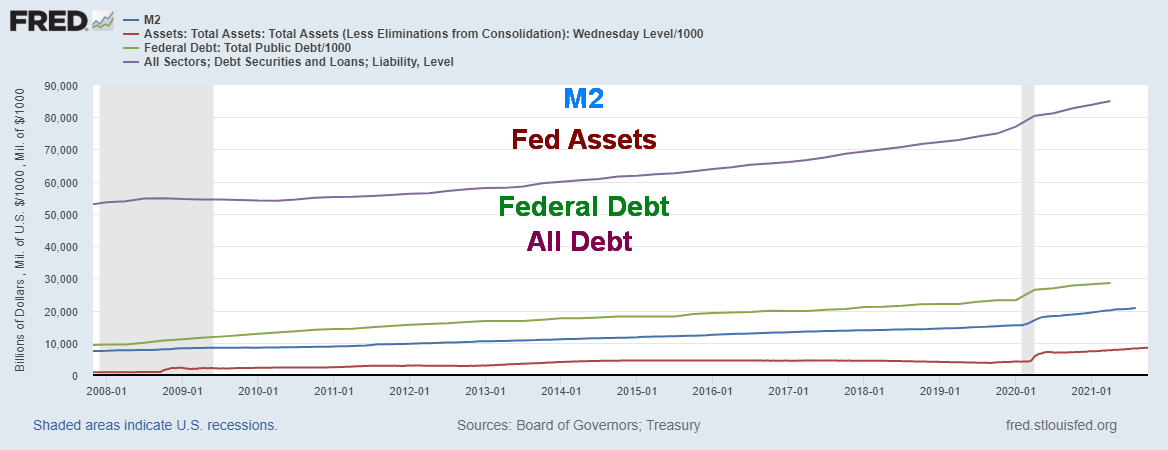
But is a sharply rising stock market any surprise given the explosion in money and debt, especially since the financial crisis of 2008 and exacerbated by the pandemic of 2020–2021? Our chart below shows the growth in M2 +174%, the Fed balance sheet thanks to QE +857%, U.S. Federal debt +202%, and all U.S. debt which includes all government debt, corporate debt, and consumer or household debt +58%. But the real shocking growth (not shown) was M1, up an astounding 1,333% since 2008. The monetary base has grown 638%. Meanwhile, real GDP is up only 23%, while the S&P 500 has gained 197% and gold is up 110%. The massive monetary growth, rather than finding its way into the economy, instead sparked inflationary run-ups in stocks and the housing market. It’s a question of too much money chasing too few goods. The explosive growth in the monetary aggregates does not paint a rosy picture going forward because at some point the gravy train stops. But can the Fed afford to allow it to slow with monetary tightening; i.e., tapering and interest rate hikes? We suspect the Fed can’t, but they may do it anyway because that is what the market is anticipating. Remember, offsetting QE is the Fed doing roughly $1.3 trillion daily of reverse repos—an astounding number never seen before.
When one puts all the debt measured against GDP, the numbers become even more disturbing. U.S. Federal Debt to GDP in 2008 was 76%. Now it is 126% (for comparison purposes Canada’s federal debt to GDP is roughly 54% but with the provinces debt added in it is 118%). Total debt (government, corporate, household) to GDP was 360%. Today it is 370% slower growth, thanks mostly to the consumer retrenching. Consumer debt to GDP was 122% in 2008, but thanks to the consumer deleveraging it has fallen to 95%. The major growth has been in government and corporate debt. Canada actually has the opposite problem due to the growth of corporate and household debt.
Now we have inflation in prices, not because of too few assets but supply chain problems, production problems, and labour problems. Following the September jobs report we are now seeing slowing employment growth and rising inflation. In other words, stagflation.
M2, Fed Assets, Federal Debt, All Debt (Corporate, Consumer, Government) ($billions)
Source: www.stlouisfed.org
The Chinese Evergrande affair may have moved off the front page but it hasn’t gone away. It has merely moved to the middle pages. There is considerable stress in the Chinese real estate market. Evergrande may just be the biggest. Rating agencies have been downgrading Chinese property developers. Some other developers have missed debt payments. Shares of companies have collapsed 60% to 90%. However, Evergrande and its $300 billion of debt remains the biggest. They have missed payments on two U.S. dollar off-shore bonds. They are behind on paying suppliers and investors but none of this has yet triggered a default. The Chinese real estate market remains a house of cards. But, as we have noted, the Chinese government through PBOC does have the wherewithal to control this. The fear that is still there is what if they decide not to. Evergrande remains a threat.
The debt ceiling debate just keeps on getting murkier and can change minute to minute. But, for the moment at least, the Democrats and the Republicans have agreed to push the decision out to December and have increased the debt limit by roughly $480 billion. This is, at best, a stop-gap measure. There is enough wiggle room to make it to December and that’s it—then the fight looms again. Mark December 3 on your calendars as that is the next D-Day. Oddly, during the Trump administration, the debt limit was suspended three times even as the debt grew by $8 trillion, thanks to massive tax cuts and the pandemic. Both parties supported the move. But not now. That was under a Republican president. More troubles lie ahead.
Chart of the Week
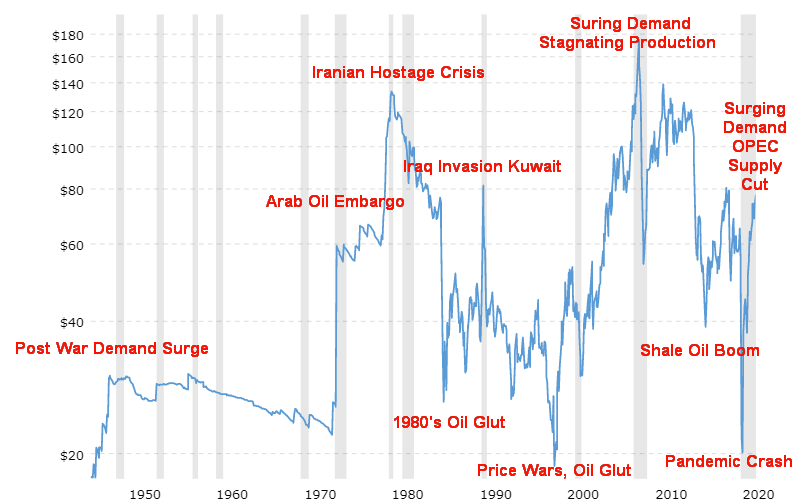
WTI Oil – 1946–2021 Inflation-Adjusted
Source: www.macrotrends.net
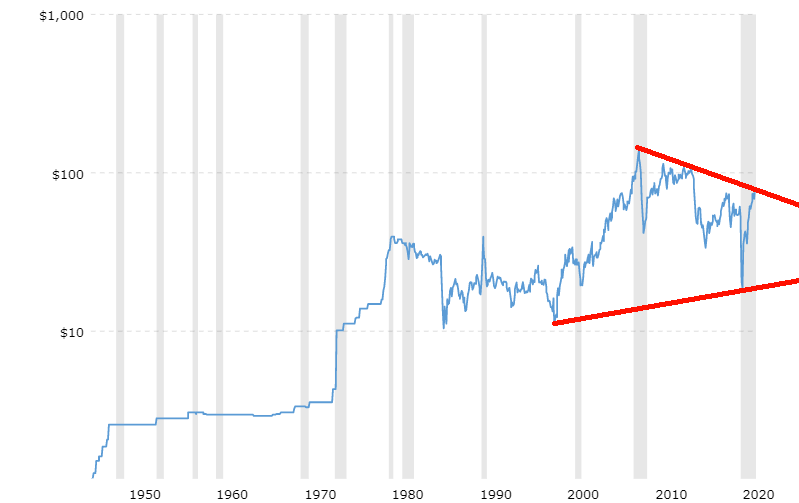
Oil prices have a history of sharp ups and downs. Our inflation-adjusted chart of oil prices from 1946–2021 accentuates those ups and downs. Cue the same chart below, not inflation-adjusted. You can still see the ups and downs. They are just not as distinct (note: we didn’t label the events).
The post-war surge in demand sparked the first significant price rise. Prices rose to $2.57/barrel by 1948 before leveling out over the next twenty years. But the Six-Day War in 1967 followed by the Yom Kippur War in 1973 sparked a backlash against Israel and the U.S. and the Arab Oil Embargo of 1973 sparked a real crisis with shortages in the U.S. and long lineups at the pumps. It also sparked inflation and at the time the steepest recession since the Great Depression. That period culminated in 1979/1980 with the Iranian hostage crisis, oil prices hitting almost $40 ($130 inflation-adjusted), inflation approaching 20%, and followed by an even steeper recession between 1980 and 1982.
Price wars and an oil glut following the high prices of the 1970s contributed to a huge drop in price during the 1980s that extended eventually into the 1990s. Price wars and oil gluts are eventually followed by tightening supplies and a lack of new production due to low prices. As demand surged in the early 2000s, prices soon followed reaching a record $147 in 2008. The financial crisis of 2008, however, resulted in a huge collapse in oil prices, as oil fell 53.5% decline for the year hitting a low near $30. A very dramatic year. Prices recovered back towards $100 but the growing shale oil boom resulted in a price collapse in 2014.
Following a brief recovery, along came the pandemic of 2020 and one of the most dramatic price collapses ever seen as demand collapsed due to lockdowns. Prices briefly went negative, something that was unheard-of. However, once again, lack of new production, OPEC supply cuts, and surging demand as the pandemic eased (but never went away) resulted in sharply rising prices.
WTI Oil – 1946–2021 Not Inflation-Adjusted
Now comes the potential for a difficult winter as energy prices surge. Natural gas (NG) and coal are also leaping in price. WTI oil is up almost 60% in 2021 while NG has gone up even more, up about 130%. Coal prices have exploded, up almost 230% thus far in 2021. Supply squeezes, production not keeping up with demand, supply disruptions, and the trend for corporations and investors towards ESG (Environmental, Social, and Corporate Governance) are amongst the reasons prices have leaped. NG and coal prices have hit the highest level ever in the EU, the UK, and Asia. Gasoline prices have leaped at the pumps. The UK and the EU can’t find drivers to deliver energy supplies. Companies are going bankrupt and gasoline pumps, particularly in the UK, are empty. In the driver’s seat are huge energy suppliers such as Russia, Saudi Arabia, and Iran. The U.S. and Canada are also major energy producers but the major shortages are mostly manifesting themselves in the EU, U.K., and Asia. And once again the difficulty is getting supplies where they are needed. One can’t build a pipeline under the Atlantic or Pacific Ocean even if it were environmentally safe, which is highly questionable.
While there have been attempts to slowly convert to clean energy, the process has been very uneven, contributing to the energy crunch. NG is a relatively clean fuel (except for methane released in the extraction process) but the world’s largest NG producers and reserves are the U.S., Russia, and Iran. The U.S. is on the wrong continent, the U.S. has been trying to block Russia, and the U.S. has sanctions against Iran because of its nuclear program when former president Donald Trump tore up the agreement. Gazprom, the huge Russian producer of NG, alone produces some 12% of the world’s supply. Inventories in the EU in particular are low. Pipeline flows from Russia and Norway, another large producer, have been slow. In the EU prices have leaped roughly 500% in the past year.
But it is not just the EU. China, Brazil, and others are also facing huge price surges and supply constraints. Brazil has lost a lot of power because their rivers are way down and not producing the hydroelectricity they once produced.
The pandemic did its job. As prices plunged, new investment in energy also plunged. But demand leaped as government stimulus programs kicked in. You can’t just turn on a switch and be back up to normal and new production is lagging demand. Not enough gas, squeeze on oil due to supply constraints, delivery problems and more, and renewables not coming on stream fast enough and we are now where we are today. The U.S. and Canada have enough, but exporting it outside North America is a problem. Heaven help us if the Iranian situation blows up and Iran’s already enriching uranium is attacked by either Israel or the U.S. Iran has missiles that could hit the oil fields of Saudi Arabia or the LNG facilities in Qatar or tanker ships in the Gulf. Energy prices would explode through the roof.
There is a huge desire to shift to renewables, but as much as some would like to see an end to fossil fuels that is not going happen. In years to come, there will continue to be an important role for fossil fuels as a source of energy. Dependence on oil will fall but not fast enough to shake the current high prices down.
The peak in 2008 saw oil prices hit almost $180 on an inflation adjusted basis. We still have a long way to go to hit those levels. Oil has an 18-year cycle of troughs according to cycle analyst Ray Merriman (www.mmacycles.com). According to Merriman, evidence of the 18-year cycle was seen in 1986, 2002, and 2020. The half-cycle would be nine years and, in that respect, again starting with the major trough of 1986 observable important lows were seen in 1986, 1994, 2002, 2008, and 2020, assuming the range for the 9-year cycle is 6–12 years. We now appear to be in an up cycle and we have broken the downtrend from the high in 2008. It is difficult to say when the 9-year cycle will crest and from what level.
Nonetheless, the world is facing an energy crunch with surging demand, dwindling supplies and inventories, and delivery bottlenecks. All we need to add to this is a blow-up in Iran, and then oil at $100 might look cheap.
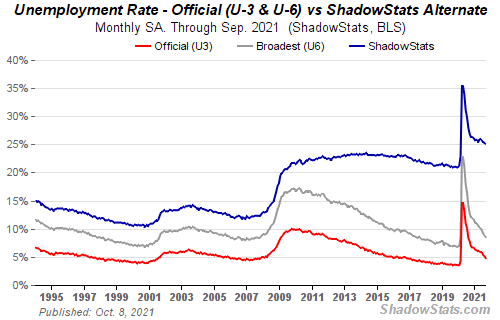
US Job Numbers
Source: www.shadowstats.com
We suppose that would be considered a kicker. Nonfarm payrolls for September came in at a disappointing 194,000 vs. 366,000 in August (note: August was revised upward by 169,000). The problem was the market had expected 500,000. Supposedly in some good news, however, the unemployment rate (U3) fell to 4.8% from 5.2%. Possibly that was a function of a shrinking labour force as the civilian labour force level fell 183,000 in September. The total employed rose by the previously mentioned 194,000 while the labour force participation rate slipped to 61.6% from 61.7%. The employment population ratio rose to 58.7% from 58.5%. A lower participation plus a shrinking labour force means a lower unemployment rate.
So, is it good news (lower unemployment rate) or bad news (much lower nonfarm payrolls)? The U6 unemployment rate (the Bureau of Labour Statistics (BLS) broadest unemployment measure including short-term discouraged and other marginally-attached workers as well as those forced to work part-time because they cannot find full-time employment) slipped to 8.5% from 8.8%. The Shadow Stats (www.shadowstats.com) unemployment number which reflects current unemployment reporting methodology adjusted for the significant portion of "discouraged workers," as defined away in 1994 during the Clinton Administration, came in at 25.1% vs. 25.3%. Despite growing by 194,000, a reminder that the U.S. remains some 5.1 million jobs under where they were in February 2020. The official unemployment rate (U3) at 4.8% is above the 3.5% seen in February 2020. A total of 100.4 million are considered not in the labour force. That’s actually higher than was seen in August when it was 100.1 million. Some 55.9 million are retired while 9.4 million are disabled. Students and others are also included in these numbers. An astounding 36.4 million Americans are considered to be living in poverty and roughly 30 million have no medical insurance. Significantly some 34.5% of the unemployed have been out 27 weeks or longer. That’s down from August’s 37.4%. Still, the number out 27 weeks or longer is some 1.6 million higher than February 2020. Private payrolls increased 317,000. That was offset with a fall in government payrolls, down 123,000. Gains were seen in leisure and hospitality, professional & business services, retail trade, and transportation and warehousing. The losses were in education. Despite full hospitals dealing with the Delta variant, health care employment actually fell 18,000. The poor job numbers saw gold rise, stocks fall, and the U.S. dollar fall while bond yields rose. The belief out there is that this number will not stop the Fed from tapering. There were numerous pundits putting a positive spin on the job numbers on the basis
Canada Job Numbers
Source: www.tradingeconomics.com, www.statcan.gc.ca
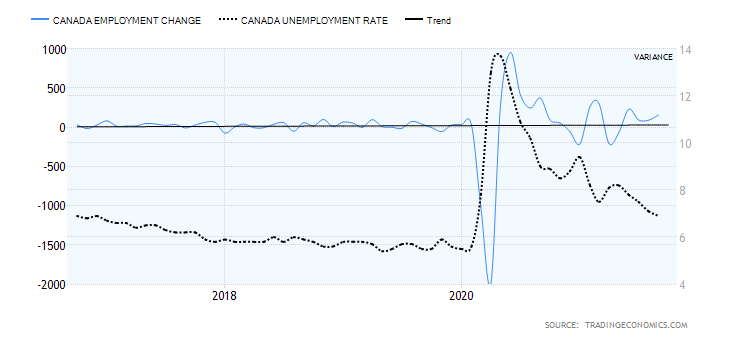
Canada blew the lid off the employment market with a stunning gain of 157,000 jobs in September. The market had expected a gain of only 65,000 which was actually a pretty good number in itself. But this was stunning. Consider the U.S. with 10x the population and GDP only added 194,000 jobs in September. With this stunning gain Canada has now, on paper at least, recovered all of the jobs lost in March/April 2020. Then Canada lost 3,004.5 thousand jobs. They have all been recovered. The U.S. by contrast is still short some 5.1 million jobs from February 2020. The unemployment rate fell to 6.9%, down from 7.1% in August. That remains well short of the 5.7% rate seen in February 2020. The labour force participation rate was 65.5%, up from 65.1% in August. The more people working the higher the unemployment number, all things being equal. The R8 unemployment rate which is the closest to the U.S.’s U6 rate slipped to 10.2% from 11.0%. Even the youth unemployment rate fell, dropping to 11.3% from 11.6%. For Canada it was fourth consecutive rise in jobs and drop in the unemployment rate. Better still, full-time employment jumped 193.6 thousand while part-time employment fell by 36.5 thousand. What could be better? Full-time up, part-time down. Average hourly earnings also rose, up 0.4% in September. The number of people employed is a record at 19,131.2 thousand. This is a lot higher than in February 2020 and reflects the growth of the labour force. So, recovering the jobs lost is great but then the total number in the labour force is a lot higher, so in some respects there is more room for this number to improve
MARKETS AND TRENDS
|
|
|
|
% Gains (Losses) Trends
|
|||||
|
|
Close Dec 31/20 |
Close Oct 8/21 |
Week |
YTD |
Daily (Short Term) |
Weekly (Intermediate) |
Monthly (Long Term) |
|
|
Stock Market Indices |
|
|
|
|
|
|
|
|
|
S&P 500 |
3,756.07 |
4,391.34 |
0.8% |
16.9% |
down |
up |
up |
|
|
Dow Jones Industrials |
30,606.48 |
34,746.25 |
1.2% |
12.2% |
neutral |
up (weak) |
up |
|
|
Dow Jones Transports |
12,506.93 |
14,640.64 |
2.7% |
17.1% |
neutral |
neutral |
up |
|
|
NASDAQ |
12,888.28 |
14,579.54 |
0.1% |
13.1% |
down |
up |
up |
|
|
S&P/TSX Composite |
17,433.36 |
20,416.31 |
1.3% |
17.1% |
neutral |
up |
up |
|
|
S&P/TSX Venture (CDNX) |
875.36 |
877.48 |
1.3% |
0.2% |
down (weak) |
down |
up |
|
|
S&P 600 |
1,118.93 |
1,358.65 |
0.1% |
21.4% |
up |
up |
up |
|
|
MSCI World Index |
2,140.71 |
2,285.87 |
(0.3)% |
6.8% |
down |
neutral |
up |
|
|
NYSE Bitcoin Index |
28,775.36 |
54,574.43 |
16.2% |
83.7% |
up |
up |
up |
|
|
|
|
|
|
|
|
|
|
|
|
Gold Mining Stock Indices |
|
|
|
|
|
|
|
|
|
Gold Bugs Index (HUI) |
299.64 |
240.49 |
5.4% |
(19.7)% |
neutral |
down |
neutral |
|
|
TSX Gold Index (TGD) |
315.29 |
268.88 |
3.0% |
(14.7)% |
down |
down |
neutral |
|
|
|
|
|
|
|
|
|
|
|
|
Fixed Income Yields/Spreads |
|
|
|
|
|
|
|
|
|
U.S. 10-Year Treasury Bond yield |
0.91 |
1.61% |
9.5% |
76.9% |
|
|
|
|
|
Cdn. 10-Year Bond CGB yield |
0.68 |
1.63% |
10.9% |
129.7% |
|
|
|
|
|
Recession Watch Spreads |
|
|
|
|
|
|
|
|
|
U.S. 2-year 10-year Treasury spread |
0.79 |
1.29% |
7.5% |
63.3% |
|
|
|
|
|
Cdn 2-year 10-year CGB spread |
0.48 |
0.94% |
(2.1)% |
95.8% |
|
|
|
|
|
|
|
|
|
|
|
|
|
|
|
Currencies |
|
|
|
|
|
|
|
|
|
US$ Index |
89.89 |
94.08 |
flat |
4.6% |
up |
up |
down (weak) |
|
|
Canadian $ |
0.7830 |
0..8025 |
1.4% |
2.4% |
up |
neutral |
up |
|
|
Euro |
122.39 |
115.72 |
(0.2)% |
(5.5)% |
down |
down |
up |
|
|
Swiss Franc |
113.14 |
107.87 |
0.4% |
(4.7)% |
down |
down |
up |
|
|
British Pound |
136.72 |
136.21 |
0.5% |
(0.4)% |
down |
down |
up |
|
|
Japanese Yen |
96.87 |
89.10 |
(1.1)% |
(8.0)% |
down |
down |
down |
|
|
|
|
|
|
|
|
|
|
|
|
Precious Metals |
|
|
|
|
|
|
|
|
|
Gold |
1,895.10 |
1,757.40 |
(0.1)% |
(7.3)% |
down |
down |
up |
|
|
Silver |
26.41 |
22.70 |
0.7% |
(14.1)% |
down |
down |
up (weak) |
|
|
Platinum |
1,079.20 |
1,028.20 |
5.6% |
(4.7)% |
Down |
down |
up (weak) |
|
|
|
|
|
|
|
|
|
|
|
|
Base Metals |
|
|
|
|
|
|
|
|
|
Palladium |
2,453.80 |
2,073.00 |
8.9% |
(15.5)% |
down |
down |
neutral |
|
|
Copper |
3.52 |
4.28 |
2.1% |
21.5% |
neutral |
neutral |
up |
|
|
|
|
|
|
|
|
|
|
|
|
Energy |
|
|
|
|
|
|
|
|
|
WTI Oil |
48.52 |
79.35 (new highs) |
4.6% |
63.5% |
up |
up |
up |
|
|
Natural Gas |
2.54 |
5.57 (new highs) |
(0.9)% |
119.3% |
up |
up |
up |
|
Source: www.stockcharts.com, David Chapman
Note: For an explanation of the trends, see the glossary at the end of this article.
New highs/lows refer to new 52-week highs/lows and in some cases all-time highs.
Source: www.stockcharts.com
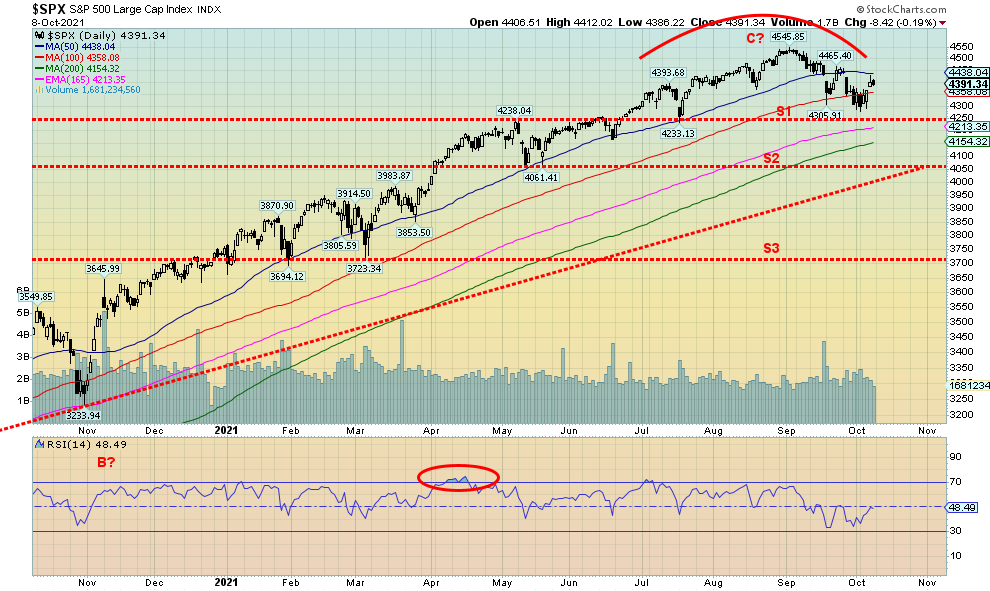
A rebound rally from the recent lows may be over. The markets kept trying to rally all week and on Thursday they did. On Friday the job numbers came out and they were disappointing. Still, the market tried to rally but by the end of the day the bloom was fading and the major indices finished the day slightly in the red. On the week they gained. The S&P 500 was up 0.8%, the Dow Jones Industrials (DJI) gained 1.2%, the Dow Jones Transportations (DJT) was up 2.7%, while the NASDAQ was the weakest with a gain of only 0.1%. The small caps wavered as the S&P 600 was up about 0.1%, but we noted that the Russell 2000 fell 0.3%. We also noted a bit of a divergence with the indices. The KBW Bank Index (BKX) was up 2.3% on the week, making fresh 52-week highs. A loser on the week was the Semi-Conductor Index (SOX), down 0.5%.
In Canada, the TSX Composite was up 1.3% as was the small cap TSX Venture Exchange (CDNX). In the EU, the London FTSE gained 0.6%, the Paris CAC 40 was up 0.7%, while the German DAX gained 0.3%. In Asia, the SSEC and the TKN traded places. China’s Shanghai Index (SSEC) had a rebound up 0.7% but the Tokyo Nikkei Dow (TKN) faltered, losing 2.5%. Who’s right here? One Asian index that looks quite vulnerable is the South Korean Seoul Composite which lost 2.1% and is now trading firmly under its 200-day MA in bear territory. It is now down 11% from its all-time highs seen in June. Some of the world’s biggest companies are listed there: Samsung, Hyundai, Kia, LG, and more. Another Asian index firmly in bear territory is the Hong Kong Hang Seng Index down over 20% from its highs in February 2021. A star has been India’s Nifty 50 which is now once again just shy of its all-time high and well above its 200-day MA. The MSCI World Index (ex U.S.) lost 0.3% on the week. As to the cryptos, well, Bitcoin leaped 16.2% and is back over $50,000. But the move looks corrective and it could fade again.
Indeed, all of the indices looked corrective this past week. Our expectations are that we will soon start another leg to the downside. All appear to be forming tops. The S&P 500 in particular could be forming a head and shoulders top. It is most noticeable on the DJI (noted below), but the S&P 500 could have one as well. The neckline is at 4,300. A breakdown under that level on volume could send the index to near 4,000. That could fit with a rising trendline from June 2020, currently near 4,050. That would be an 11% correction from the all-time highs which fits well with our thoughts on this pullback. The real danger is that, if we break under 4,000 and especially under 3,700, then we could be into crash territory. Recall that in February 2020 the market topped around the 19th but by the 26th was breaking the 200-day MA. After a short-lived rebound it crashed. With the current 200-day MA at 4,154 we need to watch that level carefully. If we just crash through it, we could be set up for a bigger crash. However, that is not expected at this time. The next one should unfold more slowly.
We have the crosswinds of rising inflation, global supply disruptions, a looming energy crisis, political paralysis and an uncivil war, threats from climate change, and more. The weak job numbers are possibly just another sign that things are not as quite as rosy as everyone would like to believe. We would not be surprised if, in the coming week, the market moves down again.
Source: www.stockcharts.com
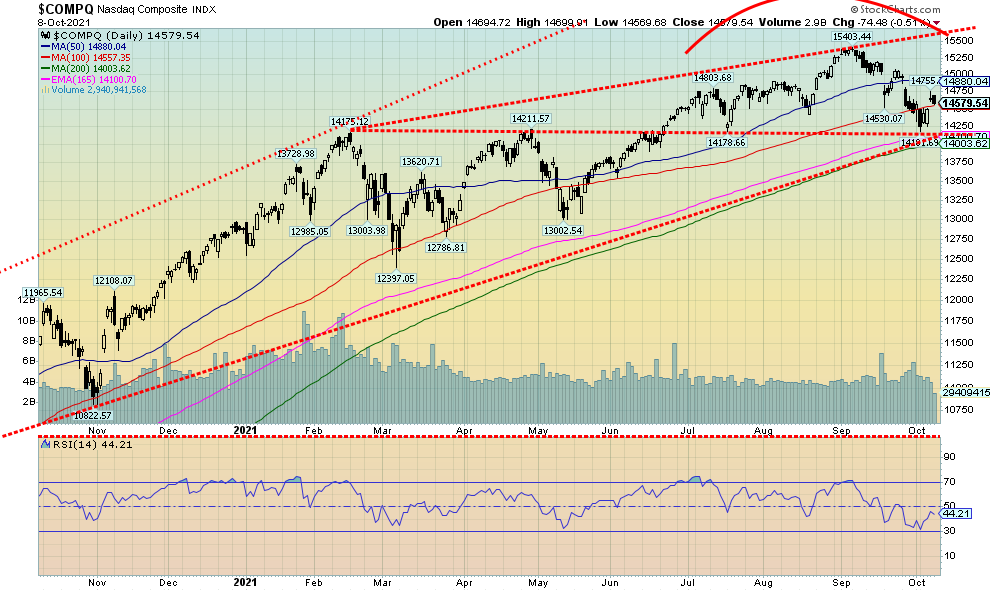
The NASDAQ was the weakest of the major indices this past week with a gain of only 0.1%. We consider the NASDAQ as the main one that will signal the next move and that next move appears to be down. Friday’s job numbers saw the NASDAQ underperform again as the index lost 0.5%. Supply disruptions are hitting the tech stocks that dominate the NASDAQ harder than others. But not the big boys, it seems, as the FAANGs continued to perform reasonably well this past week. For the record, Facebook fell 3.8% as its woes continued with blackouts and attacks on the company, Apple was up a small 0.3%, and Amazon gained a small 0.2%. A big winner was Netflix, up 3.2% to fresh 52-week highs. After all, one needs only a subscription and you sit in the comfort of your TV room. Google also gained up 2.8%. Again, one can sit at their desk or on their phone and access Google products. Microsoft gained 2%, Tesla was up 1.3%, and Twitter jumped 2.8%. The Chinese stocks rebounded sharply with Baidu up 7.0% and Alibaba up 12%. Nvidia closed out the FAANG stocks with a gain of 0.4%. For the NASDAQ, a decline through 14,500 could signal the start of the next move to the downside. Friday’s close was at the 100-day MA. The 200-day MA is down at 14,000 and could easily be a target. The formation of a head and shoulders top is not as clear on the NASDAQ as we noted below on the DJI. Still, if it is then a breakdown under 14,160 could point to potential targets down to 12,900/12,950. That would constitute a decline of roughly 16% for the NASDAQ.
Source: www.stockcharts.com
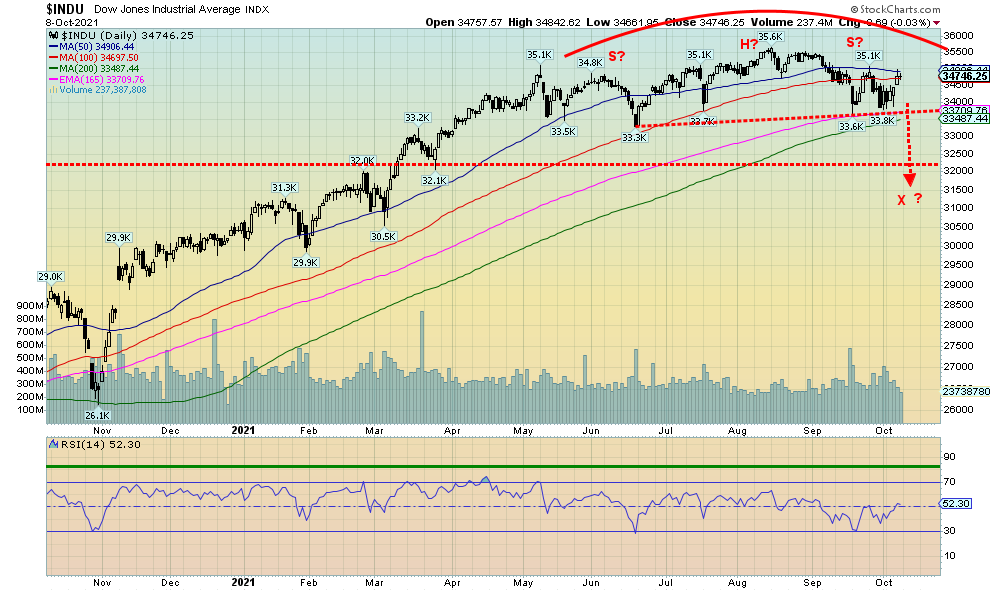
We noted the possible topping patterns on both the S&P 500 and the NASDAQ but it is the pattern on the DJI that has the most distinct potential head and shoulders top look. None of this is to suggest that the pattern will be fulfilled. Right now, it is a potential head and shoulders top pattern. It is not confirmed until the pattern breaks down. In this case it would be a clear breakdown on volume under 33,700. The potential downside target would then be the 31,400 zone. That would take the DJI into bear territory and down about 12% from the high. That is still within the realm of possibility for this correction that we believe is not yet complete. If instead the DJI moved higher up through 35,100 then odds would begin to shift that the pattern is not a head & shoulders top and new highs may lie ahead.
Source: www.stockcharts.com
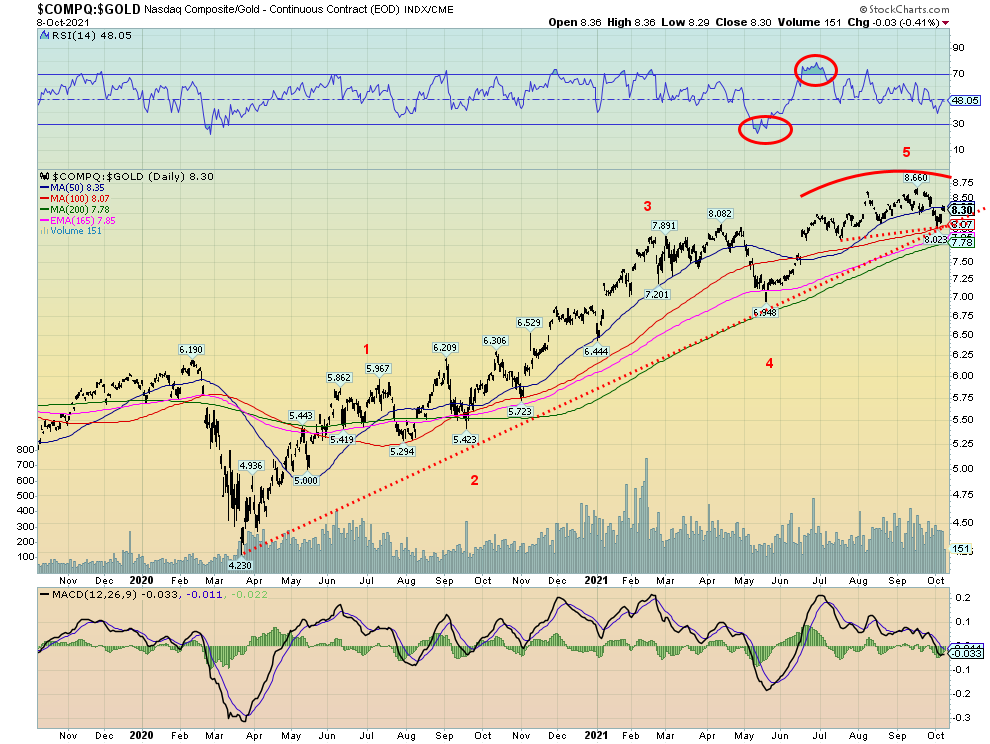
Here is a potentially interesting one. This is the NASDAQ/Gold ratio. We appear to have completed five waves up from the March 2020 lows. During that period the NASDAQ has outperformed gold. The NASDAQ is up 112% while gold is only up just over 18%. The ratio appears to forming a top. The neckline or breakdown zone is at 8.00 and it firmly breaks down under 7.80. The ratio is currently at 8.30. New highs could change that scenario although given the second high at 8.66 was barely above the first high at 8.62 we’d suspect that the ratio was making what we call three thrusts to a high. In other words, it would still be a high. Naturally this breakdown is not yet confirmed but given the pattern, plus the completion of what looks like a five wave advance odds favour one switching to gold and out of the NASDAQ.
Source: www.stockcharts.com
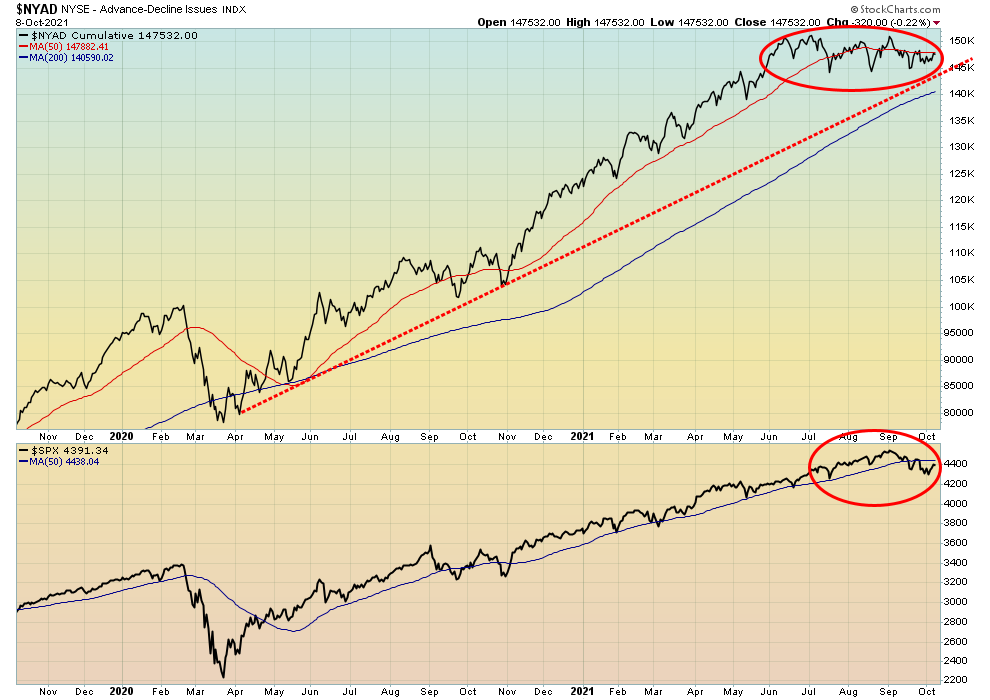
We’ll have to keep an eye on the NYSE advance/decline line as it continues to diverge from the S&P 500 price action. At the top, the S&P 500 was making new highs but the AD line was not. Now the S&P 500 has made a lower low but the AD line did not. We also saw the same on the VIX Volatility Index. The divergence here is not quite as obvious as it was at the recent high but is still worth noting and following for any signs that the market is more prepared to turn up. It could also be that this is temporary and if the S&P 500 plunges again to new lows, the AD line confirms by also making new lows. However, continued divergences between the AD line and index could suggest that we could watch for bottoming action at some point going forward.
Source: www.stockcharts.com
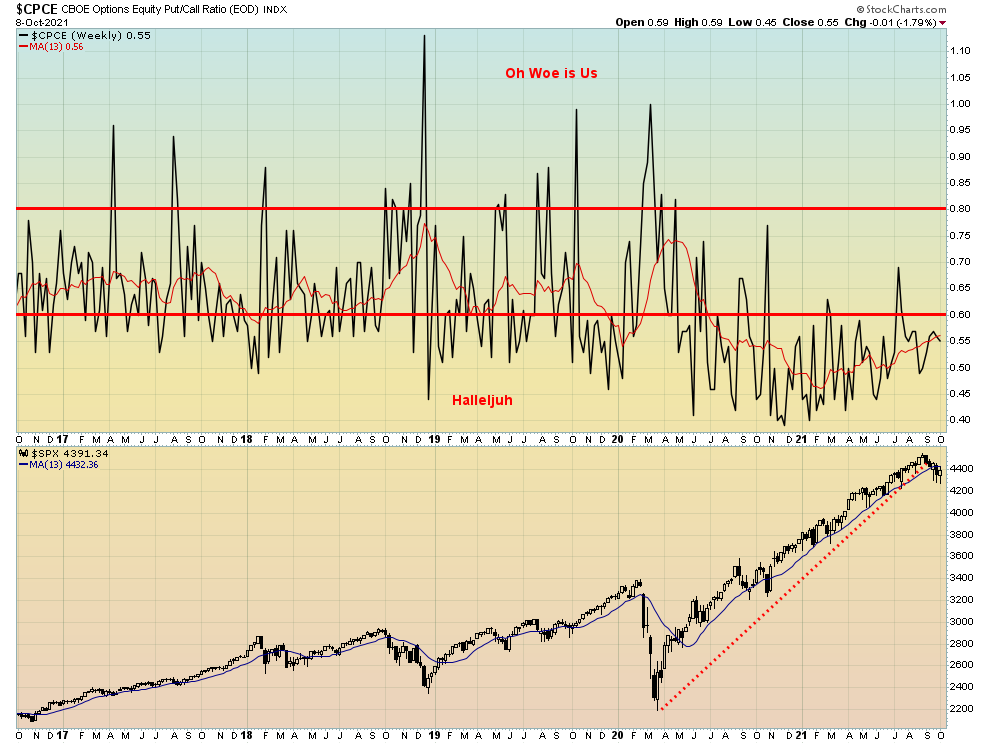
Put/Call ratio still bullish with a reading this week of 0.55 which is lower than the previous week. As we can see, the S&P 500 has broken an uptrend line from the March 2020 pandemic low but the put/call ratio has barely registered above 0.60. The market remains bullish despite the growing negative background.
Source: www.stockcharts.com
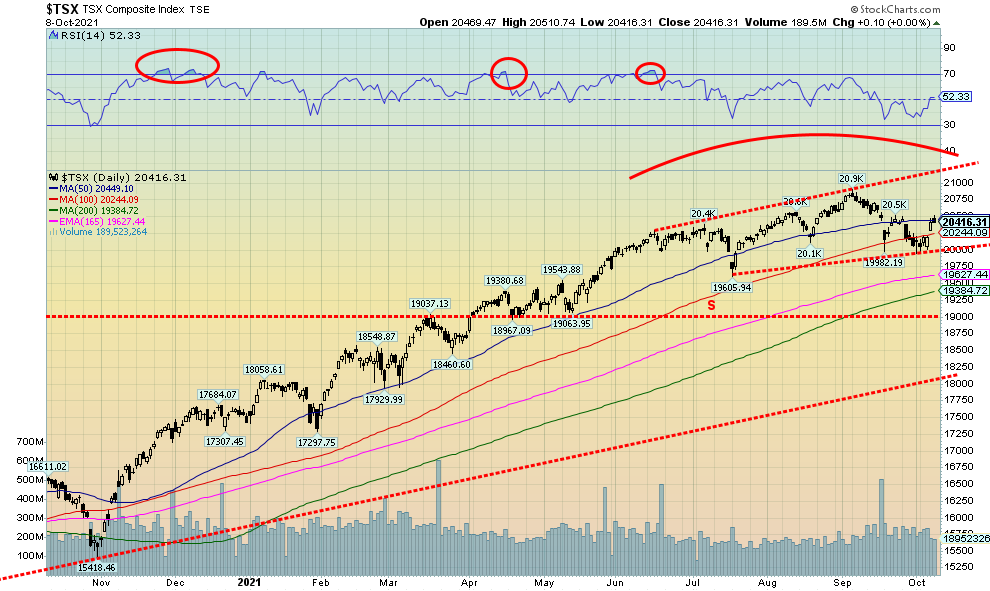
The TSX Composite gained 1.3% this past week as did the TSX Venture Exchange (CDNX). The gain for the CDNX helped push it back into positive territory for the year. Of the 14 sub-indices, four were down while 10 were up. Leading the way to the upside was Energy (TEN) with a stellar gain of 6.8% and hitting a new 52-week high. Other significant gainers were Golds (TGD) up 3.0%, Materials (TMT) up 3.3%, and Metals & Mining (TGM) up 2.0%. Leading the losers was Health Care (THC), down 4.1%. Seems that pharmaceuticals are good but biotech not so good. For the time being the TSX Composite appears to have found support at 20,000. However, the rebound has only taken us back to the 50-day MA near 20,450. On Friday, an initial attempt to move higher failed and the TSX pulled back, closing at 20,416. A break under 20,250 spells trouble that the 20,000 support could soon fall. New highs above 20,500 would continue to give life to any nascent rebound. The TSX, like the other indices, appears to be forming some sort of topping pattern although the formation on the TSX is not as clear as some of the U.S. indices. We may need some additional work here to form what might a right shoulder. The neckline would be at 20,000 and a firm breakdown under that level could target down to 18,700. Note that would below what believe to be a key support line at 19,000. After falling initially to the 20,000 level the rebound has looked corrective in an ABC- type pattern. Only a move back above 20,750 could turn the market more decidedly bullish.
Source: www.stockcharts.com
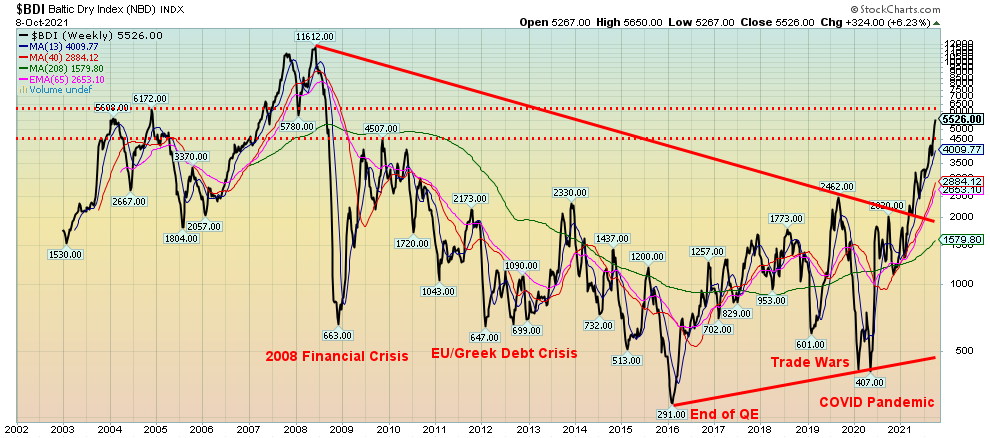
The Baltic Dry Index (BDI) keeps on rising. The BDI is a measurement of the cost of shipping, particularly grains and coal by sea. Other freight indices have also been rising sharply so the BDI acts as a proxy for all of them. The BDI is up over 1,300% since the lows seen in March 2020. This past week the BDI was up 6.2% and has posted solid gains over the past month. Constraints are being seen, particularly the congestion in China. It also feeds back into the price of everything and fuels inflation. The next level to breach is seen at 6,000/6,100. Once past that level we are up into the levels seen in 2007/2008 when records were set, hitting a high of 11,612 in May 2008 before collapsing during the 2008 financial crisis.
U.S. 10-year Treasury Bond/Canadian 10-year Government Bond (CGB)
Source: www.tradingeconomics.com, www.home.treasury.gov, www.bankofcanada.ca
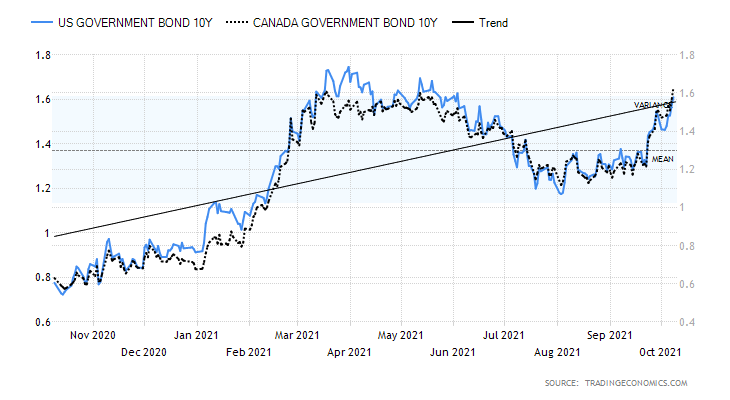
The U.S. 10-year treasury note hit its highest level since early June 2021, reaching to a high of 1.61% on the week. This level is now a make-or-break one for the 10-year. A firm break and close above 1.61% would confirm to us that the recent high of 1.74% is going to fall. A failure here could mean rates fall once again. Odds have now shifted to favouring the upside for the 10-year yield. A break back under 1.40% would confirm a breakdown underway. Fear of inflation and the ongoing debt limit debacle are helping to push yields higher. The debt limit debacle is raising fears that the U.S. could see its credit rating fall further. Recall that during the debt limit debacle in 2011 the U.S. saw its AAA rating drop down to AA+. Another downgrade could send it to AA-. Higher U.S. treasury yields translate into higher yields for everyone who borrows. Hence the danger of playing politics with the debt limit.
The rise to 1.61% this past week was despite the weaker than expected job numbers. Fear of tapering remains as does fear of inflation as, globally, the energy crunch appears to be intensifying, raising fears of higher and persistent inflation. Weak economy + higher inflation = stagflation. Probably not the stagflation we saw during the 1970s when interest rates hit 20%, but then we don’t have to get that high now. Even 5% could prove to be a back-breaker. In this type of scenario, the stock market does poorly but gold and commodities could soar.
Even Canada did not escape higher rates this past week as the Canadian Government 10-year bond (CGB) rose to 1.63%. We haven’t seen the Canadian 10-year higher than the U.S. 10-year in quite a long time. BofC governor Tiff MacKlem admitting that inflation might last longer and higher than expected helped push the 10-year higher as did the stellar job numbers that came out Friday. Canada, unlike the U.S., has fully recovered the jobs that were lost during the pandemic collapse of March/April 2020.
There were not a lot of numbers this past week outside of Friday’s job numbers. Initial claims surprised to the downside, coming in at 326,000 below the previous week’s 364,000 and below the expected 348,000. Consumer credit expanded $14.3 billion in August but July saw a rise of $17.2 billion and the market had expected a rise of $17.5 billion. If consumers aren’t spending or are pulling back, that bodes poorly for the recovery. The manufacturing ISM number known as the Markit Services PMI for September was 54.9 slightly below August’s 55.1 and slightly above expectations of 54.4. Numbers to watch this coming week include FOMC minutes on October 13, PPI on October 14 expecting a gain of 0.6% vs. 0.7% previously, and retail sales for September expecting a decline of 0.2% vs. a gain of 0.7% in August. The weakness is in autos as once one strips out the auto component the expectation is for a gain of 0.5% vs. a gain of 1.8% in August. Year-over-year retail sales are expected to be up 15.1% but that is not inflation or population adjusted. The Michigan Consumer Sentiment Index is expected at 73.8 vs. 72.8. Consumer confidence has been flagging because of the rise of the Delta variant. The Fed’s Williams, Bostic, and Brainard all speak this coming week.
Pressure may remain on the 10-year going forward. The next FOMC is November 2-3. At that meeting we may find out whether the Fed plans on tapering. The stock market could also feel the pinch up until the November meeting.
Source: www.stockcharts.com
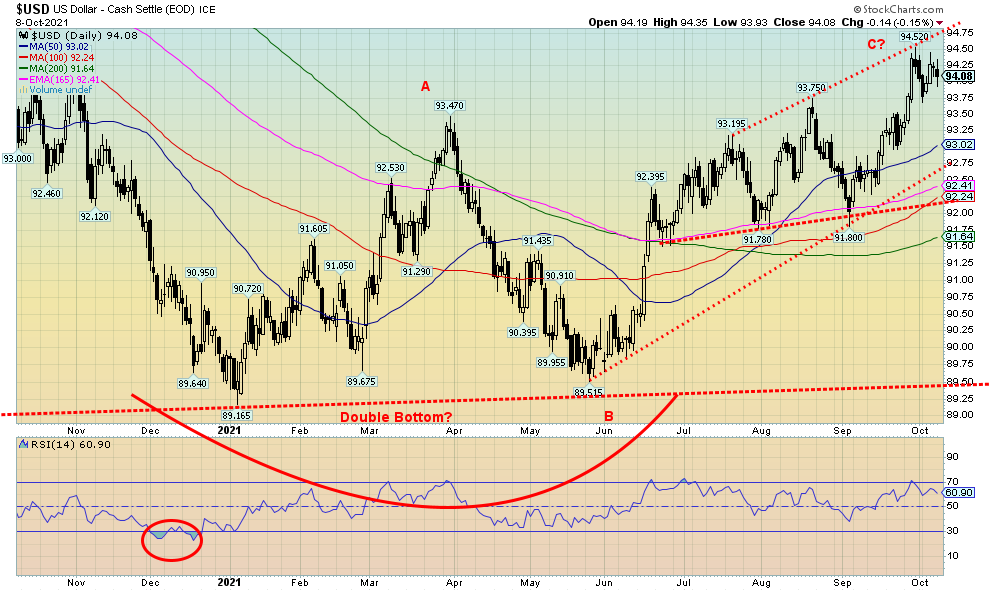
If we are believer in divergences at important tops and bottoms, then this past week may have given rise to a classic one in the currencies. The US$ Index tried to rally back but its rally fell short of the recent high at 94.52 before faltering once again on Friday after the weaker than expected job numbers. However, the euro diverged. While the US$ Index was flat on the week, the euro fell 0.2% and printed new lows for the current down move. That was a divergence with the U.S. dollar. If that’s correct, then we should see the US$ Index move lower going forward. We continue to note that the US$ Index made what appears to us as a double zig-zag from the May low at 89.51. A breakdown under 93.65 will confirm that the next direction is down. Then the next important point to break will be at 92.75. Under 92.25 a major sell-off could get underway. The US$ Index has also completed what looks to us as three thrusts to a high. First a high of 93.20 in July, second the high of 93.75 in August, and finally the recent high of 94.52 in September. We often see this pattern at important highs. But, as noted, the pattern only completes once we break down under 92.25. And, of course, we see preferably no new highs above 94.52. Continued signs that the U.S. economy is weakening would be helpful in pushing the US$ Index lower.
Source: www.stockcharts.com
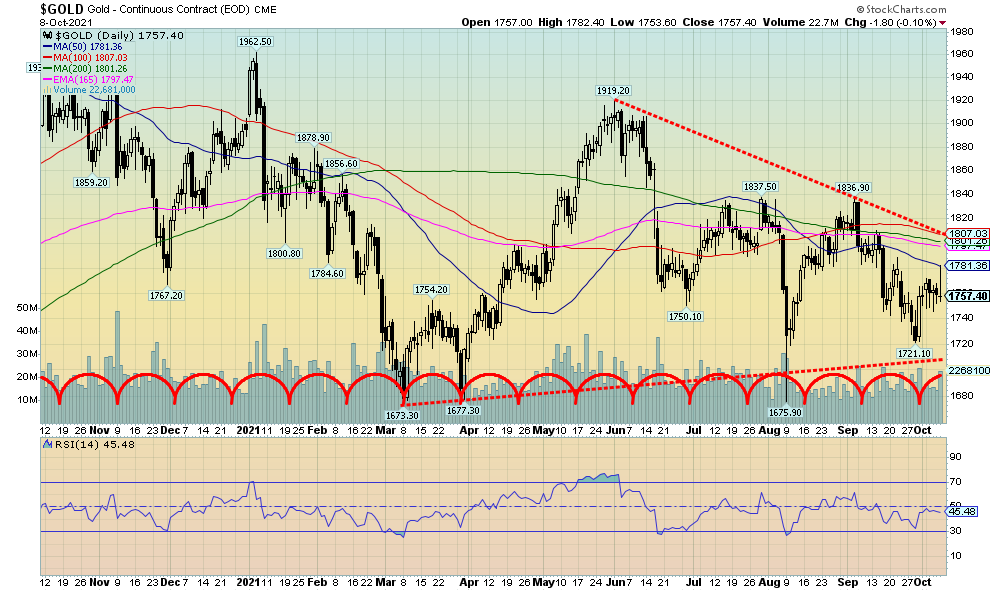
Friday’s weaker than expected job numbers initially got gold excited and, in a flash, gold traded some $20 higher. Then taper worries came back and gold sunk back to unchanged and even briefly went negative. The week became a wash as gold actually slipped about 0.1%. Still, gold left no real negative signs on the chart and the huge doji (a hesitation candlestick) did not quell our bullish thoughts. The small cycle low appears to have come in on target and the next cycle low is not due until October 20. If the bullish scenario is right, then it should be a higher low. Silver managed a gain of 0.7% but the real gains came with platinum up 5.6% and palladium up 8.9%. Copper also saw gains up 2.1%. The gold stocks also had a good week with the Gold Bugs Index (HUI) gaining 5.4% and the TSX Gold Index (TGD) up 3.0%. Could they be leading? To end any discussion, or at least start to end any discussion of downside risk, we need to take this week’s high near $1,781 this coming week. In reality, we need to break out over $1,800/$1,810 to suggest our low is in. We note the downtrend line currently near $1,807 and the 200-day MA near $1,801. Hence, they highlight the importance of taking out those points. And not just an intraday take-out but close over that level and then do it for at least three consecutive days. The initial wave up from the $1,721 low unfolded in five, suggesting it was an impulse wave. Since then, the action has been an awkward correction. If our impulse wave is correct, then we should soon start another wave to the upside.
Besides taper talk, gold was also caught twixt and tween higher yields on the 10-year on Friday and the fact that the US$ Index sold off. Higher yields were negative but a weaker dollar was positive. Our hopes now hold on the fact that platinum, palladium, copper, and the gold stocks all put in a positive week and could be leading the way up. Follow-through to the upside this coming week is now important. Danger appears if we break back under $1,740 and, under $1,720 we could be breaking down, targeting potentially as low as $1,450. A breakout over $1,810 that is sustained could then target up to $2,050. We have formed what appears to be a large symmetrical triangle and the breakouts either way suggest a strong move either up or down.
Source: www.cotpricecharts.com
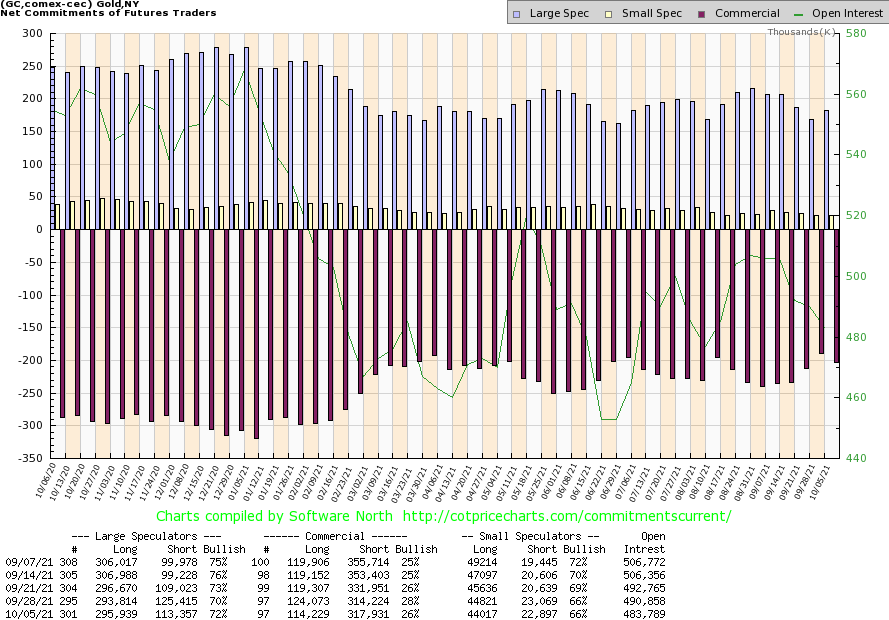
We were somewhat disappointed to receive our COT report and find that the commercial COT (bullion companies and banks) had slipped back to 26% from 28%. Not exactly what we wanted to see if we are to remain bullish. Still, overall, the commercial COT is at its best levels in over a year. The large speculators COT (hedge funds, managed futures, etc.) rose to 72% from 70%. For the commercial COT, short open interest rose over 3,000 contracts while long open interest fell almost 10,000 contracts. Commercials, it would appear, sold the rally this week and were probably behind the drop in the gold price on Friday following the initial $20 gain seen for gold on Friday after the job numbers. However, this report only goes to October 5 and not to October 8. Given that it’s Columbus Day on Monday, we are not sure whether we’ll see a COT report next Friday. Markets are open in the U.S. on Monday but not banks and government.
Source: www.stockcharts.com
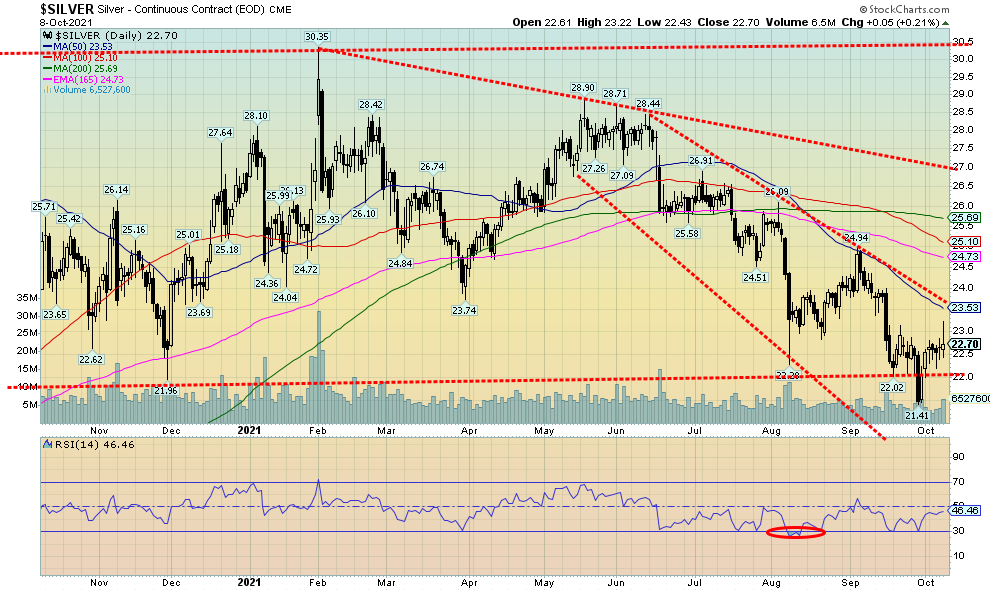
Unlike gold, silver managed to eke a gain of 0.7% on the week. The breakdown under $22 is looking more and more like a false breakdown meant to trap shorts (or take out longs that placed stops near $22). It’s what we call a washout as in this case wash out all the shorts just below a key breakdown point. Once silver busted under $22 all the talk became how silver was now poised to fall to $18 (or lower). It didn’t—silver rebounded and closed back over $22. Silver has now added to the gains. We are far from out of the woods but it is a start. A breakout doesn’t occur until we are over $23.50 and, in reality, we can’t breathe easier until we are back over the 200-day MA currently near $25.60. Since we are nowhere near out of the woods just yet, we have to stay focused on the downside risk. A break back under $22.40 would be a short-term negative. That in turn could set up a retest of $22 and if $22 broke again then we would be concerned that the $18 target the bears were suggesting could become a reality. Further gains this coming week now become almost imperative.
Source: www.cotpricecharts.com
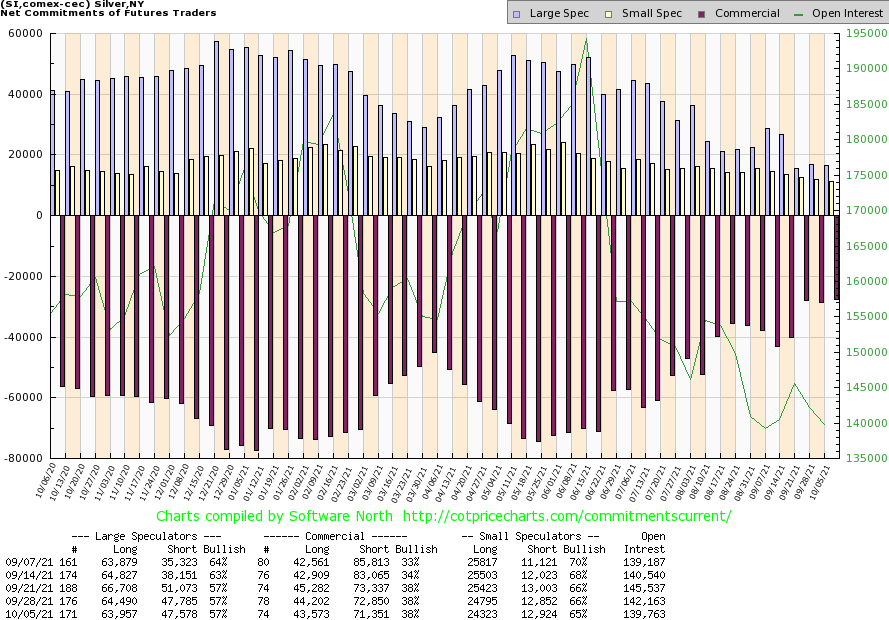
The silver commercial COT was unchanged this past week at 38%. Naturally, we would have preferred to see it improve further. There was little movement. Short open interest fell roughly 1,500 contracts while long open interest was down just over 600 contracts—small movements. The large speculators COT was also unchanged at 57%, a level that is pretty low for them, showing how bearish they are. There wasn’t a lot of movement in their open positions either one way or the other. We’d have preferred to have seen another rise in the commercial COT, but we’ll take this as it remains the most bullish we’ve seen in over a year.
Source: www.stockcharts.com
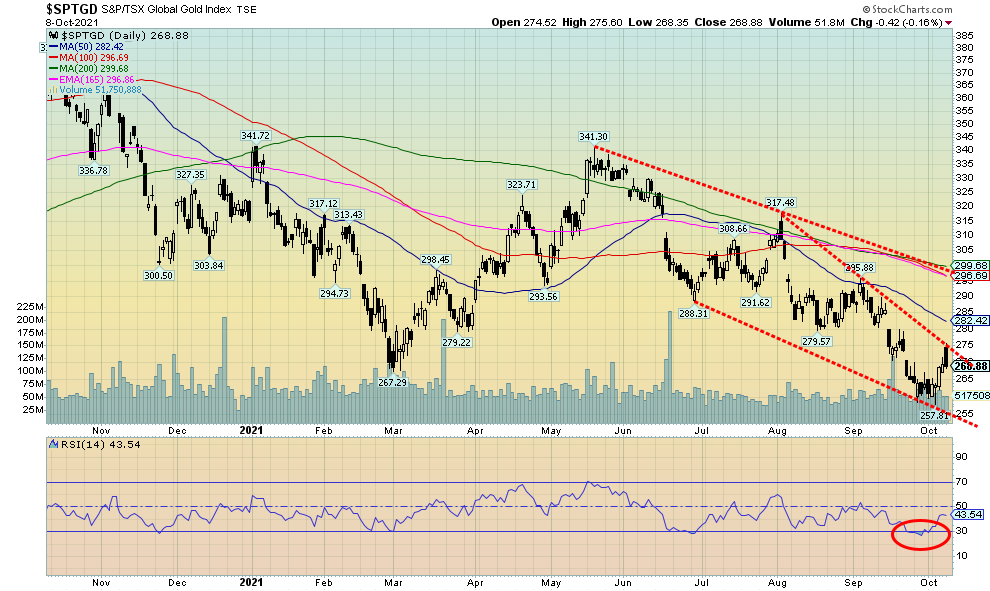
For the first time in five weeks the gold stocks put in a decent up week. The TSX Gold Index (TGD) gained 3.0% while the Gold Bugs Index (HUI) was up 5.4%. Both remain down on the year with the HUI off 19.7% and the TGD down 14.7%. The gain was a welcome relief, even if Friday’s action started out strong and then faded as gold/silver failed to hold their early gains. With both gold and silver relatively flat on the week, the gain this week for the gold stocks could be suggesting that the gold stocks are now leading. That may be the case but we’ll feel more comfortable once the TGD breaks out of what appears as a descending wedge triangle. The Friday rebound touched the breakout line and then faded. It’s possible that the fading was because those who jumped in at the recent low saw the line as well and unloaded for quick profits. A good move over 275 will confirm a breakout, but we’d be more comfortable once the TGD clears and closes over the falling 50-day MA near 282. A somewhat similar pattern on the HUI saw it briefly penetrate its resistance line on Friday and touch up to the 50-day MA but, like the TGD, it fell back after. Still, the HUI closed higher on Friday while the TGD was basically flat. The Gold Miners Bullish Percent Index (BPGDM) fell to a recent low of 16.7, the lowest level seen since March 2020, and then closed at 20.0, indicating that we have possibly seen a low. But it is now show-me time. If the gold stocks are truly leading then this coming week should see further gains.
Source: www.stockcharts.com
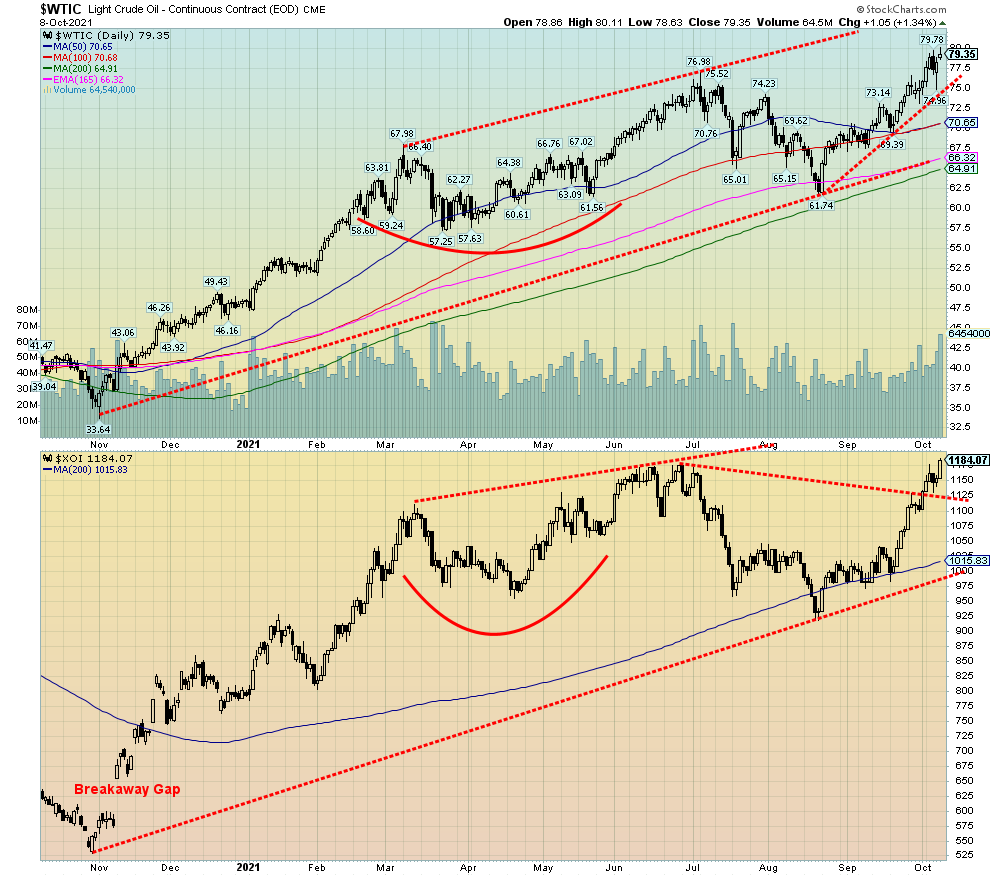
Demand up. Supplies down. Delivery disruptions. Winter nearing. Countries racing to secure energy supplies. Could we be set up for the perfect storm? We noticed that gasoline prices at the pump hit the highest level we can recall. Consumers could experience sticker shock this winter for fuel, whether it be gas or oil or whatever their heating method is. Both oil and natural gas (NG) hit 52-week highs this past week. However, only NG hit a high, then reversed and closed lower. WTI oil surged 4.6% while NG lost 0.9%.
The energy stocks didn’t ignore the rising prices. The ARCA Oil & Gas Index (XOI) rose 4.5% while the TSX Energy Index (TEN) was up 6.8%. They hit fresh 52-week highs as well.
Energy has become a problem across the globe, particularly in the EU and Asia. We should add the U.K. as well but we are also seeing the impact here in North America. And it is not just oil and NG; it is coal as well that has surged in price. Propane prices have soared too. An oil spill off the coast of California didn’t help either as environmentalists have constantly warned of oil spills from either pipelines or tankers. The recent hurricanes in the Gulf also left behind considerable environmental damage due to spilled oil. Then there are the commitments to lower emissions by 2030. Either that is not going to happen or prices are going to be pushed even higher or both.
Could we see record oil prices taking out the high of 2008 at $147? The simple answer is yes if the events and conditions all come together. As we noted earlier, if the U.S. or Israel decides to hit Iran then the worst nightmares will come true. And out of all of this another possibly steeper recession could follow. Recall that sharply rising oil prices contributed to the 1973–1975 recession, the 1980–1982 recession, the 1990–1991 recession, and even the 2007–2009 recession.
Once we are through $80, the odds begin to improve that we could see $100. A minimum target should see WTI oil hit $92. Add in the fact that meteorologists are predicting a cold winter. Warming in the Arctic is actually bad for cold in the south because the cold air that is usually trapped in the Arctic escapes and moves south, including all the way down to Mexico. If meteorologists are correct, then a cold winter could send oil prices through $100.
Everyone thought OPEC was going to add more supply. They haven’t really. Okay, some. And Saudi Arabia and Russia are in the driver’s seat for supplies to Europe and Asia. If sanctions were lifted on Iran there would be more supply there. That is probably not going to happen anytime soon. Shipping and facilities are the hard part for the U.S. and Canada to send their oil outside North America. Besides, the U.S. still imports oil to the tune of around 7.8 million barrels per day (bpd). Canada and Mexico provide over 60% of the imported oil but 11% comes from OPEC. 98% of Canada’s exported oil goes to the U.S. Most of the U.S.’s exported oil also remains in North or South America.
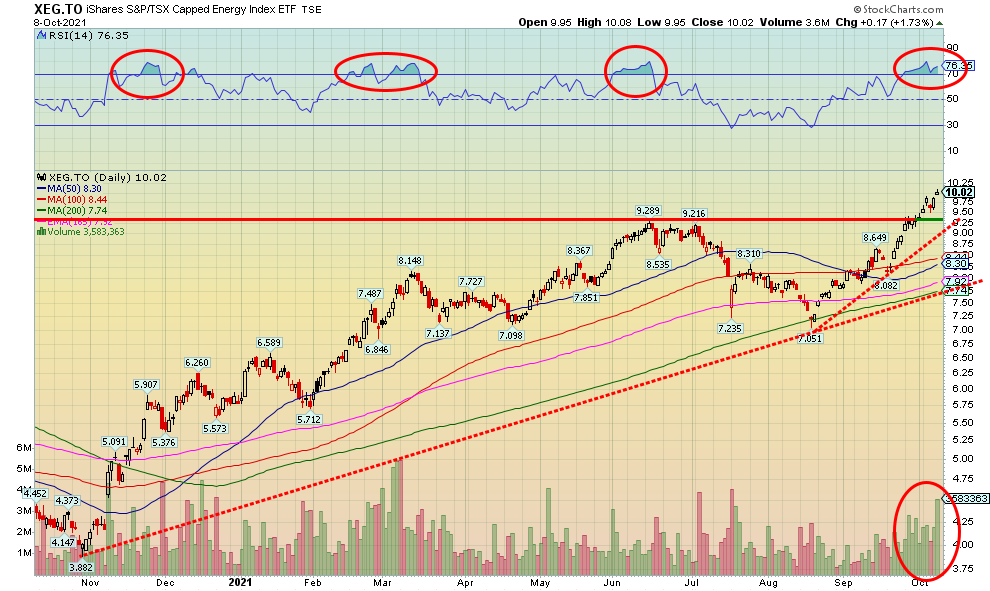
Is the perfect storm brewing?
Source: www.stockcharts.com
We don’t normally show stocks in our weekly commentary but in this case, we thought we’d point out the breakout for in this case the S&P Capped Energy Index ETF (XEG/TSX). We are using this as a proxy for other energy ETF’s (there are a few) plus the individual stocks and is not a recommendation to buy this one in particular. As one can see we have now broken above the highs seen in May/June. Arguably we could say we have potential to rise to at least $11.50. Initial support and ideal place for a stop is at $9.25. A major breakdown would occur under $7.75. XEG also pays a dividend currently yielding about 2.5%. If there is a concern it is that the RSI is now over 70 and in overbought territory. Volume has picked up but doesn’t appear to have peaked just yet. We are seeing similar signs on other energy ETFs and individual stocks as well. Note the high volume seen at the peak back in March 2021. On the other hand, the high volume recently was on the breakdown in July 2021. So, it works both ways. If an energy crunch is truly underway stocks like the XEG would have room to move higher still.
Copyright David Chapman, 2021
|
Charts and commentary by David Chapman Chief Strategist, Enriched Investing Inc. Phone: 416-523-5454 Email: david@davidchapman.com dchapman@enrichedinvesting.com Twitter: @Davcha12 October 11, 2021 |
|
GLOSSARY Trends Daily – Short-term trend (For swing traders) Weekly – Intermediate-term trend (For long-term trend followers) Monthly – Long-term secular trend (For long-term trend followers) Up – The trend is up. Down – The trend is down Neutral – Indicators are mostly neutral. A trend change might be in the offing. Weak – The trend is still up or down but it is weakening. It is also a sign that the trend might change. Topping – Indicators are suggesting that while the trend remains up there are considerable signs that suggest that the market is topping. Bottoming – Indicators are suggesting that while the trend is down there are considerable signs that suggest that the market is bottoming. |
Disclaimer
David Chapman is not a registered advisory service and is not an exempt market dealer (EMD) nor a licensed financial advisor. We do not and cannot give individualised market advice. David Chapman has worked in the financial industry for over 40 years including large financial corporations, banks, and investment dealers. The information in this newsletter is intended only for informational and educational purposes. It should not be considered a solicitation of an offer or sale of any security. Every effort is made to provide accurate and complete information. However, we cannot guarantee that there will be no errors. We make no claims, promises or guarantees about the accuracy, completeness, or adequacy of the contents of this commentary and expressly disclaim liability for errors and omissions in the contents of this commentary. David Chapman will always use his best efforts to ensure the accuracy and timeliness of all information. The reader assumes all risk when trading in securities and David Chapman advises consulting a licensed professional financial advisor before proceeding with any trade or idea presented in this newsletter. David Chapman may own shares in companies mentioned in this newsletter. We share our ideas and opinions for informational and educational purposes only and expect the reader to perform due diligence before considering a position in any security. That includes consulting with your own licensed professional financial advisor.


