
“Speculators buy the trend; investors are in for the long haul; "they are a different breed of cats." One reason that people lose money today is that they have lost sight of this distinction; they profess to have the long term in mind and yet cannot resist following where the hot money has led.”
—Edwin Lefèvre, American journalist, writer, diplomat, author of Reminiscences of a Stock Operator (1923); 1871–1943
"Bottoms in the investment world don't end with four-year lows; they end with 10- or 15-year lows."
—Jim Rogers, American investor, financial commentator, co-founder of Quantum Fund and Soros Fund Management, creator of Rogers International Commodities Index (RICI); b. 1942
"With a good perspective on history, we can have a better understanding of the past and present, and thus a clear vision of the future."
—Carlos Slim Helu, Mexican business magnate, investor, philanthropist, one of the richest people in the world, richest in Latin America; b. 1940
Jim Rogers may be a bit of a curmudgeon; however, he is a very wealthy one. He, along with billionaire George Soros, founded the Quantum Fund back in 1973. He was also involved with Soros in Soros Fund Management. The Quantum Fund returned an incredible 4,200% from 1973 to 1980 during a period the S&P 500 was up 47%. The Quantum Fund became quite famous in 1992 when it broke the Bank of England (BOE) as it bet against the British pound and netted roughly $1 billion and again in 1997 when they made another fortune shorting Asian currencies during the Asian currency crisis. The Quantum Fund had its hiccups too as the 1998 Russian/LTCM collapse cost the fund $2 billion.
Rogers has been well known for his views on the markets and has more recently been warning about the overvalued U.S. stock market and the overvalued U.S. dollar. He freely admits that sometimes his timing is not quite right. With that in mind, we were curious about his quote above that says bottoms in the stock market don’t end with four-year lows; they end with 10- or 15-year lows. Ray Merriman, who we follow (www.mmacycles.com), notes an 18-year long cycle. Even longer cycles are 36 years and 72 years. As with all cycles, they have ranges. The 18-year cycle range is 15–21 years. The last 18-year cycle bottomed in March 2009. The next one is due 2027 +/- 3 years. Merriman has noted there were a couple of instances where the 18-year cycle contracted to 13 years, setting up the potential for the current cycle to bottom around 2022 instead.
Working out cycles is never easy, mostly because of the potential range of possibilities. That’s why other technical tools are needed to help give us clues. The 18-year cycle can break down further into three 6-year cycles (5–8 years) or two 9-year cycles (7–11 years). Sometimes we get both. The March 2020 pandemic crash came 11 years after the March 2009 financial crisis low. So that fits with the half-cycle low. But there was also an important low in February 2016, seven years after the March 2009 low, suggesting that was the 6-year cycle low. The next 6-year cycle low could be due in 2022.
Certainly, the conditions are there. The resurgence of the Delta variant has sent economists scrambling, lowering their growth projections as cases rise and ICU beds fill up. Supply disruptions continue to dominate markets. There are equipment shortages, including semiconductor chips and transportation issues all across the U.S., Europe, and China. Raw material shortages have sent inflation higher and climate disasters such as Hurricane Ida and drought are adding to the woes in disrupting supply chains. Climate change poses a real risk to the global economy; however, many including some of those currently in power still refuse to take it seriously.
The fight over the U.S. debt limit, if not resolved by October, could send interest rates higher and result in a U.S. debt default. Some economists, government officials, and business leaders have described failure to raise the debt limit as akin to a “Financial Armageddon.” Who will blink first? During the 2011 debt limit stand-off, the S&P lowered the U.S. debt rating to AA+ from AAA. Interest rates have been so low for so long that even a slight rise in rates could upset markets considerably, sparking a U.S. dollar collapse along with a stock market collapse. Politically, society remains highly polarized, posing another potential risk if it turns more violent than what has been seen thus far.
All this fits well into events since 2000 that have shaped where we are today. The 9/11 attacks and the subsequent 20-year War on Terror have changed the world and the way we fly forever. 2005’s Hurricane Katrina was the first major natural disaster to hail the coming climate crisis. The 2008 financial crisis resulted in endless low interest rates, QE, and massive monetary stimulus to save the world from a potential financial meltdown and economic depression. The 2020 COVID pandemic has turned the world upside down as the worst plague since the 1918–1920 Spanish flu. The rise of Black Lives Matter following the killing of yet another black man at the hands of the police has triggered riots and more. Finally, in January 6, 2021, we witnessed the assault on Capitol Hill, a direct attack on Democracy triggered by claims that the 2020 election was rigged—an attack supported by the former president who refused to accept the election results. This is either a culmination of the rising polarization or it marks the beginning of a period where polarization will become increasingly worse and trigger even deadlier violence.
Geopolitically, we also have the growth of a polarized, confrontational world as seen by the decoupling of U.S.-China/Russia. There is also growing nationalism not seen since the 1930s that is pushing globalization to the sidelines. Supply chain disruptions are resulting in declining consumption and extreme weather events are upending markets. There are attacks against science, the giant social media companies, and other high-tech companies, even as technology brings us new innovations and increasingly wider bandwidth. Finally, there are constant attacks on the media claiming “fake news” that are bringing the deep polarization to the forefront, while the two sides are growing further apart and the mistrust deepens.
Technical indicators are also flashing extreme caution. Divergences are being seen in the advance-decline line, the VIX Volatility Indicator, the number of stocks trading over their 200-day MA, and the classic Dow Theory divergence with the Dow Jones Industrials (DJI) having recently made new all-time highs while the Dow Jones Transportations (DJT) is nowhere near its former high. Many indices are trading up or even over bull channels. Complacency remains high as witnessed by the put/call ratio that remains heavily in favour of calls.
That brings us back to Jim Rogers who is predicting that the “worst bear market” in his lifetime is coming. He sees all this happening in the next two to three years. He is also predicting the eventual demise of the U.S. dollar and a possible changeover to the Chinese yuan or even gold. Being a Cassandra is not easy and there are many who dismiss Rogers as a crank. In a polarized world, predicting the “end of the world” is not a topic many want to acknowledge.
So, what of Roger’s contention that bottoms end with 10- or 15-year lows? We decided to take a look to see how well that fits. Our starting point is July 1932, the stock market bottom of the Great Depression. After all, what could be more significant than the Great Depression. Since bottoms tend have a range, we’ll use a range of 8–12 years for 10 years and 13–17 years for 15 years. However, as with everything there can sometimes be outliers.
|
Start Point - Dow Jones Industrials (DJI) |
10 years (8–12 years) |
15 years (13–17 years) |
|
1932 |
April 1942 (10 yrs.) – Loss 40.0% |
May 1947 (15 yrs.) – Loss 23.2% |
|
1942 |
September 1953 (11 yrs.) – Loss 13.0% |
October 1957 (15 yrs.) – Loss 19.4% |
|
1953 |
June 1962 (9 yrs.) – Loss 27.1% |
October 1966 (13 yrs.) – Loss 35.9% |
|
1962 |
December 1974 (12 yrs.) – Loss 45.1% |
February 1978 (16 yrs.) – Loss 26.9% |
|
1974 |
July 1984 (10 yrs.) – Loss 15.6% |
October 1987 (13 yrs.) – Loss 36.1% |
|
1984 |
October 1990 (6 yrs. *) – Loss 21.2% |
August 1998 (14 yrs.) – Loss 19.3% |
|
1990 |
September 2001 (11 yrs.) – Loss 29.7% |
March 2009 (19 yrs. *) – Loss 53.8% |
|
2001 |
October 2011 (10 yrs.) – Loss 16.8% |
February 2016 (15 yrs.) – Loss 14.5% |
|
2011 |
March 2020 (9 yrs.) – Loss 37.1% |
2024–2028? |
Source: www.stocktradersalmanac.com
As we can see, there were two outliers (*)—a short one in October 1990 and a long one in March 2009. Between 1990 and 1998 there was a corrective dip in 1994 but it was pretty shallow, about 9%; otherwise, it would have qualified given it was 10 years from 1984. Between 2001 and 2009, outside of the tech crash of 2002, there was a dip in 2005 of roughly 7%; otherwise, given it was 15 years from 1990 it too could have qualified. Out of the 17 observations noted above, six should be classified as corrections, given they were less than 20%. Five would be classified as severe bears, given they were in excess of 30%. However, two of them—1987 and 2020—were short-lived. There were some important collapses missed: 1938 – Loss 49.1%; 1970 – Loss 35.9%; and 2002 – Loss 31.5%.
While the collapses of 1938, 1970 and 2002 were missed in the above analysis they were not without significance. 1938 came 17 years after the important 1921 low that signaled the start of the “Roaring Twenties” market. It was also 12 years after an important low in 1926 that signaled the start of the blow-off to the 1929 high. 1970 came in the middle of the two lows noted above 1966 and 1974. It was also 10-years after an important low in 1960 and 13-years after an important 1957 low. 2002 of course was very close to the 2001 low and 12-years after the 1990 low and 15-years after the 1987 crash low.
Thus far, there have been eight bear markets since 1932 where the loss was 30% or greater. The steepest was the 2008 financial crisis that saw the DJI fall 53.8%, the steepest decline since the 1929–1932 Great Depression collapse. Other indices fell even more during 2007–2009. That works out to one severe bear market roughly every 11 years, fitting rather nicely with Jim Rogers’ statement that major bottoms are seen with 10- or 15-year lows. The average since 1900, according to Stock Traders Almanac, is for a 30.8% decline. Bear markets have tended to last on average 389 days or just over one year. Since 1932, the longest bear market lasted 959 days (1939-1942) while the shortest was 40 days (February/March 2020).
If we drop the two short severe bear markets, 1987 and 2020, then we note that there were six severe bear markets since 1932, or one roughly every 15 years. They were 1942, 1966, 1970, 1974, 2002, and 2009. Three were, however, bunched together from 1966 to 1974. 2002 and 2009 were only seven years apart.
That brings us to what may be the scariest long-term cycle that falls within the next decade or so. That is the 90-year cycle, a long-term cycle of major depressions. This would fit nicely with Rogers’ contention that we will see the “worst bear market” in his lifetime happening. Observable major stock market lows coinciding with a major depression were seen in 1555, 1672, 1761 (and 1783), 1843, and 1932. While the next major stock market low from 1555 (based on the what was then the Genoa Index) did not happen until 1672, 117 years later it is noted that the major financial crisis of the 16th century lasted until the end of the century even as the index did not take out that 1555 low. Markets started rising in the early 17th century. Ninety years from 1932 is 2022. The range for this 90-year cycle low could last up to roughly 2037 but is more likely to happen before 2032 according to Ray Merriman. The conditions are all there and the timing is there; what is needed is the trigger.
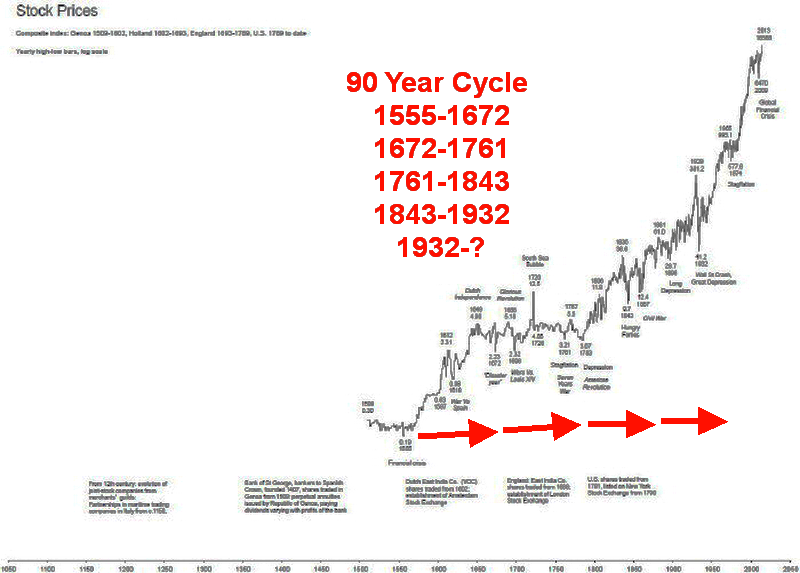
Source: www.goldchartsrus.com
Chart of the Week
Source: www.stockcharts.com
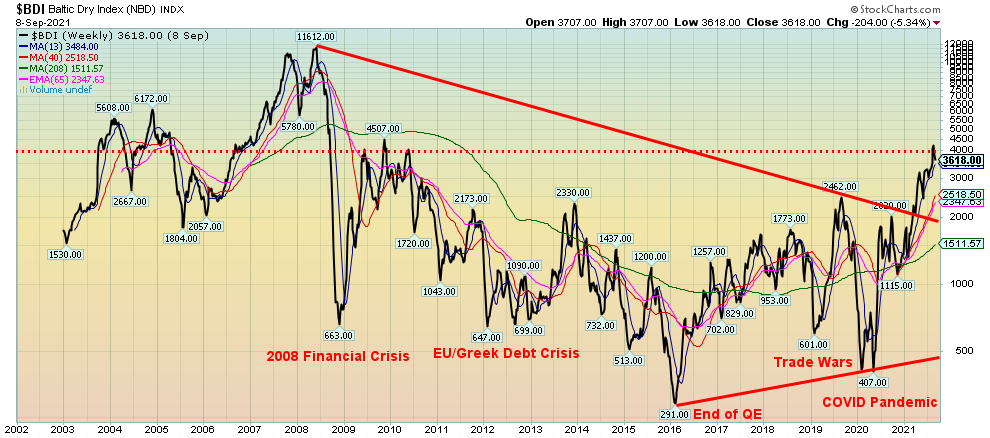
Supply chain disruptions are one of the major reasons that we are experiencing inflationary pressures. The poster child for the supply chain disruptions was the container ship Ever Given stuck in the Suez Canal in March 2021. It took a week to get it moving again and even longer to dislodge all the container ships that were stuck behind/in front of it. We couldn’t help but notice that the Baltic Dry Index (BDI) started rising in November 2020 and, by August 2021, had gone up by more than 200%. The Baltic Dry Index is a proxy index for dry bulk shipping stocks and is considered a shipping bellwether.
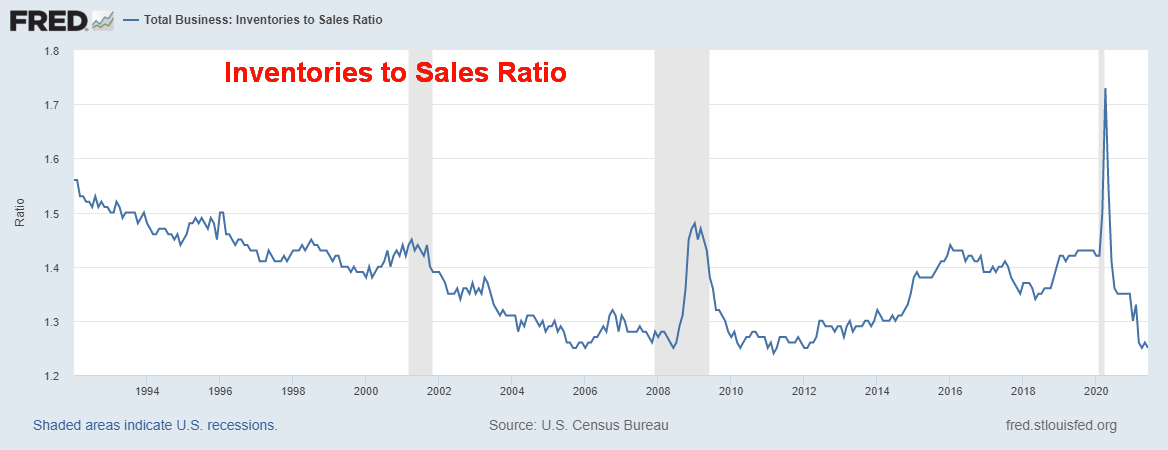
The BDI is not the only measurement. We note that cardboard and corrugated box manufacturing prices soared in the past year. Inventories collapsed as supply chains dried up (see chart below). Freight prices rose sharply, particularly in shipping to the U.S. from China. They tripled in 2021 from 2020. Trucking rates have doubled in the U.S. Capacity in warehouses shrunk as a result of rising demand for e-commerce. The same happened for industrial space rent as it rose sharply. Container ports have experienced severe congestion as the COVID pandemic forced ships to wait.
Source: www.stlouisfed.org
All this was due to a surge in demand following the first wave of the pandemic. It has impacted everything from semi-conductors to food. Food prices have also soared because of drought in many major food-growing regions.
Is it any wonder then that we have seen a rise in a number of TSX Transportation stocks in 2021? While this is just a small sample, we note Canadian National Railways (CNR) +10% in 2021, Algoma Central (ALC) +32%, Mullen Group (MTL) +27%, TFI International (TFII) +117%, and Westshore Terminals (WTE) +72%.
MARKETS AND TRENDS
|
|
|
|
% Gains (Losses) Trends
|
|||||
|
|
Close Dec 31/20 |
Close Sep 10/21 |
Week |
YTD |
Daily (Short Term) |
Weekly (Intermediate) |
Monthly (Long Term) |
|
|
Stock Market Indices |
|
|
|
|
|
|
|
|
|
S&P 500 |
3,756.07 |
4,458.58 |
(1.7)% |
18.7% |
up |
up |
up |
|
|
Dow Jones Industrials |
30,606.48 |
34,607.72 |
(2.9)% |
13.1% |
down |
up |
up |
|
|
Dow Jones Transports |
12,506.93 |
14,366.89 |
(2.6)% |
14.9% |
down |
neutral |
up |
|
|
NASDAQ |
12,888.28 |
15,115.49 (new highs) |
(1.6)% |
17.3% |
up |
up |
up |
|
|
S&P/TSX Composite |
17,433.36 |
20,633.06 (new highs) |
(0.9)% |
18.4% |
up |
up |
up |
|
|
S&P/TSX Venture (CDNX) |
875.36 |
903.35 |
(2.2)% |
3.2% |
neutral |
down (weak) |
up |
|
|
S&P 600 |
1,118.93 |
1,326.93 |
(3.1)% |
18.6% |
neutral |
up (weak) |
up |
|
|
MSCI World Index |
2,140.71 |
2,384.71 |
(0.5)% |
11.4% |
up |
up |
up |
|
|
NYSE Bitcoin Index |
28,775.36 |
45,223.90 |
(9.0)% |
57.2% |
up (weak) |
up (weak) |
up |
|
|
|
|
|
|
|
|
|
|
|
|
Gold Mining Stock Indices |
|
|
|
|
|
|
|
|
|
Gold Bugs Index (HUI) |
299.64 |
243.23 |
(5.8)% |
(18.8)% |
down |
down |
neutral |
|
|
TSX Gold Index (TGD) |
315.29 |
281.46 |
(4.3)% |
(10.7)% |
down |
down |
up (weak) |
|
|
|
|
|
|
|
|
|
|
|
|
Fixed Income Yields/Spreads |
|
|
|
|
|
|
|
|
|
U.S. 10-Year Treasury Bond yield |
0.91 |
1.34% |
1.5% |
47.3% |
|
|
|
|
|
Cdn. 10-Year Bond CGB yield |
0.68 |
1.23% |
3.4% |
80.9% |
|
|
|
|
|
Recession Watch Spreads |
|
|
|
|
|
|
|
|
|
U.S. 2-year 10-year Treasury spread |
0.79 |
1.12% |
2.8% |
41.8% |
|
|
|
|
|
Cdn 2-year 10-year CGB spread |
0.48 |
0.81% |
2.5% |
68.8% |
|
|
|
|
|
|
|
|
|
|
|
|
|
|
|
Currencies |
|
|
|
|
|
|
|
|
|
US$ Index |
89.89 |
92.59 |
0.6% |
3.0% |
up (weak) |
up |
down |
|
|
Canadian $ |
0.7830 |
0.7900 |
(1.1)% |
0.8% |
down (weak) |
down (weak) |
up |
|
|
Euro |
122.39 |
118.13 |
(0.5)% |
(3.5)% |
up (weak) |
down |
up |
|
|
Swiss Franc |
113.14 |
108.94 |
(0.5)% |
(3.7)% |
down (weak) |
down |
up |
|
|
British Pound |
136.72 |
138.34 |
(0.2)% |
1.2% |
up (weak) |
neutral |
up |
|
|
Japanese Yen |
96.87 |
91.01 |
(0.2)% |
(6.1)% |
neutral |
down |
down |
|
|
|
|
|
|
|
|
|
|
|
|
Precious Metals |
|
|
|
|
|
|
|
|
|
Gold |
1,895.10 |
1,792.10 |
(2.3)% |
(5.4)% |
neutral |
neutral |
up |
|
|
Silver |
26.41 |
23.90 |
(3.6)% |
(9.5)% |
down (weak) |
down |
up |
|
|
Platinum |
1,079.20 |
956.50 |
(6.4)% |
(11.4)% |
down |
down |
up (weak) |
|
|
|
|
|
|
|
|
|
|
|
|
Base Metals |
|
|
|
|
|
|
|
|
|
Palladium |
2,453.80 |
2,126.30 |
(12.0)% |
(13.4)% |
down |
down |
up (weak) |
|
|
Copper |
3.52 |
4.45 |
2.7% |
26.4% |
up |
up |
up |
|
|
|
|
|
|
|
|
|
|
|
|
Energy |
|
|
|
|
|
|
|
|
|
WTI Oil |
48.52 |
69.72 |
0.6% |
43.7% |
neutral |
up |
up |
|
|
Natural Gas |
2.54 |
4.94 (new highs) |
4.9% |
94.5% |
up |
up |
up |
|
Source: www.stockcharts.com, David Chapman
Note: For an explanation of the trends, see the glossary at the end of this article.
New highs/lows refer to new 52-week highs/lows and in some cases all-time highs.
Source: www.stockcharts.com
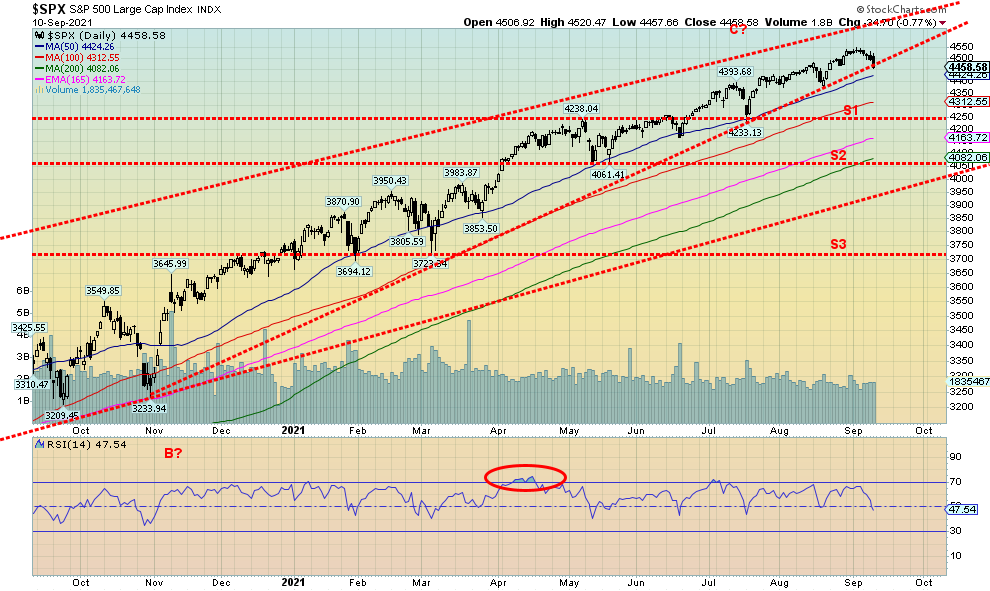
Is a corrective move about to get underway? This past week only the NASDAQ and its large cap companion the NASDAQ 100 made new all-time highs. The NASDAQ, as we note below, put in an outside key reversal week. The S&P 500 fell 1.7% on the week and appears poised to break an uptrend line. A break under 4,425 would confirm the breakdown. No indices were spared this past week. The Dow Jones Industrials (DJI) fell 2.9%, the Dow Jones Transportations (DJT) was down 2.6%, the NASDAQ lost 1.6%, and, the small cap S&P 600 dropped 3.1%. In Canada, the TSX Composite fell 0.9% after making new all-time highs while the small cap TSX Venture Exchange (CDNX) dropped 2.2%. In the EU, the London FTSE fell 1.9%, the Paris CAC 40 dropped 0.4%, and the German DAX fell 1.1%. Maybe the place to be is in Asia as China’s Shanghai Exchange (SSEC) rose 3.4% and the Tokyo Nikkei Dow (TKN) jumped 4.3%. The MSCI World Index, however, lost 0.5%. Bitcoin had a big drop as the rollout in El Salvador using Bitcoin as currency did not go well and the crypto fell 9%.
We have been warning for some time of the potential for at least a correction. We haven’t changed that view and it appears that it may finally be underway. But could it get worse and turn into a rout or a crash? We can’t dismiss that either, but we believe that will await 2022. Call this potentially the first shot across the bow. The question is, how steep? The first areas of good support once we break under 4,400 are 4,300 and 4,250. The 200-day MA is down at 4,082 and a decline to test that would not be unusual or out of place. That is a reasonable 10% or so correction. At this point, that is our best calculation as to how far we could fall. The real danger only starts to come in under 4,000 and under 3,700 a crash could be underway. We don’t believe we’ll get that low but we should be aware of those levels. A correction now could last into October (or November) before we find a bottom and the seasonals begin to kick in. But, given all the bearish divergences we have been noting and a somewhat negative background, especially given the battle over the debt limit and now the rise of the Delta variant and the ongoing political polarization, an overdue correction could now be underway. The dailies break under 4,370.
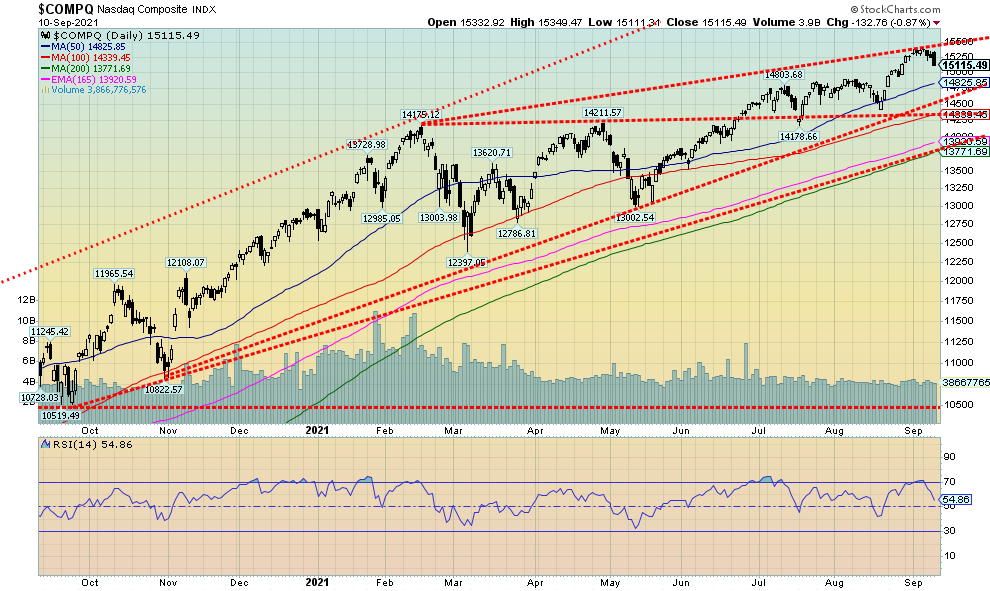
Source: www.stockcharts.com
It was a lonely march to new all-time highs for the NASDAQ. Of the major indices it was the only one to make a new all-time high. It was joined by its large cap index the NASDAQ 100. This may be the ultimate divergence. One of the prime reasons the NASDAQ made new all-time highs was Apple that hit an all-time high—and then got caught up in a lawsuit that saw a judge rule against Apple’s tight control on its App Store. The ruling said Apple can’t force developers to exclusively use its App Store. The result was that Apple hit all-time highs, then reversed and closed sharply lower on the week, losing 3.5%. The week for Apple almost turned into an outside week key reversal. It fell just short. Still, the move left a very bearish, huge black engulfing candle on the charts and most likely is now signaling an important top for Apple. And that spells trouble for the NASDAQ. Apple is the largest company by market cap in the world. It wasn’t an overly great week for the FAANGs. Facebook held in, up 0.7%, Amazon lost 0.3%, Netflix also made a new all-time high but managed to hold on to a 1.4% gain, Google fell almost 2.0%, Microsoft was down 1.8%, Tesla eked out a gain of 0.3%, Twitter fell a sharp 4.8%, Baidu was up 0.7%, Alibaba lost 1.3%, and Nvidia dropped 1.6%.
While Apple failed to make an outside reversal week, the NASDAQ did put in an outside reversal week. The previous week’s low was 15,165 and this past week the low was 15,111 as we closed at 15,115—an outside key reversal for the NASDAQ. Potentially, that signals an important top. Naturally, we need to see follow-through to the downside. The major break point comes at 14,223 which is the last weekly low. A break of that level would also break the previous month’s low. The last major monthly low was seen in May near 13,000. A break under that level would confirm a bear market was possible as the NASDAQ would be down about 16% at that point. A bear market starts under 12,325. Given the key reversal this past week, only a move to new highs above 15,403 would break the pattern. The expectation is that the market moves lower again this coming week.
Source: www.stockcharts.com
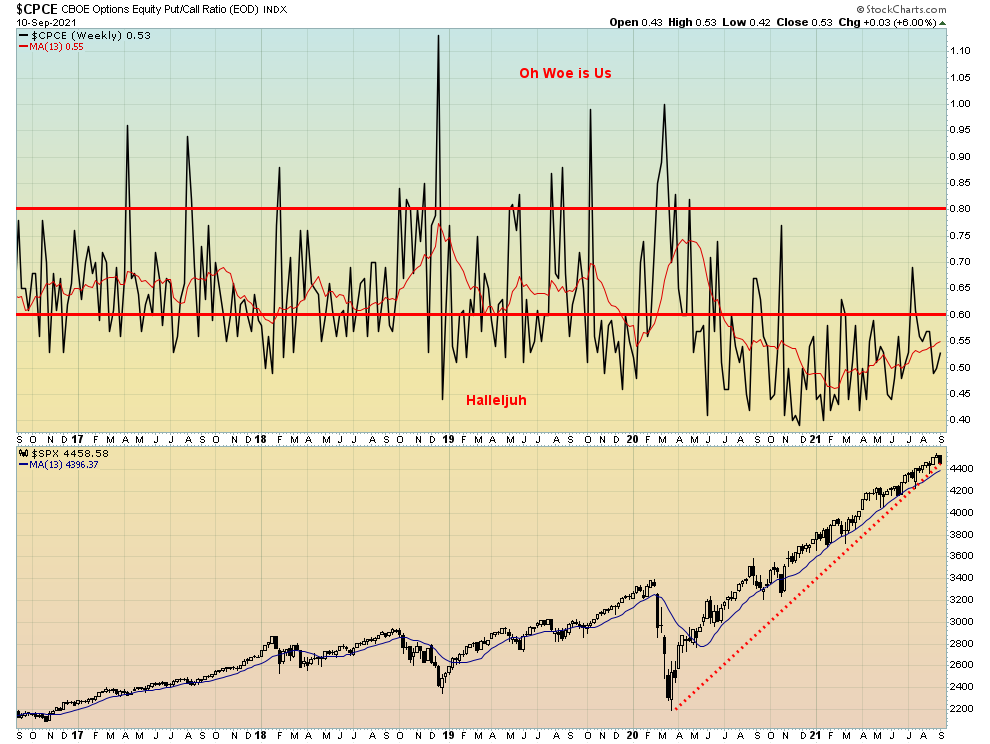
We suppose it should come as no surprise that the put/call ratio fell again this past week, hitting a low of 0.42 before rebounding and closing at 0.53 up 0.03 on the week. The low at 0.42 was the lowest since June. Note that the put/call ratio has been making a series of rising lows and, while not as clear, rising highs as well. So, the market is becoming more cautious but it is certainly not bearish. However, a high number of call options vs. puts at tops is not unusual. At bottoms it is the opposite as the puts overwhelm the calls. If the market cracks, the put/call ratio could quickly regain back over 0.60. However, it does not become bearish until we are over 0.80.
While we are not showing them, the NYSE AD line turned down this week with bearish divergences. The Bullish Percent Index is also turning down with bearish divergences and the VIX Volatility Indicator jumped sharply also with bearish divergences vs. the S&P 500. We have been warning for weeks that these indicators were diverging with the index as the index moved higher but it was not being confirmed by the indicators. The confirmations may now be coming.
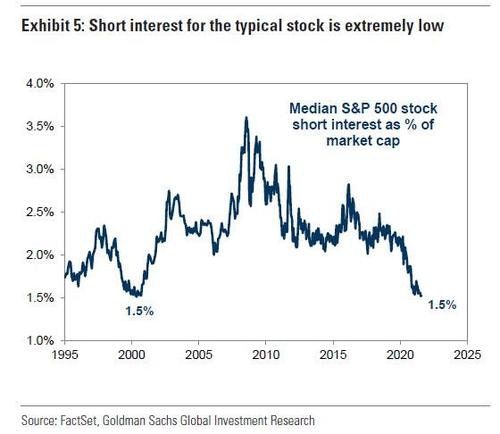
Source: www.globalinvestorletter.com, www.factset.com, www.goldmansachs.com
Jonathan Baird of the Global Investment Letter shared this chart recently and we thought it interesting enough to include it in the Scoop. What the chart tells us is that short interest has fallen to all-time lows. It is now at levels last seen just before the dot.com/high-tech crash of 2000–2002. It is a sentiment indicator indicating the market is so complacent that hardly anybody is shorting these days. Notice the last peak was seen at the bottom of the financial crash of 2008 when everybody turned super-bearish. With the current level so low, if the market starts to crack there won’t be much in the way of short covering which in turn could hold the market up. But if one places this against the backdrop of declining consumer sentiment, the Delta variant, a deteriorating geopolitical environment, a deteriorating domestic environment with extreme polarization, and climate disasters, there is the potential for the unexpected in the markets that would trigger a sharp sell-off.
Canada Job Numbers
Source: www.tradingeconomics.com, www.statcan.gc.ca
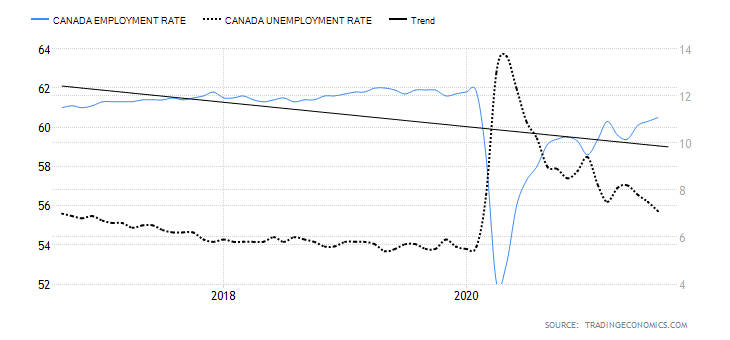
Canada’s employment picture continues to improve. The August jobs report saw Canada 90,200 jobs in August, above the consensus of 68,200 in a Bloomberg survey but slightly below the consensus of 100,000 in other surveys. It was the third consecutive monthly gain. Either way, it is still a good report and now leaves Canada only 156,000 jobs away from the February 2020 level. Compare that with the 5.3 million the U.S. is still short. Canada lost 3,004.5 thousand jobs in March/April 2020. They have now recouped almost 95% of those jobs. The U.S. on the other hand lost 22,362 thousand jobs but has only regained 17,062 thousand or 76%. By that measurement Canada’s performance has been exemplary.
Canada’s unemployment rate fell to 7.1% in August from 7.5% in July. The R8 rate, which is the broadest measurement of unemployment by Statistics Canada, fell to 10.2% from 11.0%. The R8 rate includes discouraged searchers and involuntary part-timers. The labour force participation rate slipped to 65.1% in August from 65.2%. That helps to lower the overall unemployment rate. Adjusted to U.S. standards, Canada’s unemployment rate in August was 5.8% vs. 5.2% in the U.S. Full-time jobs created were 68,500 while part-time jobs were up 21,700. The unemployment rate peaked at 13.7% and in February 2020 the rate was 5.7%. Canada’s higher unemployment rate is a function of the higher labour force participation rate than the U.S. – 65.1% vs. 61.7%. Possibly this reflects a more robust employment market in Canada.
Food and accommodation services led the way, up 134,000. One area of slippage was summer jobs for students, which were down some 2% from 2019 levels. The good news is this was 10% higher than the summer of 2020. While food and accommodation services were up, a host of areas saw job losses including in finance, insurance, real estate, rental and leasing (down 17,000), business building and support (down 17,000) plus religious services, civic and professional organizations, repair and maintenance services (down 30,000). The number of people unemployed for 27 weeks or longer fell 29,000 but remains high at 394,000, some 215,000 higher than it was in February 2020.
If there was good news in this report, it is that it appears to counter the negative growth seen in the July GDP. The economy, rather than contracting, still appears to be in a growth mode. And that despite an uptick in the pandemic numbers, although overall Canada is nowhere near where it was in earlier waves. Grant you, the pandemic does not start to accelerate until the colder weather hits so we may not get off so lightly after all. Still, the overall performance compared to the U.S. is quite good.
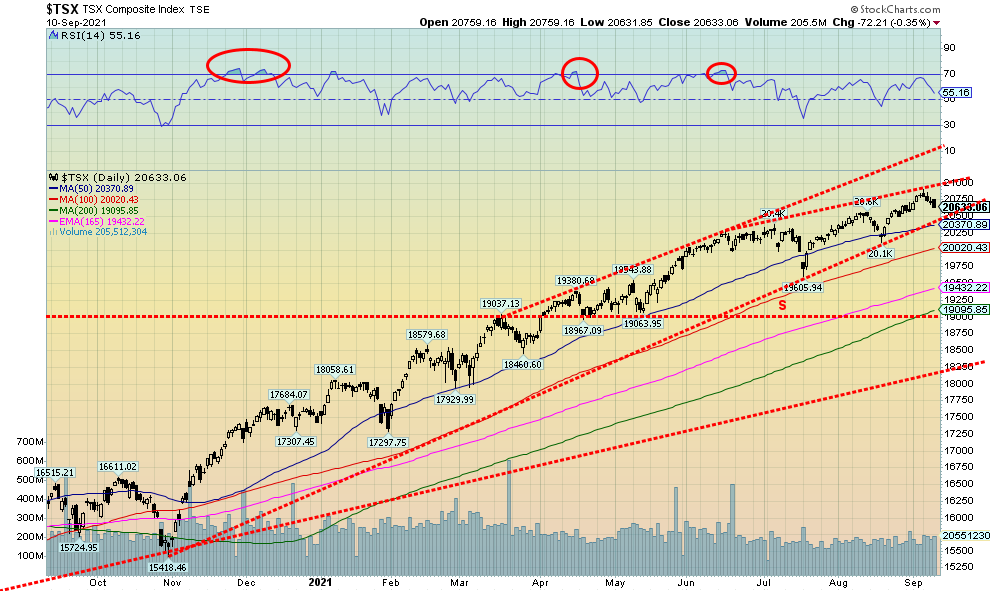
Source: www.stockcharts.com
Once again, the TSX Composite made new all-time highs this past week. But it didn’t end as well as the index fell 0.9% on the week making it a reversal week. Five of the 14 sub-indices also made fresh all-time highs, four of them reversed and closed lower, while the fifth closed largely unchanged, giving up its gains. At the end of the week only the Information Technology (TKK) index managed to close unchanged. Everyone else was down on the week. Health Care (THC) led the way, down 5.2%. Golds (TGD) lost 4.3% while Materials (TMT) was down 2.6%. Of the ones making new all-time highs, Income Trusts (TCM) was down 0.5%, while Industrials (TIN) -1.9%, Real Estate (TRE) -1.0%, and Utilities (TUT) -0.1% were the losers. The small cap TSX Venture Exchange (CDNX) lost 2.2% on the week. All in all, a lousy week. The reversal now leaves the TSX vulnerable to further declines as the rebounds have become narrower and narrower (i.e., forming a wedge pattern). A break under 20,590 could be concerning, but a more dangerous breakdown occurs under 20,370. Under 20,100 the TSX would be breaking the daily lows and set up the index for further declines. Of course, new highs would change that. However, the rising wedge pattern suggests to us that the TSX, like the other indices, is vulnerable to a downside break. The current wedge breaks at 20,520 and has a minimum objective of 19,600. Under 19,600, the decline could accelerate.
U.S. 10-year Treasury Bond/Canadian 10-year Government Bond (CGB)
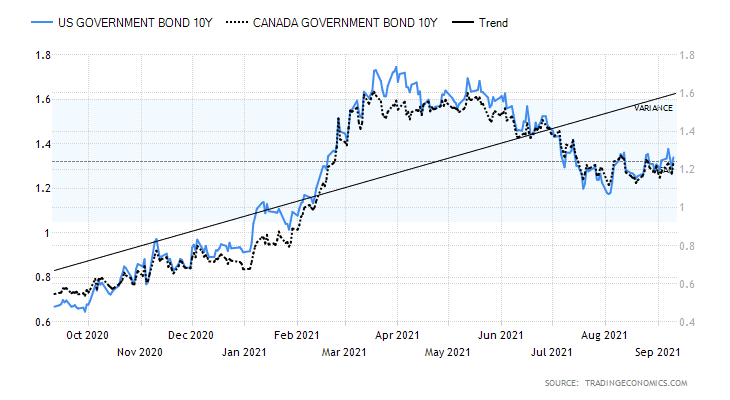
Source: www.tradingeconomics.com, www.home.treasury.gov, www.bankofcanada.ca
Bond yields moved marginally higher this past week as a result of taper talk and the strong PPI number on Friday. The 10-year U.S. treasury note rose to 1.34% from 1.32% while the Canadian 10-year Government of Canada bond (CGB) rose to 1.23% from 1.19%. However, we can’t help but notice some anomalies as the U.S. 30-year treasury bond remained flat this past week at 1.94%. As a result, the 10-year–30-year spread fell to 0.59% from 0.61%. A 30-year bond auction this past week saw the lowest investment dealers allotted an historic low of 13.1% of a recent 30-year bond auction. It was primarily due to strong investor demand and it helped to push yields lower and flatten the curve. The auction came in at 1.91% vs. the previous one at 2.04%. Are investors worried about recent economic numbers pointing to a weaker economy? Probably yes.
The big number of the week was the PPI which we discuss next. Otherwise, economic numbers were sparse this past week. August auto sales came in weak at 13.06 million, down from 14.8 million the previous month. Consumer credit rose $17 billion when the market was expecting a rise of $25 billion and the previous month saw a rise of $37.86 billion. Initial jobless claims were lower at 310,000 vs. 345,000 and an expectation of 335,000.
This coming week the key numbers to watch are CPI on Tuesday expecting a rise of 5.4% year over year for August while the core inflation rate (ex food and energy) is expected at 4.3%. Industrial production and capacity utilization are out on Wednesday, looking for IP to be up 0.5% for August and CU to 76.4% unchanged from July. The Philly Fed is out on Thursday, looking for a reading of 19 vs. 19.4 in August. The Michigan Consumer Sentiment Index is out on Friday, looking for 72 vs 70.3 in August. Canada reports its CPI on Wednesday looking for year over year rise of 3.9% vs. 3.7% the previous month. The big one for Canada is the election on Monday, September 20. At this point it is looking like a deadlock and another minority government.
After falling to 1.19% in August from 1.74% in March the 10-year appears to us to be going through a corrective. It has been a slow upward move, forming what appears to us to be a bear flag or pennant. A break of 1.24% could set up a break of the recent low of 1.19% and project down to around 1.05%. A move above 1.45% could negate that and target higher rates. An unknown at this time is the ongoing battle over the debt limit. The crunch, we understand, comes in October. While they usually come to their senses and prevent a default, one just never knows. Failure to raise the debt limit or at least postpone it once again could trigger a sudden sharp rise in yields along with a U.S. debt downgrade.
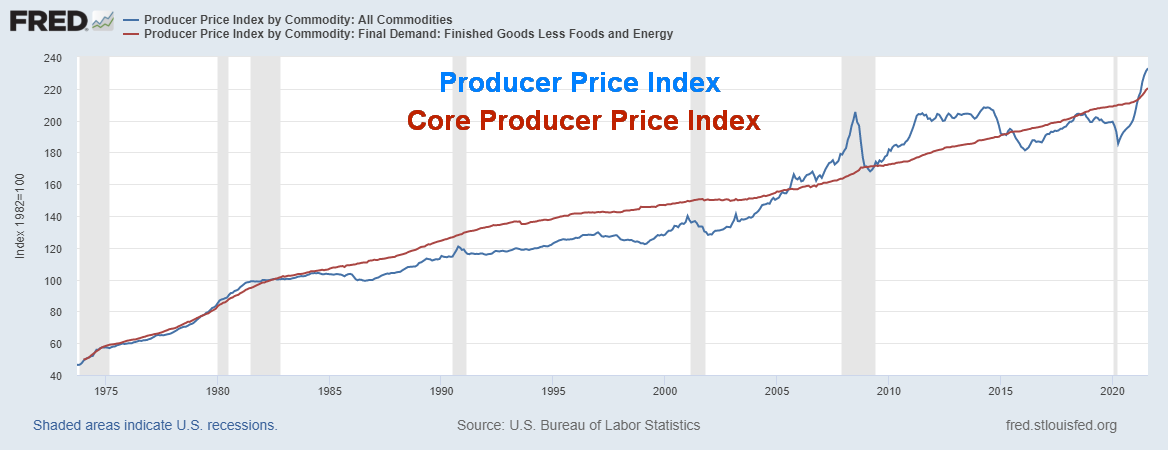
Source: www.stlouisfed.org
Everybody has been going crazy about the coming inflation. Yes, producer prices (PPI) rose in August up 0.7%. However, it was the slowest growth in the past three months. So, is inflation abating? Well, we can’t say that just yet. The market had expected a rise of 0.6% in August. Year over year, the PPI was up 8.3% in August. That was the highest rise since November 2010. But remember it was coming out of the downdraft seen during the pandemic in 2020. So, it was not really a surprise. Overall, the rise is not much more than what was seen out of the 2008 financial crisis. And it is unknown at this time how the Delta variant is going to impact inflation. With signs that consumer sentiment is waning, inflation could slow in the coming months. The Fed keeps noting that the inflation is transitory. Much of the inflation is being caused by supply shortages and blockages. The core PPI (ex: food and energy) rose 0.6% in August and is up 6.7% year over year. Given that the overall PPI wasn’t much higher, was food and energy that much of a contributor? Nonetheless, the year over year for the core PPI is the highest on record. This coming week we’ll get the CPI.
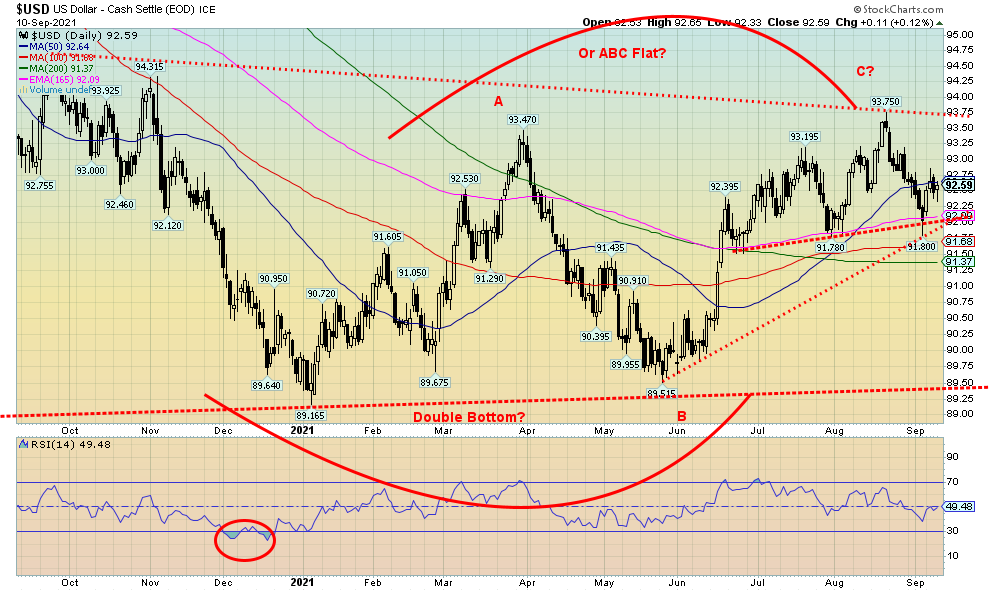
Source: www.stockcharts.com
The rally in the US$ Index that started from the recent low at 91.80 appears to us as a countertrend. Thus far, the 50-day MA currently near 92.64 has stopped the rebound. The high was at 92.86. It is possible that the US$ Index is forming a potential head and shoulders top pattern. What’s key is that the right shoulder that appears to be currently forming remains below the high of the left shoulder at 93.20. The head peaked at 93.75. That would set up 92 as the potential neckline, although to be safe we’ll use the recent low at 91.80 as our breakdown point. If that breaks, the US$ Index could fall to around 89.80/89.85. That would still leave the US$ Index above its potential double bottom lows of 89.17 and 89.51 seen in January and May. The US$ Index was driven higher this past week because of taper talk again. But if the Fed remains dovish and the economic numbers continue to come in on the weak side, then the only direction for the US$ Index is down. A falling US$ Index would be helpful for gold. As to the other currencies, the euro fell 0.5% this past week, the Swiss franc was also off 0.5%, and the pound sterling fell 0.2% as did the Japanese yen. The Canadian dollar was the weakest, falling 1.1%.
Source: www.stockcharts.com
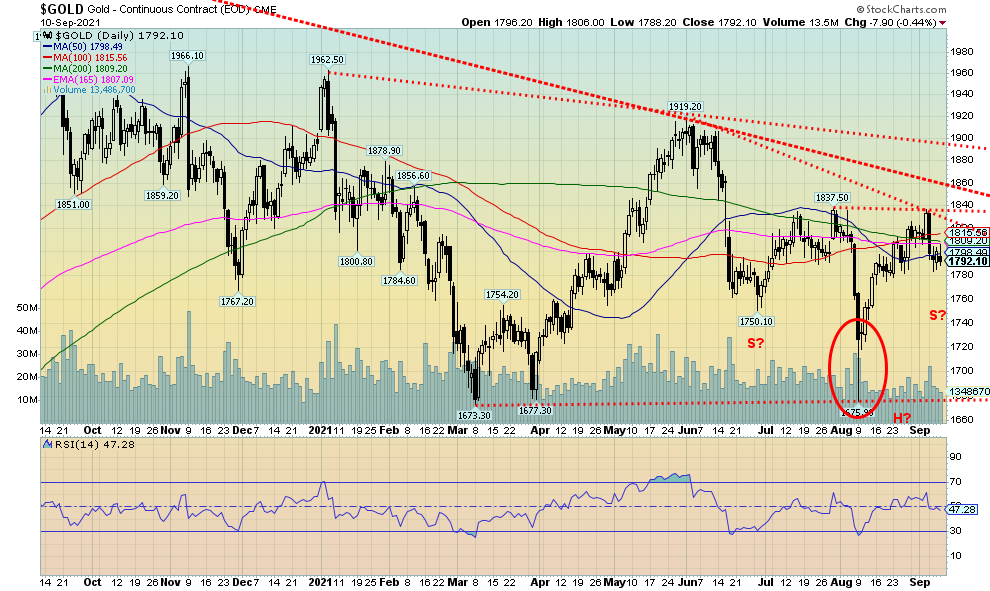
The precious metals put in a down week as taper worries set in once again. A stronger US$ Index didn’t help. As well, the PPI numbers on Friday didn’t help either. It was the first weekly decline for gold in the past five weeks. Gold fell 2.3% this past week while silver was down 3.6%. Platinum and palladium both took it on the chin this past week over concerns over declining auto demand along with supply disruptions. Platinum fell 6.4% while palladium dropped a sharp 12%. Oddly enough, copper prices remained firm, up 2.7% on the week. Copper is the only one of the metals we quote each week that is up on the year, a gain of 26.4%. We notice that copper stocks have done well. The good news is gold and copper usually follow each other, although at the moment it certainly doesn’t feel like it.
The CFTC did not release the Commitment of Traders (COT) report on Friday because of the Labour Day holiday. The report will be released on Monday, September 13. We’re hoping it shows that the commercials are covering once again on this drop. Gold could be tracing out what may be a head and shoulders bottom pattern. The left shoulder formed in June/July while the head is the plunge to $1,675 in August. What may be forming now is the right shoulder. If that’s correct, then we would want to see gold stay above the June low of $1,750. If gold broke below that level and especially under $1,738 then we’d be concerned that we could then be testing the August low of $1,675.98. The neckline of the potential H&S pattern would be at $1,837, but we’d use $1,840 as our breakout point. A firm breakout above that level on volume could then set a potential target of up to $2,000 for gold. Given that the seasonals remain positive there remains a chance that could happen. However, we emphasize that on this pullback we preferably need to remain above $1,750. Above $1,840 there would be resistance at $1,860 and again at about$1,900. Above $1,900 things look clearer for a potential run to $2,000. Below $1,737, all bets are off.
Source: www.stockcharts.com
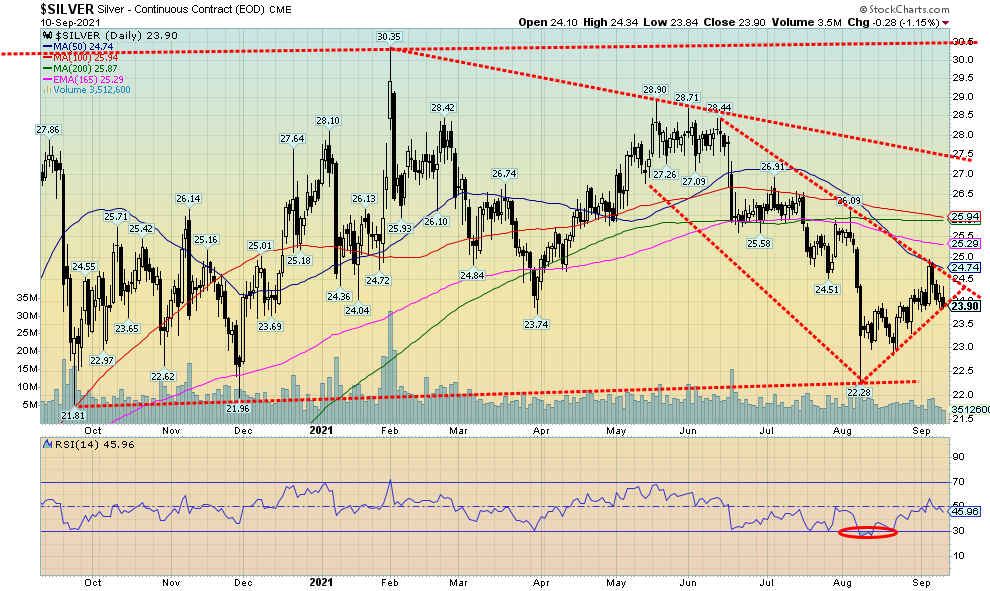
Silver prices suffered alongside gold this past week, falling 3.6% and closing once again under $24. Thus far, $24.75 has been resistance so we need to break above that level to tell us we could move above $25. As it stands, we are at trendline support and a break under $23.90 and especially under $23.85 could send us back down to $23.50. The August low at $22.28 to a recent high of $24.89 was a solid rise of $2.61. A move back under $23 and especially under $22.90 would be negative, setting up the potential for a test of the August low or even new lows. A fairly normal correction back would be to $23.50 to $23.60. Silver continues to leave us open for interpretation as to the next move. Silver is not confirming with gold. Silver made a lower low in August while gold did not. Silver’s rise has been lethargic. The wave up from the August low at $22.28 so far is appearing as an ABC which is corrective. Silver remains down 21% from its February 2021 high of $30.35 while gold is down only 14% from its August 2020 high. Silver tends to lead in both bull and bear markets and right now the only lead silver has had is to the downside. While we remain optimistic that the seasonals will pull us higher, we can’t dismiss the possibility that we could move lower instead. A break under $23.85 would set up our next move to the downside with potential down to $23.50 and even $23.30.
Source: www.stockcharts.com
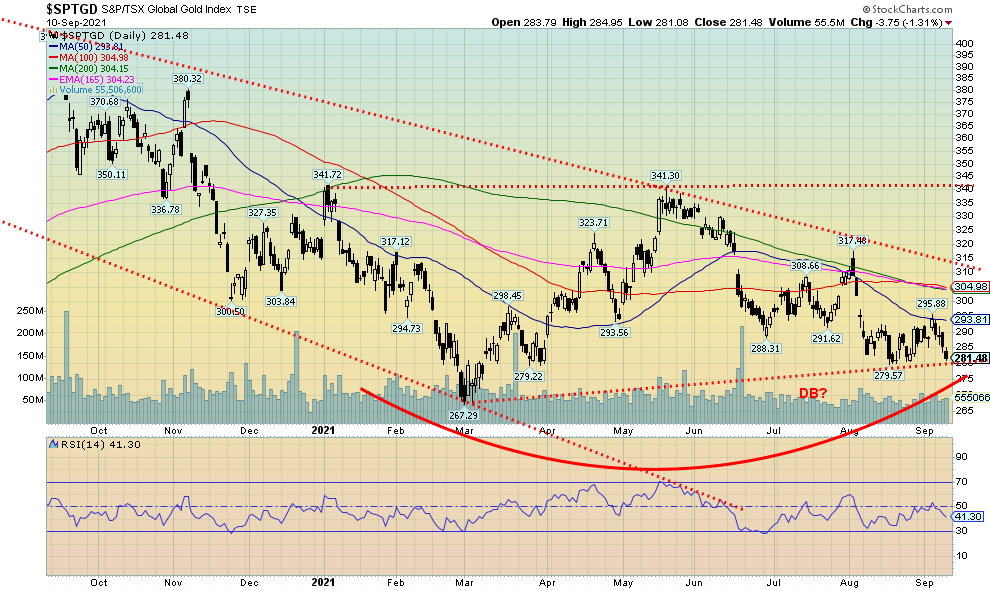
With the precious metals down on the week, the gold stocks followed as the Gold Bugs Index (HUI) dropped 5.8% and the TSX Gold Index (TGD) was off 4.3%. The TGD appears poised to either break to a new low or make a double bottom. A breakdown under 280 could lead to a further sell-off and test the March 2021 low of 267. The HUI is doing marginally better as it closed at 243 this past week, still five points above its August low of 238. The gold stocks remain in a bear market. The HUI is down 18.8% in 2021 while the TGD is off 10.7%. From the top in August 2020 the HUI is down 35% while the TGD is off about 33%. The TGD needs to regain above 296 to suggest that a low might be in. After that there remains resistance up to 305 and 312. Above 315 the TGD could be breaking out. But if the TGD is truly forming a double bottom, we’d need to see a break above 340. Potential targets after that could be as high as 415, a level that would coincide with the August 2020 high. In is the glass half-full or half-empty? The TGD is 62% above the low seen in March 2020. The low of March 2021 near 267 saw the TGD correct almost 61.8% of the entire rise from March 2020 to August 2020. Only a breakdown under 230 would suggest that a more serious test of the March 2020 low was underway. Gold stocks are not a particularly large market with a total market of under $500 billion. So, it doesn’t take much to move them either up or down. The result is that the gold stocks can move in huge waves both up and down.
Source: www.stockcharts.com
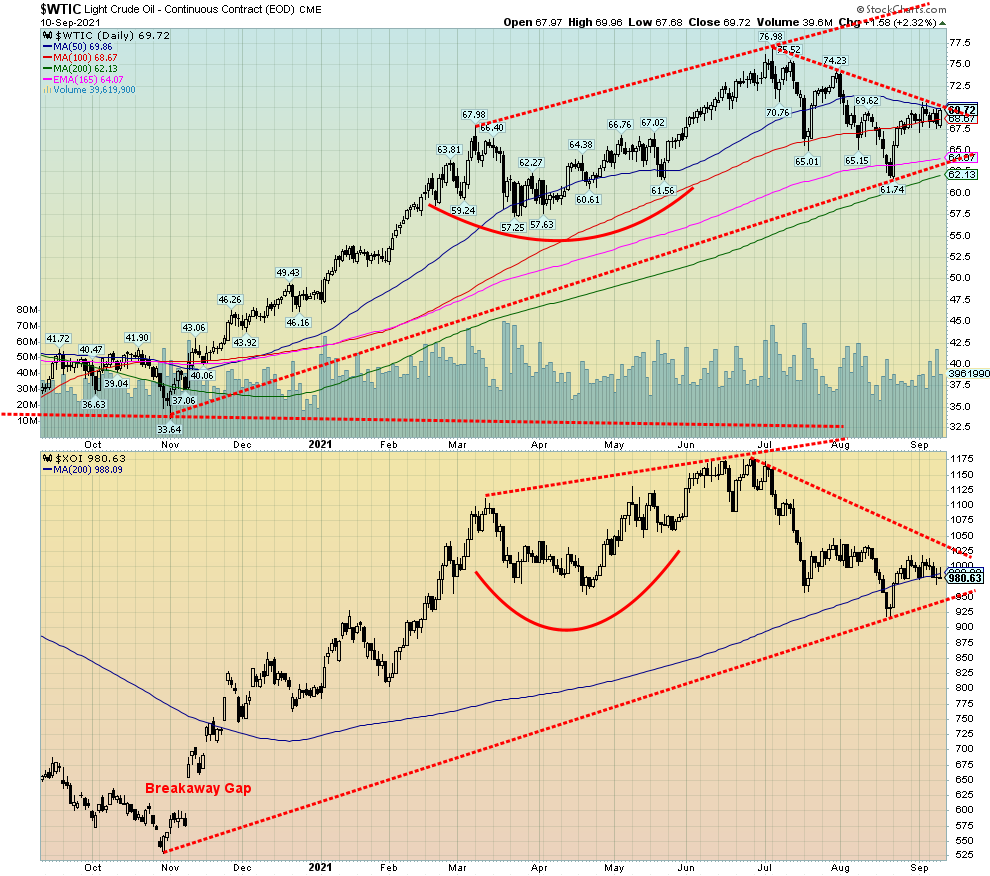
Once again there was a bullish tint to the energy markets this past week. Supply disruptions continue to hamper the market, particularly for natural gas (NG). NG rose another 4.9% this past week, making yet another 52-week high. With the threat of more hurricanes in the Gulf, supply disruptions could continue as platforms remain shut down. Three quarters of crude production is still shut in the Gulf of Mexico. WTI oil prices were also up 0.6% this past week with most of that gain coming on Friday. Apparently, also helping was the fact that U.S. President Biden and China’s General Secretary Xi-Jinping decided to pick up the phone and talk to each other. That was interpreted by some that a thaw could develop between China and the U.S., which in turn could help demand.
However, the price rise for oil and gas did not translate to the energy stocks. The ARCA Oil & Gas Index (XOI) fell 2.2% while the TSX Energy Index (TEN) was down 1.1%. An interpretation of this price divergence could be that the current rally for oil and gas could be short-lived. The energy stocks may also just be following the general market that was weak this past week. Another potential deterrent could be a drop in demand as a result of the rise in the Delta variant. We note that WTI oil remains just below (at?) the downtrend line from the June 2021 high at $76.98. WTI oil needs to break out over $70 to convince us that we could starting a new leg to the upside. As to NG, with an RSI that has been over 70 now since the beginning of September and other indicators also in overbought territory, a pullback would not be a surprise. On Friday, NG made a fresh 52-week high at $5.06, then reversed and closed lower on the day down 1.9%. The weekly RSI has been almost consistently over 70 since July while the monthly RSI just climbed over 70 as well. All time frames are showing as overbought, signaling that a corrective down move could be coming. Any easing of the supply situation could quickly see NG reverse much of its recent rise.
Copyright David Chapman, 2021
|
Charts and commentary by David Chapman Chief Strategist, Enriched Investing Inc. Phone: 416-523-5454 Email: david@davidchapman.com dchapman@enrichedinvesting.com Twitter: @Davcha12 September 13, 2021 |
Disclaimer
|
GLOSSARY Trends Daily – Short-term trend (For swing traders) Weekly – Intermediate-term trend (For long-term trend followers) Monthly – Long-term secular trend (For long-term trend followers) Up – The trend is up. Down – The trend is down Neutral – Indicators are mostly neutral. A trend change might be in the offing. Weak – The trend is still up or down but it is weakening. It is also a sign that the trend might change. Topping – Indicators are suggesting that while the trend remains up there are considerable signs that suggest that the market is topping. Bottoming – Indicators are suggesting that while the trend is down there are considerable signs that suggest that the market is bottoming. |
David Chapman is not a registered advisory service and is not an exempt market dealer (EMD) nor a licensed financial advisor. We do not and cannot give individualised market advice. David Chapman has worked in the financial industry for over 40 years including large financial corporations, banks, and investment dealers. The information in this newsletter is intended only for informational and educational purposes. It should not be considered a solicitation of an offer or sale of any security. Every effort is made to provide accurate and complete information. However, we cannot guarantee that there will be no errors. We make no claims, promises or guarantees about the accuracy, completeness, or adequacy of the contents of this commentary and expressly disclaim liability for errors and omissions in the contents of this commentary. David Chapman will always use his best efforts to ensure the accuracy and timeliness of all information. The reader assumes all risk when trading in securities and David Chapman advises consulting a licensed professional financial advisor before proceeding with any trade or idea presented in this newsletter. David Chapman may own shares in companies mentioned in this newsletter. We share our ideas and opinions for informational and educational purposes only and expect the reader to perform due diligence before considering a position in any security. That includes consulting with your own licensed professional financial advisor.
About the author


Website: https://www.enrichedinvesting.com
Disclaimer: David Chapman is not a registered advisory service and is not an exempt market dealer (EMD) nor a licensed financial advisor. We do not and cannot give individualised market advice. David Chapman has worked in the financial industry for over 40 years including large financial corporations, banks, and investment dealers. The information in this newsletter is intended only for informational and educational purposes. It should not be considered a solicitation of an offer or sale of any security. The reader assumes all risk when trading in securities and David Chapman advises consulting a licensed professional financial advisor before proceeding with any trade or idea presented in this newsletter. David Chapman may own shares in companies mentioned in this newsletter. We share our ideas and opinions for informational and educational purposes only and expect the reader to perform due diligence before considering a position in any security. That includes consulting with your own licensed professional financial advisor.