
Are things about to heat up? The attack on Iran came this weekend but our report goes out before markets open on Sunday night so we can only speculate on the impact on oil, gold and stock markets. We are just over a week away from the most contentious U.S. election ever and a lot of signs point to impending chaos. Markets did not do well this past week. Have we topped?
The U.S. economy has been the best in the G7 but for how much longer? We muse. We note the massive interest payments and also note that despite the Fed cutting rates long rates have actually gone back up.
Bonus charts of the week. We look at oil on an inflation adjusted basis. It tells us a different story. A likely beneficiary of the geo-political driven risk of higher oil prices is Veren Inc., a leading North American oil producer, that recently reported strong funds flow and reduced net debt, pays a dividend, and is held in the Enriched Capital Conservative Growth Strategy.* Our bonus chart is a weekly gold chart and it is very bullish even as gold hits all-time highs.
As noted, markets did not do well this past week. Stock markets were down, gold/silver were up but the gold stocks fell thanks to Newmont Mining. Oil prices jumped on continued nervousness over the events in the Mid-East. Longer term interest rates rose. And we read another hurricane is forming.
Old saying - we live in interesting times. But also concerning times.
But the fall weather is beautiful here.
Have a good week.
DC
* Reference to the Enriched Capital Conservative Growth Strategy and its investments, celebrating a 6-year history of strong growth, is added by Margaret Samuel, President, CEO and Portfolio Manager of Enriched Investing Incorporated, who can be reached at 416-203-3028 or msamuel@enrichedinvesting.com
“The first panacea for a mismanaged nation is inflation, the second is war. Both bring temporary prosperity; both bring permanent ruin. But both are the refuge of political and economic opportunists.”
—Ernest Hemingway, American author and journalist, known for For Whom the Bell Tolls, A Farewell to Arms, The Old Man and the Sea, won the Pulitzer Prize for fiction; 1899–1961
“The economy of the future might be called the ‘spaceman economy,’ in which the earth has become a single spaceship, without unlimited reservoirs of anything.”
—Kenneth Boulding, British-American economist, educator, peace activist, interdisciplinary philosopher, graduate of Oxford University; 1910–1993
“Protectionism is the institutionalization of economic failure.”
—Sir Edward Heath, British politician, Prime Minister United Kingdom 1970–1974, leader of the Conservative party 1965–1975, Member of Parliament 1950–2001; 1916–2005
It’s just over a week to the most contentious U.S. election ever. One candidate has already stated that the results will not be accepted if that candidate loses. Polarization is considered by many to be the highest since the onset of the U.S. Civil War over a century and half ago. Misinformation and outright lies are the staple of at least one of the candidates, but are also heard on many a YouTube podcast. Attacking opponents, often in a vicious personal manner, seems to have evolved into a blood sport, especially on social media.
Yet against this backdrop, the U.S. economy has outperformed all the other G7 economies but lags behind China and India plus a few other smaller economies. Our chart on the next page shows the most recent (Q2) annual GDP growth rate for China, U.S., EU, Japan, and (not shown) U.K. and Canada. As noted by The Economist (www.economist.com) in a recent headline article titled “The Envy of the World,” (The Economist, October 19, 2024) in 1990 the U.S. accounted for about 40% of the GDP for the G7 countries. Now it accounts for 50%.
The question is, can it remain that way? It is a legitimate question, as even The Economist points out. The others in the G7 are not faring well and China has had significant economic problems because of the collapse of its property market, a dwindling population, slowing consumer demand, and geopolitical issues; the EU is teetering on the edge of recession, as is the U.K. and, while slightly better off, Canada too. Japan is already in a recession. All the major developed countries are facing the same problem: a dwindling population, ravages from the effects of climate change (severe storms, etc.), deep polarization, or at least a sliding towards deep polarization, and geopolitical tensions.
Attempts to make up for declining birth rates by increasing immigration are being met by strong resistance, sometimes violent. In the U.S., one candidate threatened to deport millions of non-citizens, even if many of them have been fully integrated into the U.S. economy for years. This inevitably would have a
knockdown effect on the U.S. economy.
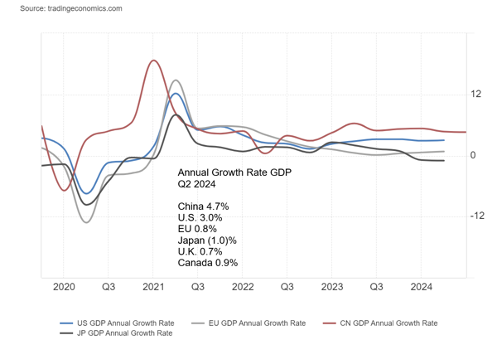
Source: www.tradingeconomics.com, www.stat.gov.cn, www.bea.gov, www.ec.europa.eu, www.cao.go.jp, www.ons.gov.uk, www.statcan.gc.ca
Eight of the 10 largest companies in the world have their headquarters in the U.S. The U.S. is the world’s largest oil producer in the world. They are also the wealthiest country in the world, ranking high on economic freedom, innovation, and global competitiveness. However, the U.S. also has a high level of income inequality, and it doesn’t rank well in education, except at the highest level, with world-renowned universities. The U.S. also ranks poorly in mortality rates, child mortality rates, and maternal mortality for a first-world country. Oddly, its environmental record is middling, it ranks low on global peace, and middling on press freedom and democracy. Press freedom, democracy itself, institutions, and the rule of law are also under attack.
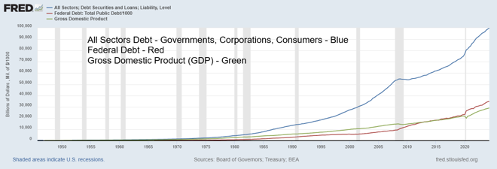
The U.S. has the highest debt (government, corporate, and consumer) in the world, representing, as we have noted, almost a third of global debt. The U.S. federal debt represents some 11% of the world’s total debt. The U.S. has the highest trade deficit in the world. No one else is even close. But as the world’s reserve currency, the U.S. can effectively transfer its debt and trade deficit to the rest of the world. While the U.S. is the world’s
largest oil producer, it lacks many other important commodities it needs. Hence, the huge competition
globally for these commodities that often brings the competing interests into clashes with each other. It also heightens the need to protect these sources by force if necessary.
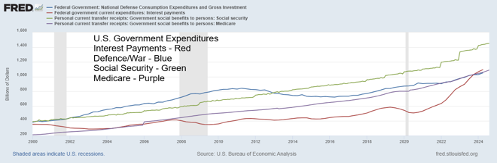
Source: www.stlouisfed.org
Interest payments on the federal debt are soaring. The interest payments are now rising as if they were in a bubble. Interest payments on the debt now exceed $1.1 trillion. That’s equivalent to what the U.S. spends on defence/war. According to U.S. Debt Clock (www.usdebtclock.org), Medicare payments are roughly 1.8 trillion and Social Security is $1.5 trillion annually. Together they make almost 76% of the U.S. budget and more than double the U.S. budget deficit. The U.S. budget deficit is roughly 7.5% of GDP, one of the highest in the world and the highest amongst G7 countries. For the record, according to Country Economy (www.countryeconomy.com), the U.S. is followed by Italy at 7.2%, the United Kingdom at 6%, France at 5.5%, Japan 4.4%, Germany 2.6%, and Canada 0.6%. China is at 7.0% while Russia is at 2.3%. High budget deficits seem to prevail everywhere. It also is unsustainable.
In looking at the economic policies of both candidates, the odds are that the U.S. budget deficit could climb even higher under both of them, but of the two it would climb higher under Trump, mainly due to proposed tax cuts. Both candidates added to the U.S. debt as president. Over his term, former president Donald Trump added $8.6 trillion during his four years while Biden/Harris have added $8.1 trillion. For the record, the GDP grew $3 trillion under Trump, but $7.2 trillion under Biden/Harris.
Source: www.stlouisfed.org
Annual Percentage Increase/Decrease of Federal Debt 1967–2024
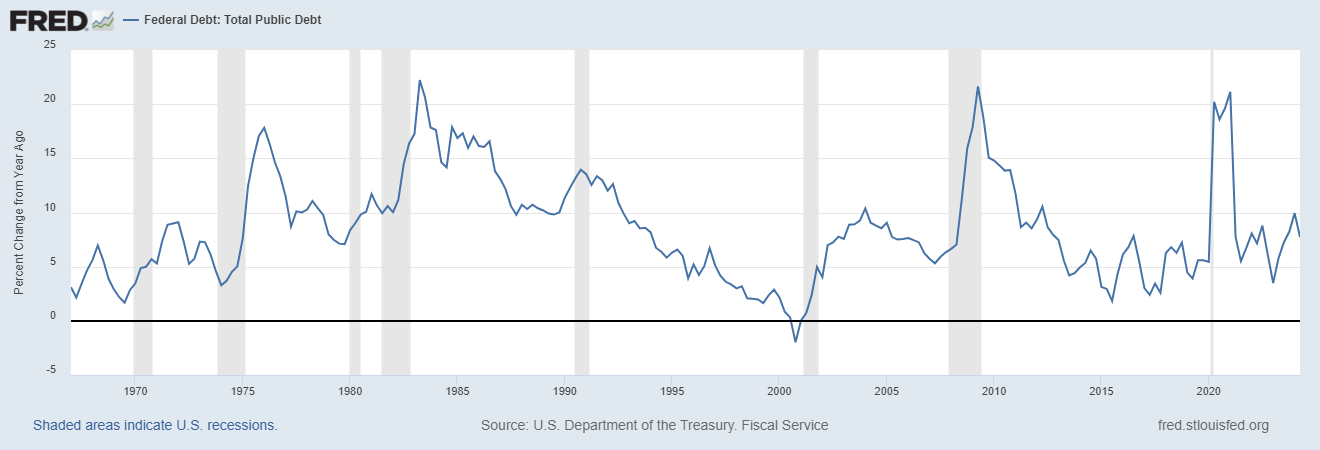
Source: www.stlouisfed.org
Notably, the debt soared in the mid-1970s, largely due to the Vietnam War, in the 1980s due to the Cold War, in 2009/2010 in response to the Great Recession and the financial crisis and again in 2020/2021 due to the pandemic. The annual increases in the debt level fell throughout the 1990s and again during the 2010s.
U.S. Budget Surplus or Deficit (-) 1901–2024
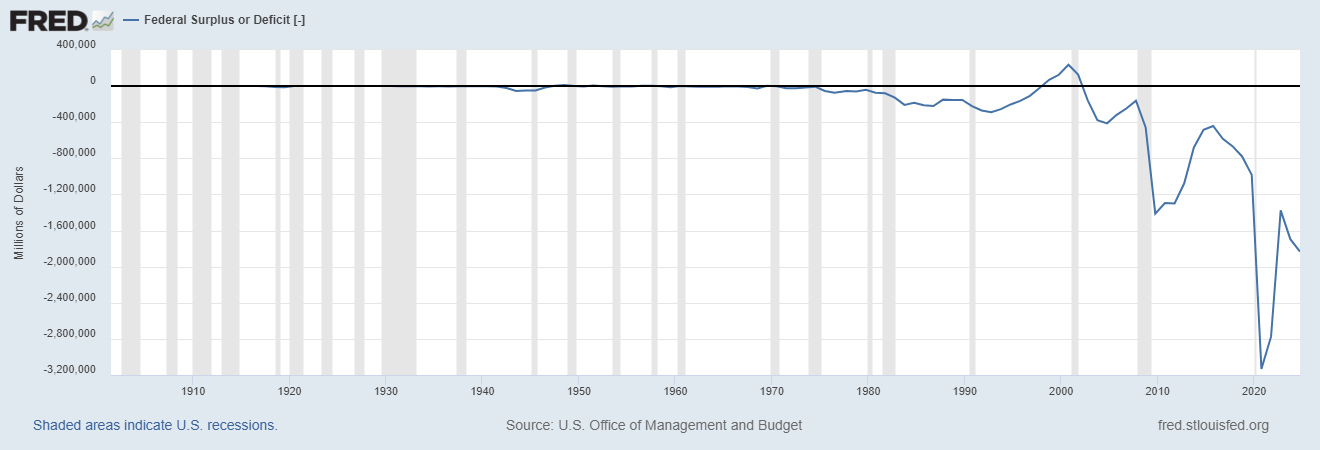
Source: www.stlouisfed.org
The U.S. budget deficit didn’t really start to rise until the 1980s. Yes, they ran wartime deficits, but they soon reverted closer to balanced. It was only during the Vietnam War that deficits started to rise, then accelerated in the 1980s and especially in the 2000s and the 2010s.
Deficits and debt are on an unsustainable path. Eventually that, along with the extremely divisive politics, could negatively impact not only the U.S. but also the rest of the world.
Chart of the week
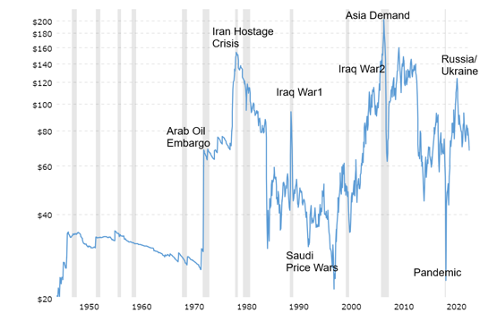
Source: www.macrotrends.net
We move from looking at the S&P 500 and gold on an inflation-adjusted basis to WTI oil on an inflation- adjusted basis. It’s always worth another look. What we discover is that oil on an inflation-adjusted basis is trading at levels seen back in the 1970s before the eruption of the Iranian hostage crisis. Oil is the commodity of war. All those spikes, save one, were sparked by an outbreak of war or disputes emanating from the Middle East. It’s the most dangerous region in the world. Oil prices plunged during the 1980s and 1990s. This was largely due to Saudi Arabia’s desire to regain market share. They pumped more oil in order to bring the price down and set it up for price hikes later when others who produced at higher costs were forced to drop out. The COVID pandemic of 2020 sparked the other big price drop. The 2010s had a glut of oil which continues today after the shock of the opening of the Russia/Ukraine war sparked a price hike.
The Canadian oil sands in Alberta have a lot of oil, but require at least $75–85/barrel to produce profitably. Oil prices would have to fall sharply to cause them to cut back on production. While the odds of the world stopping its use of oil are slim to none, the importance of oil in economies is less today than it was back in the 1970s. Roughly 80% of the world’s energy needs come from fossil fuels including coal, oil, and natural gas. In the U.S., it’s a lot lower at around 46% as the U.S. and other developed countries make more use of hydroelectric, renewable, and nuclear power.
The use of oil as fuel has been around since ancient times. The first use of oil as fuel occurred in China in the fourth century B.C. Natural gas was being used by the fourth century AD. The known reserves of oil are calculated to run out by 2052; however, there remain huge sources of oil, even as much of it may be in places that are difficult to access.
There are numerous complaints about the high price of gasoline, but the reality is that gasoline prices are roughly where they were a decade ago. As an example, on average, Canadians pay taxes of upwards of 28 cents/litre. Taxes impact the price available for gasoline from country to country, and in Canada even from province to province and city to city. The most expensive gasoline in the world is found in Hong Kong while the cheapest gasoline prices are in Libya. Out of roughly 100 countries monitored for prices, Canada, as an example, sits at around 68th while the U.S. is 74th. The EU generally has the highest gasoline prices in the world.
Given the volatility in the Middle East, it is expected that region could spark the next big price hike for oil. As we have noted, the Straits of Hormuz in the Persian Gulf (Iran) see roughly 30% of the world’s oil pass through. The Straits of Malacca are a close second. It is a sharp drop-off to the next chokepoints such as the Suez Canal (Houthis), the Bab-al Mandeb, the Danish Straits, the Panama Canal (drought), the Dardanelles (Turkey), the Straits of Taiwan and the Cape of Good Hope.
Nonetheless, the world’s need for oil is not going to go away any time soon.
Bonus Chart of the Week
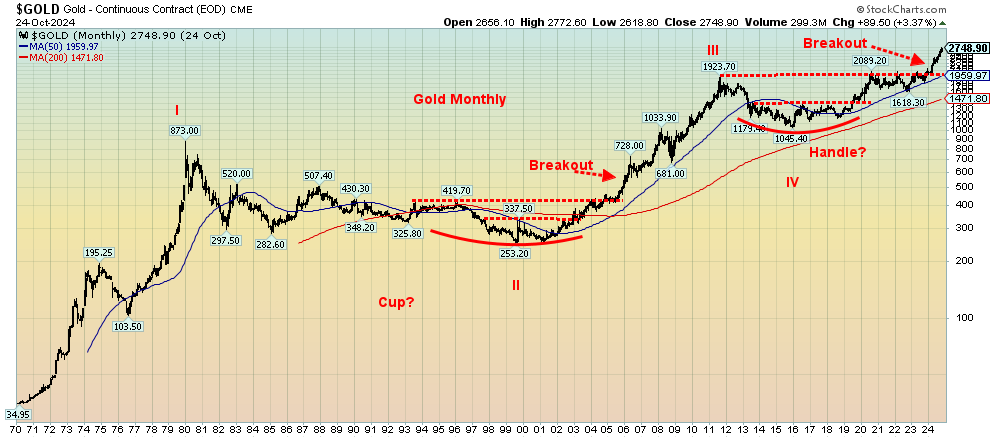
Source: www.stockcharts.com
We are showing our long-term chart of gold because this past week the BRICS held their meeting. If what they discussed in that meeting is carried out, this could upend the world financial order. First, they want to create a mechanism for trading metals between BRICS countries. The mechanism would center on price, production, and trade between accredited participants. The “BRICS Precious Metals Exchange” would be a direct challenge to the London metals market at the LME. Second, they want to create a BRICS currency that would be a basket of gold and BRICS currencies. Such a currency would be a direct challenge to the supremacy of the U.S. dollar the world’s reserve currency. The currency would not be centered on any particular country. However, don’t expect any of this to happen overnight. It may not even come to pass. But it’s being discussed.
Add all this to the BRICS, led by China and Russia, in creating an alternative IMF, World Bank, and SWIFT payments system. Again, all created to get around U.S. hegemony and control of these institutions. And, of course, it could evade all the current sanctions against Russia, etc., even as Russia already successfully evades them. Sanctions are somewhat similar to tariffs. They help reduce world trade.
The creation of BRICS-backed currency with gold could result in a repricing of the current gold price. Already a host of countries including Germany, France, Austria, and the Netherlands, plus other players such as Turkey, Hungary, Poland, Venezuela, and South Africa plus more have removed their gold that was being held by either the Bank of England or the NY Fed and repatriated it to their own central bank.
Central banks have been major buyers of gold over the past year, including adding a record 483 tonnes in the first half of 2024 alone. The U.S. still has the largest holding of gold, some 8,133 tonnes, with a current valuation of roughly $713 billion. The U.S. holds the gold on its books at $42.22 or a value of $11 billion. If the U.S. were to revalue their gold holdings to cover all of its debt gold would need to be at roughly $136,000 vs. $2,730 today. It would, of course, automatically balance the U.S. balance sheet. However, don’t get excited that is about to happen as it would have negative ramifications for almost everything else.
Nonetheless, this all a part of the geopolitical battle currently taking place between the U.S. and Russia/China. A challenge to the world’s hegemony usually doesn’t go unanswered.
Our monthly chart of gold shows what could be four distinct waves to the upside. The fifth wave has broken out and, because of the huge cup and handle formation, it could project to a price for gold up to at least $3,600. Minimum projections are to at least $2,800, a level we are already near. A second calculation for a minimum/maximum target price for gold could be $3,100 and $3,900. Either way, the projection is that gold is going higher. Notably, some analysts have even higher targets.
112 years ago, J.P. Morgan speaking to the U.S. Congress, stated, “Gold is money. Everything else is credit.” And no, he did not mean Bitcoin. The BRICS could be putting us one step closer to realizing Morgan’s musings.
Markets & Trends
|
|
|
|
% Gains (Losses) Trends |
|
||||
|
|
Close Dec 31/23 |
Close Oct 25, 2024 |
Week |
YTD |
Daily (Short Term) |
Weekly (Intermediate) |
Monthly (Long Term) |
|
|
Stock Market Indices |
|
|
|
|
|
|
|
|
|
S&P 500 |
4,769.83 |
5,808.12 |
(1.0)% |
21.8% |
up |
up |
up |
|
|
Dow Jones Industrials |
37,689.54 |
42,114.40 |
(2.7)% |
11.7% |
up |
up |
up |
|
|
Dow Jones Transport |
15,898.85 |
16,104.19 |
(1.7)% |
1.3% |
up |
up |
up |
|
|
NASDAQ |
15,011.35 |
18,518.61 |
0.2% |
23.4% |
up |
up |
up |
|
|
S&P/TSX Composite |
20,958.54 |
24,463.67 (new highs)* |
(1.5)% |
16.7% |
up |
up |
up |
|
|
S&P/TSX Venture (CDNX) |
552.90 |
619.91 (new highs) |
(0.3)% |
12.1% |
up |
up |
down (weak) |
|
|
S&P 600 (small) |
1,318.26 |
1,390.67 |
(3.1)% |
5.4% |
up |
up |
up |
|
|
MSCI World |
2,260.96 |
2,399.32 |
(1.8)% |
6.1% |
down |
up |
up |
|
|
Bitcoin |
41,987.29 |
66,695.95 |
(2.8)% |
58.9% |
up |
up |
up |
|
|
|
|
|
|
|
|
|
|
|
|
Gold Mining Stock Indices |
|
|
|
|
|
|
|
|
|
Gold Bugs Index (HUI) |
243.31 |
331.05 (new highs) |
(3.9)% |
36.1% |
up |
up |
up |
|
|
TSX Gold Index (TGD) |
284.56 |
391.36 (new highs) |
(3.9)% |
37.5% |
up |
up |
up |
|
|
|
|
|
|
|
|
|
|
|
|
% |
|
|
|
|
|
|
|
|
|
U.S. 10-Year Treasury Bond yield |
3.87% |
4.25% |
4.2% |
9.8% |
|
|
|
|
|
Cdn. 10-Year Bond CGB yield |
3.11% |
3.28% |
4.1% |
5.5% |
|
|
|
|
|
Recession Watch Spreads |
|
|
|
|
|
|
|
|
|
U.S. 2-year 10-year Treasury spread |
(0.38)% |
0.13% |
8.3% |
134.2% |
|
|
|
|
|
Cdn 2-year 10-year CGB spread |
(0.78)% |
0.17% |
183.3% |
121.8% |
|
|
|
|
|
|
|
|
|
|
|
|
|
|
|
Currencies |
|
|
|
|
|
|
|
|
|
US$ Index |
101.03 |
104.32 |
0.8% |
3.3% |
up |
neutral |
neutral |
|
|
Canadian $ |
75.60 |
71.97 |
(0.6)% |
(4.8)% |
down |
down |
down |
|
|
Euro |
110.36 |
107.95 |
(0.7)% |
(2.2)% |
down |
down (weak) |
neutral |
|
|
Swiss Franc |
118.84 |
115.39 |
(0.2)% |
(2.9)% |
down |
up |
up |
|
|
British Pound |
127.31 |
129.59 |
(0.7)% |
1.8% |
down |
neutral |
up |
|
|
Japanese Yen |
70.91 |
65.67 |
(1.8)% |
(7.4)% |
down |
down (weak) |
down |
|
|
|
|
|
|
|
|
|
|
|
|
|
|
|
|
|
|
|
|
|
|
Precious Metals |
|
|
|
|
|
|
|
|
|
Gold |
2,071.80 |
2,754.60 (new highs)* |
0.9% |
33.0% |
up |
up |
up |
|
|
Silver |
24.09 |
33.78 |
1.7% |
40.2% |
up |
up |
up |
|
|
Platinum |
1,023.20 |
1,036.70 |
1.2% |
1.3% |
up |
up |
up |
|
|
|
|
|
|
|
|
|
|
|
|
Base Metals |
|
|
|
|
|
|
|
|
|
Palladium |
1,140.20 |
1,202.70 |
10.9% |
5.5% |
up |
up |
down |
|
|
Copper |
3.89 |
4.37 |
(0.2)% |
12.3% |
neutral |
up (weak) |
up |
|
|
|
|
|
|
|
|
|
|
|
|
Energy |
|
|
|
|
|
|
|
|
|
WTI Oil |
71.70 |
71.78 |
4.5% |
flat |
neutral |
down |
down |
|
|
Nat Gas |
2.56 |
3.09 |
36.7% |
20.7% |
up |
up |
down (weak) |
|
Source: www.stockcharts.com
Note: For an explanation of the trends, see the glossary at the end of this article.
New highs/lows refer to new 52-week highs/lows and, in some cases, all-time highs.
- * New All-Time Highs
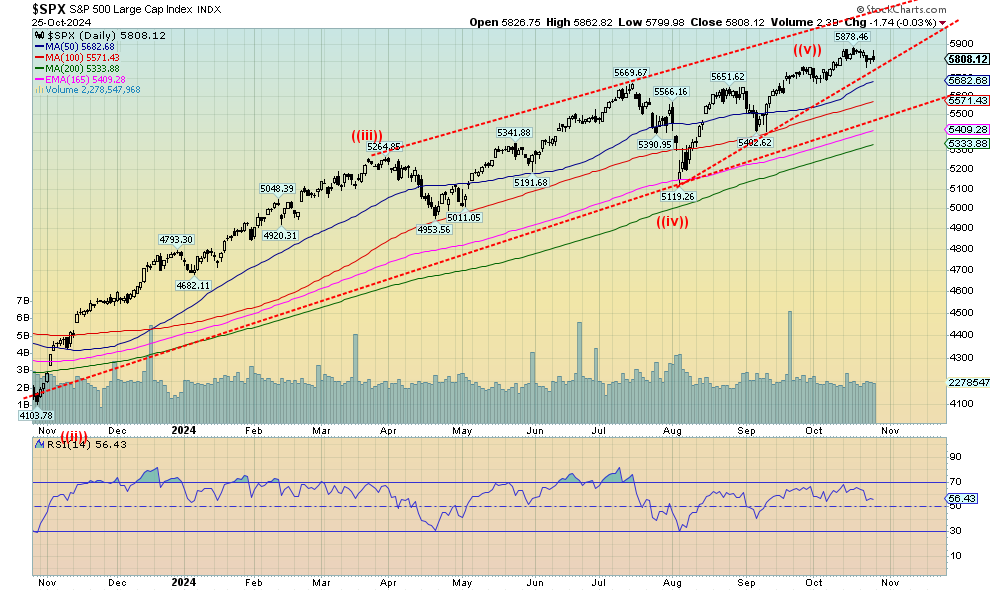
Source: www.stockcharts.com
Are we topping, or is this just another pullback? There was a reversal day on October 15 for the S&P 500 (SPX) and another one on October 17 from a marginally higher level. But neither was what we call a key reversal day. The Dow Jones Industrials (DJI) did have an outside reversal day on October 15 and then followed it up with new highs before it turned down again. While both are signs of weakness, we won’t really know we’ve topped until we break under 5,700 for the SPX. A full confirmation of a top doesn’t come until we bust under 5,400, then especially under 5,100. So, we have some way to go. Otherwise, this is just a pullback as we’ve seen many times since the lows in October 2023.
On the week, the SPX fell 1.0%, the DJI dropped 2.7%, the Dow Jones Transportations (DJT) was down 1.7%, while the NASDAQ eked out a small gain of 0.2%. The S&P 400 (Mid) fell 2.8% while the S&P 600 (Small) dropped 3.8%. Weak Mids and Smalls is a weak sign for the market. In Canada, the TSX fell 1.5% after making new all-time highs while the TSX Venture Exchange (CDNX) fell 0.3% after making new 52-week highs. In the EU, the London FTSE fell 1.3%, the EuroNext was off 0.8%, the Paris CAC 40 was down 1.5%, and the German DAX was down 1.0%. In Asia, China’s Shanghai Index (SSEC) was up 1.2%, but the Tokyo Nikkei Dow (TKN) fell 5.2% as Japan falls into a recession. Hong Kong’s Hang Seng (HSI) fell 1.2%. The MSCI World Index was down 1.8%. Bitcoin also fell off 2.8%. All in all, not a great week for the world’s stock markets. But none of them have given a significant sell signal, even as some have come down from overbought conditions.
It is an overvalued, bubbly market, but here we are in October and no major collapse has occurred. We are entering what is supposed to be the best six months from already lofty levels. We are reminded of the top in October 2007 before the 2008 financial crisis and the Great Recession. However, November is approaching and we have the contentious election on November 5. Many expect a mess, regardless of who wins. One candidate has already said that he will not accept the election if he loses. The other side is silent on that, but the opposition to Trump is strong. So, who knows how it will unfold? As a worst case, some are expecting that the U.S. will descend into Civil War. It’s the most contentious election since 1860 between Abraham Lincoln and John Breckinridge. Lincoln carried the election because of the Northern states while Breckinridge won the South. By April 1861, the Southern states began to secede, triggering the Civil War (1861–1865).
November is usually a solid up month. Number 1 for the SPX and number 2 for the DJI. Tellingly, the worst Novembers were 1973, November 2000, and November 2008. All those were prior to or coinciding with the recession of 1973–1975, the recession of 2000–2002, and the Great Recession of 2007–2009. The overall record for November since 1950 is 50 up and 23 down with the best gains usually seen in election years. The result is that how November goes could determine how the next few months go. But a very contentious election does not invite a warm fuzzy feeling for the stock market. Be prepared.
Source: www.stockcharts.com
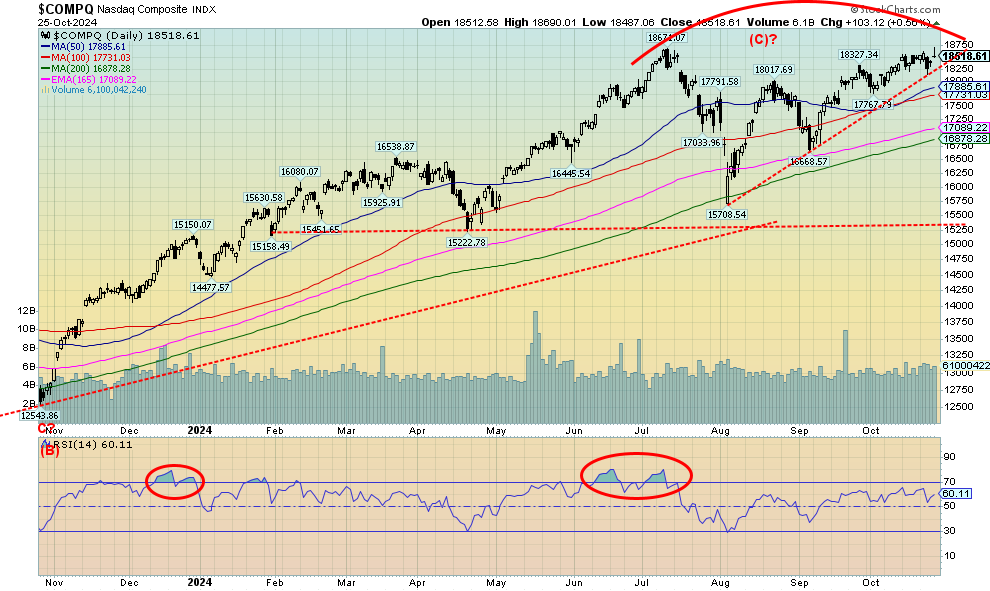
The NASDAQ refuses (it seems) to make new all-time highs. Once again, the NASDAQ tried to rise but once again failed the previous all-time high seen in June at 18,761. The NASDAQ gained about 0.2% this week. The NY FANG Index, which helps drive the NASDAQ with the MAG7, fell 0.2%. Notable among the MAG7 was the sharp 22.0% jump by Tesla this past week. Can it be sustained? Also, while not a MAG7 stock, Trump Media (DJT) jumped 31.7% on some growing expectation that Trump will win the election. The big losers were the Chinese FANG stocks Baidu and Alibaba, both down 4.9%. The NASDAQ still appears to us as a large topping/distribution pattern. We’d call it a double top, but that wouldn’t be confirmed until we break down under 15,700. If that happened, the target could be down to 12,750. That’s a drop of almost 32% from the highs. The big unknown is what happens after the election. A mess could spook the stock markets.
Source: www.stockcharts.com
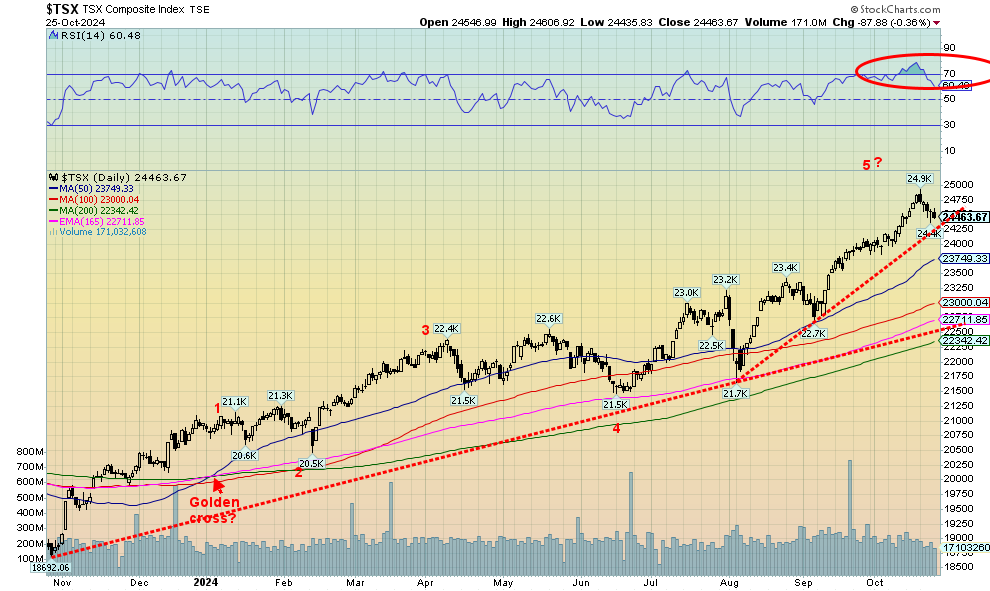
New all-time highs, then a reversal and a lower close—that’s what we saw this past week for the TSX. No, we haven’t as yet broken the uptrend line. That comes in around 24,250, then there is further support down to 23,750. But below that? The TSX Composite fell 1.5% this past week. The TSX Venture Exchange (CDNX) made 52-week highs, then reversed and closed down 0.3%. Of the two, the TSX reversal looks potentially more significant than the CDNX. The TSX reversed from an all-time high. The CDNX just came off a new 52-week high. Twelve of the 14 sub-indices finished to the downside this past week. Golds (TGD) was down 4.0% and Materials (TMT) was down 0.8%; both made new highs, then closed lower. Leading the downside was Golds (TGD), but all significant was Consumer Staples (TCS), down 2.6%, Metals & Mining (TGM) also down 2.6%, and Income Trusts (TCM) and Utilities (TUT), both down 2.2%. With bond yields rising, the high dividend yield groups suffered. The only winners were Energy (TEN) +1.2% and Health Care (THC) +0.6%. Follow-through to the downside is essential now if that reversal is true. The pullback has removed the overbought conditions that were prevailing with the RSI now down to 60.0.
U.S. 10-year Treasury Note, Canada 10-year Bond CGB
Source: www.tradingeconomics.com, www.home.treasury.gov, www.bankofcanada.ca
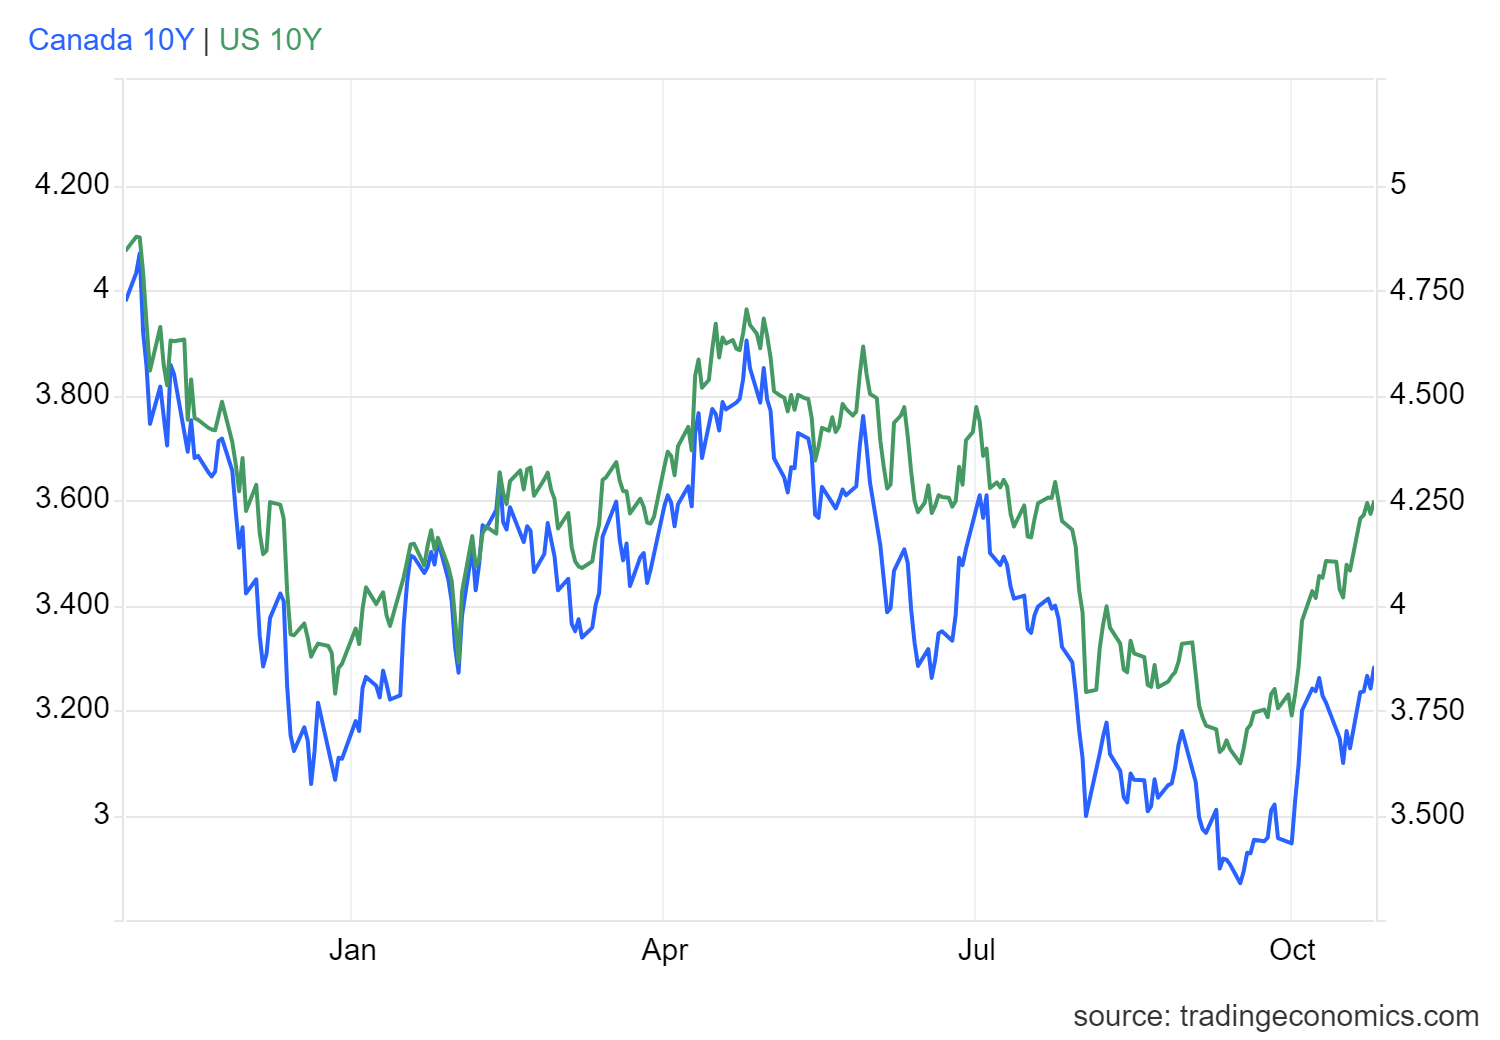
If the Fed is cutting rates, then why are bond yields rising? Aren’t they supposed to fall? They did initially. But after hitting a low of 3.62% for the U.S. 10-year treasury note on September 16, it has been mostly to the upside since. The 10-year is now at 4.25%. Canada hasn’t been immune and again, despite the BofC cutting rates, including another 50 bp this past week, the 10-year Government of Canada bond (CGB) is back up to 3.28% from a low of 2.87%.
Is the bond market rebelling at the thought of rate cuts that they feel are coming too fast? Or is it the ongoing, better than expected performance of the economy? Or is it the volumes of debt being issued, especially in the U.S. where it is possible they are rebelling at the ever-expanding debt of the U.S. government. Canada’s debt is also expanding, but from a much lower base and Canada (Federal) still has the lowest debt to GDP in the G7. Add in the provinces, however, as many count and Canada’s government debt is right up there with everyone else.
Of the numbers this past week, existing home sales were slightly higher than expected at 3.84 million vs. 3.8 million and were down only 1% vs. the expected 1.6%. Initial jobless claims once again came in stronger than expected at 227,000 vs. last week’s 242,000 and expectations of 247,000. Is the job market still strong? Seems that way. The Global PMI was 54.3, above the expected 54.0 and last month’s 54.0. It is still signaling expansion, not contraction. New home sales were 0.738M vs. the expected 0.700M and last month’s 0.709M. Even the Michigan Consumer Sentiment Index (October final) improved to 70.5, above the last reading at 70.1 and the forecast of 68.9. Are bond yields responding to all this seemingly good news?
4.25% might present some resistance, but once we’re through it, the next stop might be 4.50%. We’d be surprised if we went back to the highs just over 5.0%. So, we have short rates coming down and long rates rising, seemingly against the short rates. That has made the 2–10 spread a bit wider as the U.S. 2–10 rose to 13bp and the Cdn. 2–10 to 17bp. All this continues to signal we are headed for a recession. And rising long rates against the grain could cause further problems in an already weakened mortgage market.
Source: www.stockcharts.com
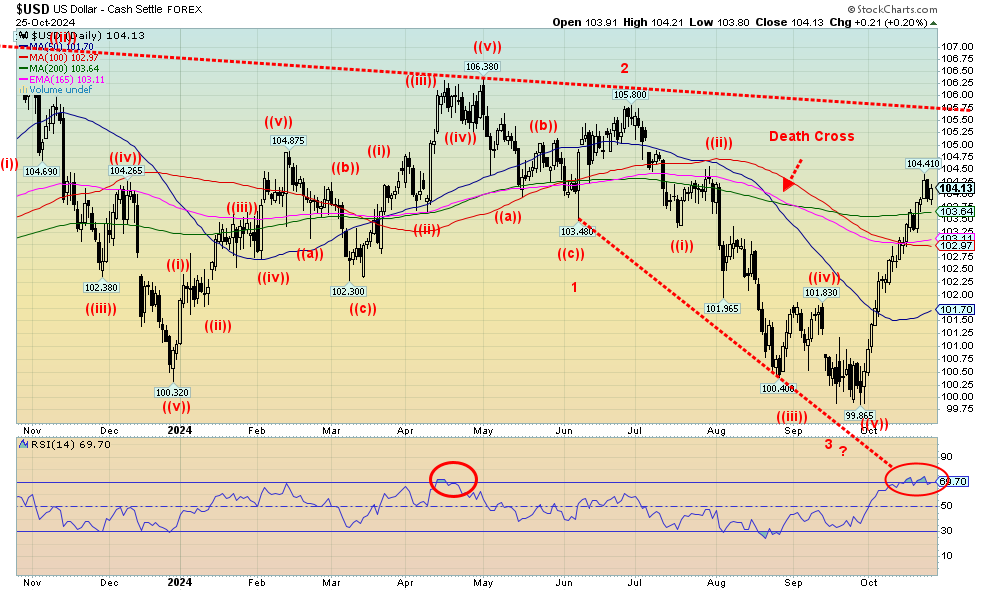
The US$ Index continued to show strength again this past week. Oddly enough, despite the strength, gold prices have remained firm. Gold usually trades inversely to the US$ Index. On the week, the US$ Index rose 0.8%. That meant the currencies fell. The euro was down 0.7%, the Swiss franc was off 0.2%, the pound sterling down 0.7%, and the weakest was the Japanese yen, down 1.8%. The Cdn$ fell to its lowest level since November 2023, losing 0.6%. The Cdn$ closed under 72.00 for the first time since August. Given Canada’s position in the global oil markets, geopolitical events in the Middle East might actually help Canadian oil and in turn help the value of the Cdn$. It needs to regain above 73 to suggest a low.
The US$ Index broke above the 200-day MA resistance, but what’s key now is to stay above that level if we are to go higher. But we are coming off overbought conditions and the move since September has been straight up, a condition that usually cannot hold. A breakdown back under 103 would signal the end of the rally. Only further gains could keep this up move alive. Given the unsustainability of straight-up moves, the next move is likely down, not up. The question is, will support zones hold?
Source: www.stockcharts.com
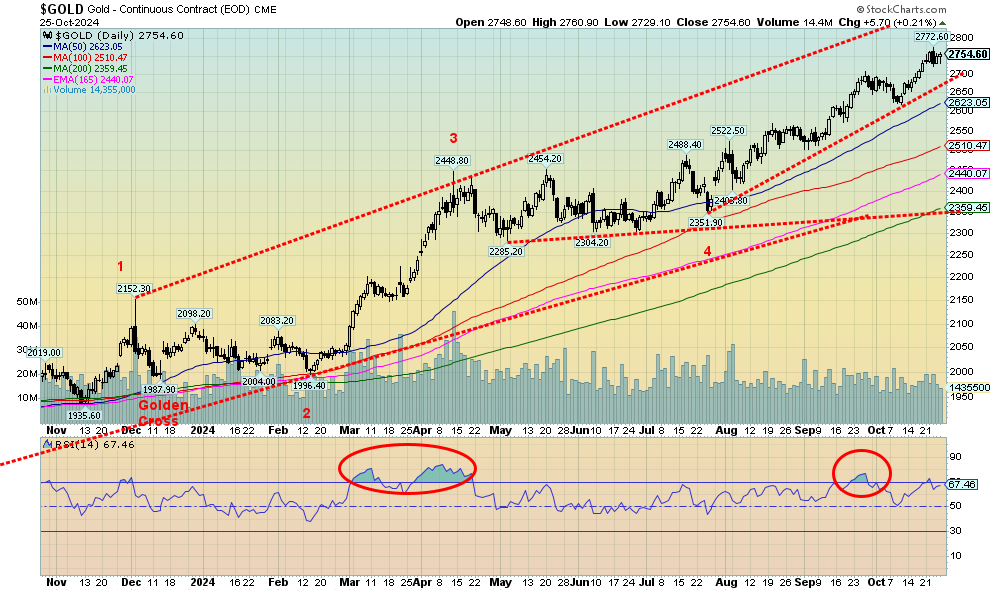
Gold, the ultimate hedge; geopolitics, domestic politics, and huge debt. These are, we believe, the main drivers today. Another record high for gold prices that hit a high of $2,772, then turned down and actually had an outside day reversal. A key reversal? We can’t tell that yet. We can only wait and see if there is further follow- through to the downside. The gold stocks took it on the chin and, yes, silver also turned down after making 52-week highs, so those could be warning signs. But with geopolitical uncertainty and, even more, domestic political uncertainty with the upcoming U.S. election, that could either make gold soar further to the upside or have a nasty correction.
On the week, gold made new all-time highs and, despite the reversal, managed to close up 0.9%. Silver gained 1.7%. All this came against the backdrop of a still-rising US$ Index. Gold normally trades inversely to the U.S. dollar. Platinum gained 1.2%, but this week it was palladium’s time to shine, jumping 10.9%. Copper didn’t fare as well and lost a small 0.2%. The gold stocks turned tail, most likely negatively impacted by Newmont’s poor results. The Gold Bugs Index (HUI) fell 3.9% as did the TSX Gold Index (TGD).
It is no surprise to discover that $2,700 is now support. We’d prefer to see it hold. Under that level, the next good support is down to $2,600/$2,625. Under that level, further declines could be seen. Gold is attracting a lot more attention these days, particularly from the media, who are usually gold-agnostic. Firms such as Goldman Sachs have been recommending gold. It’s no surprise it has caught the attention of scribes and firms, given gold’s 33% move thus far in 2024. Silver is even better, up 40% while the HUI is up 36% and the TGD up about 38%. Our preference is to see silver and the gold stocks leading. Except mostly this year, until recently, it has been gold that has led.
We do have higher targets, as noted earlier, over $3,000. At $2,700 we are not that far off, but we do seem to run into resistance every $100. We’ll see how gold responds to the Israeli/Iran bombings. Failure to put in new highs might mean we correct back further. But ultimately, even after another possible pause, we should be headed higher.
Source: www.stockcharts.com
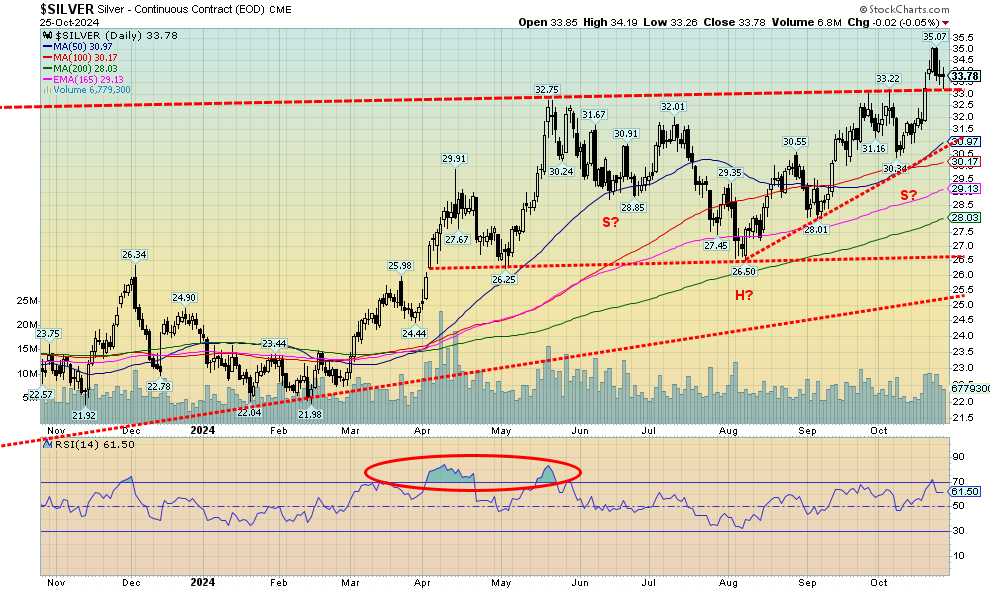
Silver, it appears, remains unloved and under-appreciated, particularly given its industrial uses in electronics, green energy, and more, along with it being the companion of gold as a means of exchange. On the week, silver rose 1.7% which did outpace gold. Silver made 52-week highs after hitting just over $35. Then came the sharp pullback as gold, silver, and the gold stocks corrected back. The good news is it eased the overbought conditions and in turn could set us up for the next upward move. Silver did break above a long-standing resistance zone near $33. The pullback this past week seemed to be testing that breakout. It should act as support. We wouldn’t be concerned about silver unless it were drop back under $32. Targets following the breakout remain up to $39/$40. That pattern still appears as a somewhat awkward head and shoulders reversal. Now we need to see the proof.
Source: www.stockcharts.com
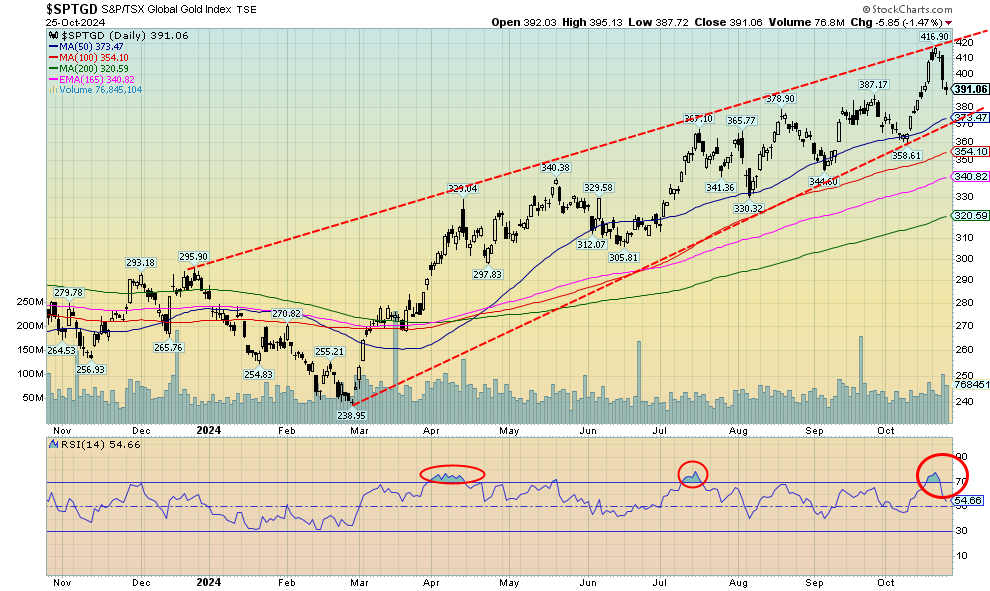
Gold stocks fell this past week, despite both gold and silver being up modestly on the week. The good news is that the pullback has removed the overbought conditions and potentially sets us up for the next up move. We did make fresh 52-week highs at the beginning of the week before the fall came. Impacting gold stocks negatively were the poor results from Newmont, the world’s largest gold mining company. The negative impact of Newmont spread into the rest of the market and profit-taking followed, sending the gold stocks tumbling. On the week, the TSX Gold Index (TGD) lost 3.9% as did the Gold Bugs Index (HUI). Most of the loss came following the Newmont earnings announcement.
Last week it looked like we were breaking out, but we questioned it at the time. All it did was raise the top of the current bull channel. The bottom of the channel is near 373, so a break under 370 would be more negative. The 50-day MA is currently at 373.50. The area has held the TGD since those lows in February 2024. As well, we note that an RSI near 50 has also held the market. The RSI was 54.66 on Friday. We expect that this area will hold, particularly given the geopolitical events on the weekend. The rally since the February low has seen consistent pullbacks, which we view as a sign of strength. Expectations are that new highs will come once this pullback is finished.
Source: www.stockcharts.com
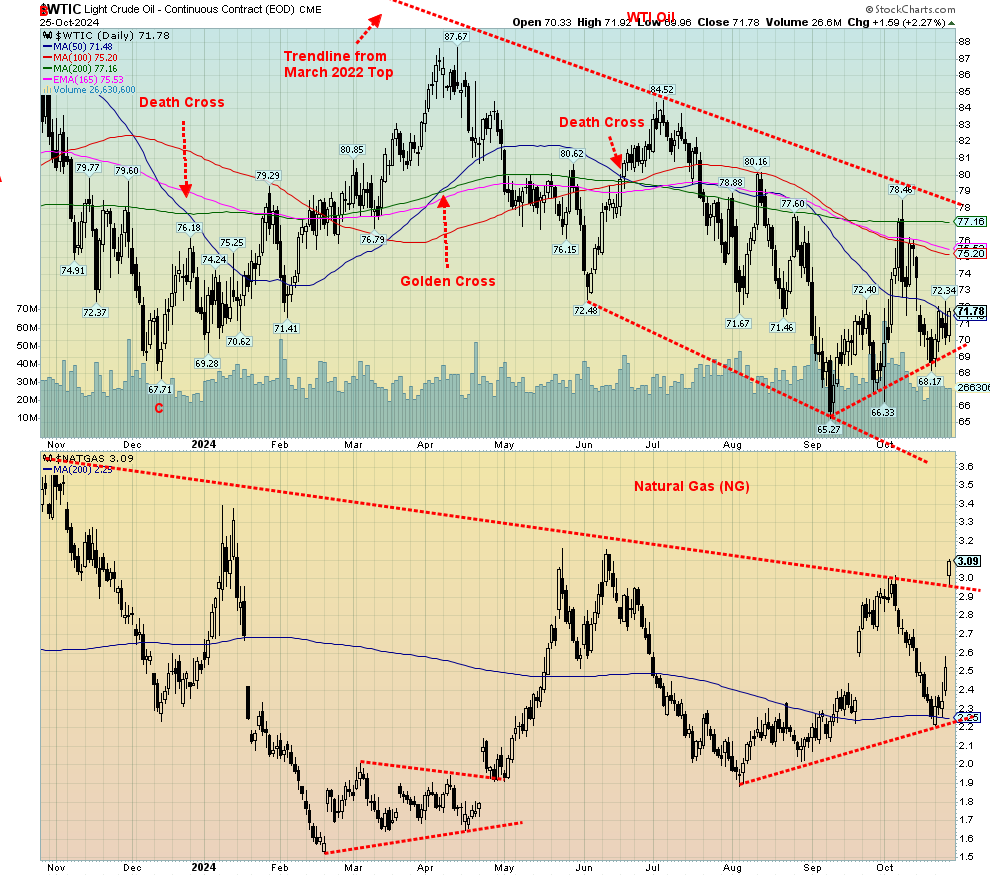
We are too early to know the impact of the Israeli bombing of Iran on markets. But we do know that geopolitical events can have a profound impact on the markets. WTI oil did rise this past week, despite restocking of the U.S. reserves, and a strong dollar usually has a dampening impact on oil and other commodities. Still, WTI oil rose 4.5% this past week while Brent crude was up 3.1%. Both have remained weak during 2024, except for that runup earlier in the year. Since then, it has been mostly downhill.
Natural gas (NG) does respond to events, particularly geopolitical ones, but also to weather events. Threats of storms in the Gulf of Mexico can have a profound impact. As a result, NG at the Henry Hub jumped on Friday after the next possible hurricane could threaten gas facilities in the Gulf. NG was up 36.7% on the week while geopolitical events helped EU NG at the Dutch hub rise 10.9%. The energy stocks were decidedly mixed as the ARCA Oil & Gas Index (XOI) fell 1.2% but the TSX Energy Index (TEN) rose 1.2%.
NG appears to have broken out over that $3 resistance level and could now be pointed higher. The negative is that gap is enticing to fill. Upside follow-through could be important. WTI oil so far seems to be holding that uptrend line and the geopolitical events could push prices higher this coming week. Technically, WTI oil still has to successfully clear $75 and then clear $78/$80 before we can say that the uptrend is now established and higher levels are probable. But the big driver is the geopolitical events. As we showed earlier, war, especially in the Middle East, is the biggest driver for oil prices.
Copyright David Chapman 2024
GLOSSARY
Trends
Daily – Short-term trend (For swing traders)
Weekly – Intermediate-term trend (For long-term trend followers)
Monthly – Long-term secular trend (For long-term trend followers)
Up – The trend is up.
Down – The trend is down
Neutral – Indicators are mostly neutral. A trend change might be in the offing.
Weak – The trend is still up or down but it is weakening. It is also a sign that the trend might change.
Topping – Indicators are suggesting that while the trend remains up there are considerable signs that suggest that the market is topping.
Bottoming – Indicators are suggesting that while the trend is down there are considerable signs that suggest that the market is bottoming.
Disclaimer
David Chapman is not a registered advisory service and is not an exempt market dealer (EMD) nor a licensed financial advisor. He does not and cannot give individualised market advice. David Chapman has worked in the financial industry for over 40 years including large financial corporations, banks, and investment dealers. The information in this newsletter is intended only for informational and educational purposes. It should not be construed as an offer, a solicitation of an offer or sale of any security. Every effort is made to provide accurate and complete information. However, we cannot guarantee that there will be no errors. We make no claims, promises or guarantees about the accuracy, completeness, or adequacy of the contents of this commentary and expressly disclaim liability for errors and omissions in the contents of this commentary. David Chapman will always use his best efforts to ensure the accuracy and timeliness of all information. The reader assumes all risk when trading in securities and David Chapman advises consulting a licensed professional financial advisor or portfolio manager such as Enriched Investing Incorporated before proceeding with any trade or idea presented in this newsletter. David Chapman may own shares in companies mentioned in this newsletter. Before making an investment, prospective investors should review each security’s offering documents which summarize the objectives, fees, expenses and associated risks. David Chapman shares his ideas and opinions for informational and educational purposes only and expects the reader to perform due diligence before considering a position in any security. That includes consulting with your own licensed professional financial advisor such as Enriched Investing Incorporated. Performance is not guaranteed, values change frequently, and past performance may not be repeated.
About the author


Website: https://www.enrichedinvesting.com
Disclaimer: David Chapman is not a registered advisory service and is not an exempt market dealer (EMD) nor a licensed financial advisor. We do not and cannot give individualised market advice. David Chapman has worked in the financial industry for over 40 years including large financial corporations, banks, and investment dealers. The information in this newsletter is intended only for informational and educational purposes. It should not be considered a solicitation of an offer or sale of any security. The reader assumes all risk when trading in securities and David Chapman advises consulting a licensed professional financial advisor before proceeding with any trade or idea presented in this newsletter. David Chapman may own shares in companies mentioned in this newsletter. We share our ideas and opinions for informational and educational purposes only and expect the reader to perform due diligence before considering a position in any security. That includes consulting with your own licensed professional financial advisor.