
Hands up if you know which currency is the best performing in March 2022. Many might be surprised to learn it is the Russian ruble. On February 24, 2022 when Russia invaded Ukraine, one U.S. dollar could purchase 84 rubles. On April 1, 2022 one U.S. dollar could purchase 81.4 rubles. Seems nothing happened and everything happened. Sanctions against Russia saw the ruble soar to 150 per U.S. dollar by March 7, 2022 (close was 132 per U.S. dollar), a gain of 79% or, stating it the other way, the ruble fell against the U.S. dollar from 0.0119 per ruble to 0.00667 per ruble, a depreciation of 44%. On April 1 the ruble against the U.S. dollar was at 0.0123 per ruble, an improvement from where it was at the start of the invasion and sanctions. The ruble appreciated 78% against the U.S. dollar from the low around March 7, 2022.
It has been a dramatic turnaround. So, what happened to spark this dramatic turnaround? A few things. Russia made moves to limit ruble selling by instituting capital controls, capping the amount of dollars residents can withdraw from foreign currency accounts and barring banks from selling foreign currencies to customers. Foreign clients can’t sell securities. They also hiked the key Central Bank of Russia (CBR) interest rate to 20%. All that helped to stabilize the ruble and brought it back, but it was the announcement that Russia would require “unfriendly countries” (i.e., countries who have placed sanctions on Russia) to pay for their oil and gas in rubles rather than in U.S. dollars or euros that may have changed the game. They also cautioned that other major commodity exports could also be priced the same way. The result was that the ruble strengthened.
Whether this move works or not remains to be seen. How it would work, however, is that foreign purchasers of Russian oil and gas would have to take their U.S. dollars to the CBR and exchange them for rubles to make their payments. This helps to increase the demand for rubles, thus supporting the ruble. Except the CBR is on the U.S. sanctions list so this presents a dilemma.
U.S. Dollars to purchase Russian Rubles US$1 = Rubles 81.4 April 1, 2022
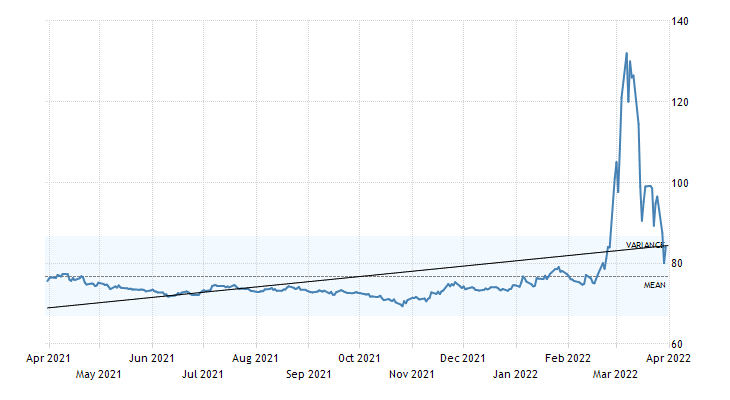
Source: www.tradingeconomics.com, www.cbr.ru
But all of this goes further. Russia also indicated that they could accept Bitcoin as well. What happened is the price of Bitcoin started rising. But Bitcoin almost seemed like an afterthought. Rubles and gold came before Bitcoin. Russia is indicating they are happy to accept almost any currency for their commodities (especially oil and gas) except U.S. dollars or euros.
At the same time, Russia announced they would buy gold from local banks at a fixed price of 5,000 rubles per gram between March 28 and June 30. That price expressed in ounces is 155,517.50 rubles/ounce (one troy ounce = 31.1035 grams). On April 1, 2022 gold in Russian rubles was quoted at 161,036/ounce or 5,177 rubles/gram. Setting a fixed price for gold locally is akin to the U.S. setting gold at $35/ounce back in 1934 or the period of the gold standard between 1879 and 1914 when gold was set at US$20.67. Earlier, Russia had halted official gold purchases due to surging demand from customers. With sanctions, Russians went on a gold buying spree to protect savings as the ruble plunged. By setting the price of gold at 5,000 rubles per gram, Russia has effectively put the ruble on a gold standard. This could also set a floor for the price of gold. Based on the 5,000 rubles per gram that works out to roughly US$1,940/ounce. The question is, with the ruble linked to gold, how do you weaken the price of gold without also weakening the ruble?
Against this backdrop the U.S. had banned all gold transactions with the CBR. With Russia now demanding payment in rubles or gold from “unfriendly countries,” the West faces some stark choices. Either pay in rubles or gold or risk not receiving oil and gas exports from Russia. This has triggered a crisis, particularly in Germany, as both Germany and Austria are potentially moving towards gas rationing. Other EU countries are
contemplating the same. While the G7 has rejected Russia’s request to pay for oil and gas in rubles, claiming it
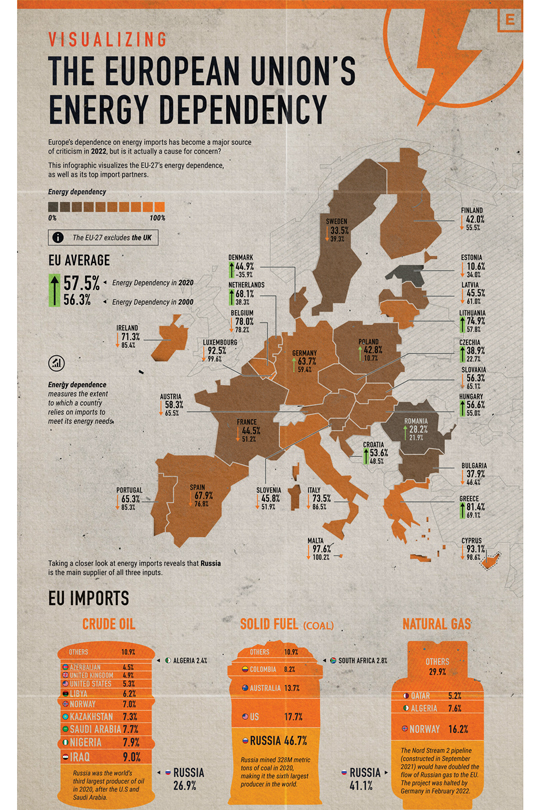
is a breach of contract, it is also a big problem for them. Germany receives about 50% of their gas and about 33% of their oil from Russia. Austria receives about 80% of its gas from Russia. Other countries could be in the same bind. The EU receives roughly 46% of all their gas from Russia, even as Russia exports 83% of its gas to the EU. Russia is also 12% of the world’s oil exports of which 53% goes to the EU. Contracts may be in euros or U.S. dollars but Russia is saying sorry—pay in rubles or gold and, if you don’t, you won’t receive your oil and gas. As of April 1, 2022, nothing has happened so far and the gas is flowing normally mostly because payments in rubles wouldn’t start to take effect until later in April.
Source: www.visualcapitalist.com, www.paradigm.press.com
Gas supplies in Germany are probably good for the time being, but Germany is apparently down to less than 25% of its strategic reserves. Russia could go further and demand payment in rubles for all commodities including metals, fertilizers, grains, and timber. Russia is a commodity powerhouse.
Russia and Germany have spoken about the problem. Russia has indicated that payment could still be made in euros through Gazprombank, a bank that is not yet subject to sanctions. Gazprombank would then convert the payment into rubles. Germany and Russia have agreed, verbally at least, to allow Germany to pay for gas in euros to Gazprombank. A reminder, however, that the West has collectively rejected Russia’s demand for payment in rubles which could also stop Germany from paying in euros to Gazprombank. The question is, can this agreement be put in writing and, secondly, how will it be received by the U.S. who has led the sanctions against Russia? Using Gazprombank because it has not been sanctioned is a way of getting around sanctions. If they sanctioned Gazprombank then no one would be able to pay for their oil and gas to Russia.
Other countries are also talking to Russia about arranging deals. One country is India where the Russia would continue sending oil to India with payment in rubles or rupees. The reality is, the ruble regime is supposed to come into effect on April 1, 2022. Russia has made it clear they won’t be providing gas for free. “No payment, no gas.” When the U.S. and Saudi Arabia worked out their agreement back in the 1970s over how the U.S. would pay for their oil, the U.S. dollar became known as the petrodollar. So, is this the petro ruble? Or the gold ruble?
All this leaves much hanging up in the air. The EU cannot replace Russian oil and gas overnight. Already there is talk of rationing and other emergency measures. Trying to find supplies elsewhere could put further upward pressure on prices that have already soared in 2022. A reminder that Russia is the world’s largest natural gas exporter and the second largest exporter of crude oil. While Russia is not an OPEC member, it does coordinate with Saudi Arabia. The Saudis are not doing any favours either as OPEC is not supplying more to the oil markets than they already announced. They are continuing this to stay in tune with Russia. The U.S. is going to supply one million barrels a day from its Strategic Reserves to help lower the cost of oil, but this is a band-aid at best. All this continues to suggest that there could be a global energy crisis with shortages and rationing. If Russian oil were abandoned, prices could soar to $200 according to some analysts. While Russia would lose the equivalent of €200 to €800 million/day as a result of an embargo, some of this could be redirected to Asian markets but not enough to make up for the loss of EU oil and gas.
Chart continues on next page
Increase in the Price of Energy Products & Gold since January 1, 2022
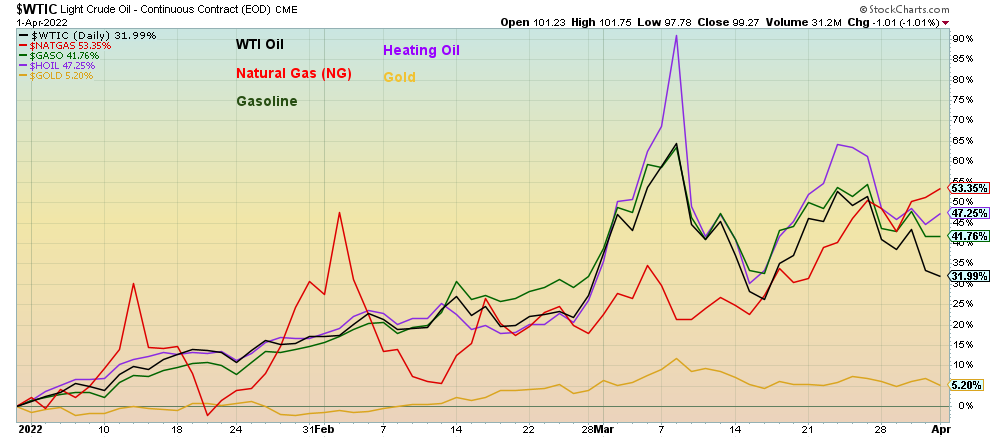
Source: www.stockcharts.com
As the chart shows, since January 1, 2022 WTI oil is up 32.0%, natural gas (NG) +53.4%, gasoline +41.8%, heating oil +47.3%, and gold +5.2%. In the EU, NG is up even more. These returns are to April 1, 2022 following a down week for most of them. As we have noted, sanctions are akin to the trade and currency wars seen during the 1930s that helped exacerbate the Great Depression. The energy supply shock is not dissimilar to the supply shocks we saw in the 1970s: first in 1973–1974 and then again in 1979. Only the causes are different. The 1973-1974 crisis was caused by the Arab Oil Embargo. Others such as 1979 and 1990 were sparked by a crisis in the Mid-East. But this one is caused by the sanctions.
All of these maneuvers by Russia are to help shore up the ruble, even if it means little to the Russian economy. These moves could also lead to shoring up the gold price. In effect, Russia has been backing the ruble with gold for years. China even more so but China has not officially declared a gold-backed yuan. Being a large gold producer means Russia does not have to go elsewhere to buy gold. They can purchase it from themselves. This gets around any sanctions. Sanctions are very complex and workarounds can easily be found. Given that many banks are self-sanctioning themselves for fear of breaking U.S. sanctions it only complicates things further. The same has happened in the oil market where some are not dealing with anything Russian, including not allowing Russian oil tankers to dock for refueling or taking off their cargo for fear of breaking sanctions
Russia’s request to accept only rubles as payment for its oil and gas is a potential game changer. It sets in motion a potential currency war. If that happens it could be very good for gold. However, we emphasize that none of this is for sure at this time. It will unfold over time. This is irrespective of whether the rubles are purchased by Germany or others or they use Gazprombank as the go-between. If the ability to use Gazprombank as the go-between fails, then we could be facing even higher prices of energy as Germany and the EU scramble to find supplies elsewhere. The reality is, they are not there. Inflation is most likely destined to remain high for the foreseeable future.
Supply chain shocks are not about to abate either. To add to the woes, there is the potential for strikes by dockworkers and the ongoing COVID-related shutdowns in China. Supply chain shocks feed through the economy to the cost of almost everything—shipping, container costs, docking fees, warehouse fees, and much
more. The supply shocks and inflation are hitting key commodities of food and energy and metals. Gasoline at the pump has doubled in the U.S. over the past year and nearly doubled in Canada. And all of this comes against the backdrop of war and record debts with the Fed in the process of hiking interest rates and pulling out of QE. This continues to point towards a potential recession, starting possibly later this year or at least in 2023.
Chart of the Week
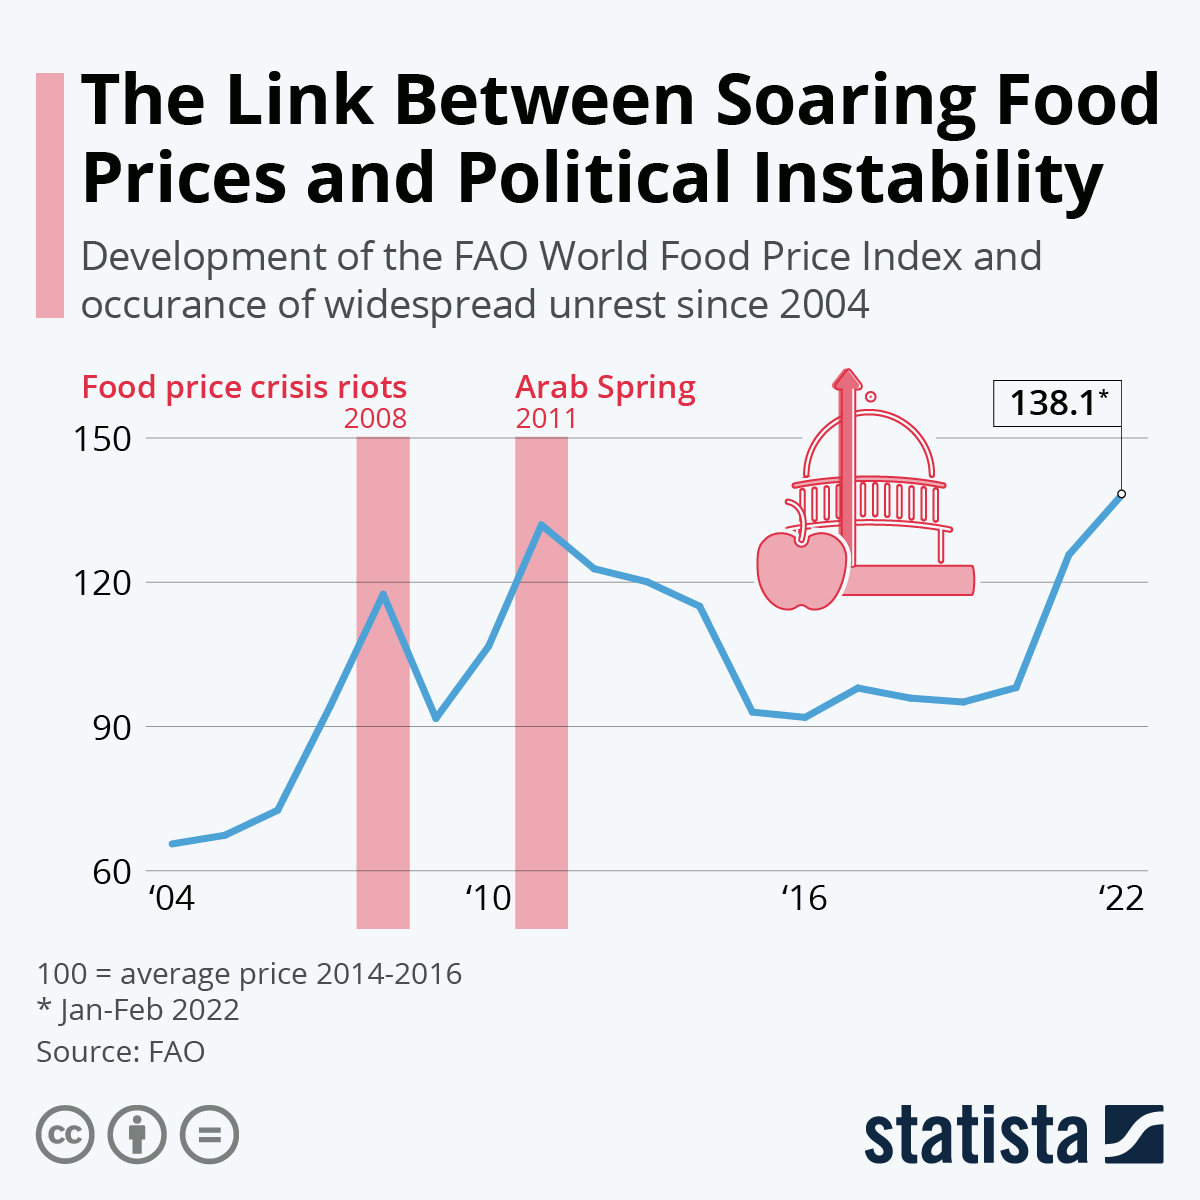
Source: www.statista.com, www.invesbrain.com, www.fao.org
As if it isn’t enough of a problem with soaring energy costs, we also have soaring food prices. This chart from Statista (www.statista.com) from the Food and Agricultural Organization of the United Nations (FAO) (www.fao.org) shows how food prices have soared, particularly since the outbreak of war in the Ukraine. Russia and Ukraine are roughly 30% of the global wheat supply. Droughts in North America and elsewhere have lowered outputs in those countries. Russia’s and Ukraine’s contribution cannot be made up overnight. Shipments out through the Black Sea are effectively blocked. Wheat exports from Russia and Ukraine make up roughly 80% of all wheat imports for Turkey and Egypt. Other countries in Africa, the Middle East, and even into Asia are major importers of wheat from Ukraine and Russia.
The result of all of this is soaring food prices (not just wheat) as depicted here by the FAO. The last two times there were soaring food prices in 2008 and again in 2011, it led to food riots and civil unrest, particularly in the Middle East and Northern Africa. Given that many of these regimes are military dictatorships (Egypt being a prime example), it is possible that revolts and unrest could destabilize these countries. Other countries besides those in the Middle East and Northern Africa are in Asia—Bangladesh and Indonesia in particular. Unrest has already occurred in Iraq this past month. Yemen is in a global humanitarian crisis as a result of food shortages and the war with Saudi Arabia. Supply chain problems are also exacerbating the situation. The supply chain problems date from the pandemic that got underway in 2020.
For North Americans it means we are paying considerably higher prices at the grocery store and in restaurants.
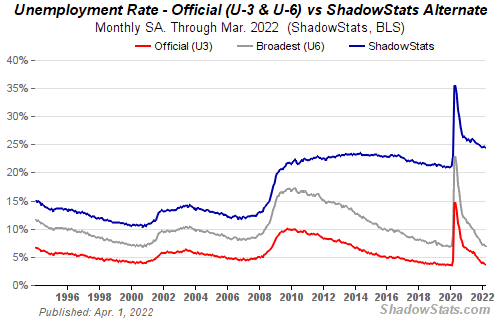
Source: www.shadowstats.com
We find it increasingly difficult to call the latest job report good. Sure, it announced that nonfarm payroll employment increased by 431,000 jobs in March and the unemployment rate (U3) fell to 3.6%, but despite the big job gain the U.S. remains short by 1,579,000 nonfarm jobs level seen in February 2020—two years ago before the COVID pandemic burst onto the scene. The March figure was some 60,000 jobs short of what was expected but that was more than made up for with the 95,000 upward revision of February’s nonfarm payroll. As to the unemployment rate (U3), well, it was 3.5% in February 2020. So, the official unemployment rate has fallen for the most part to where it was before the COVID pandemic.
A reminder, however, that fewer people are participating. The labour force participation rate for March was 62.4% vs. 62.3% in February but 63.4% in February 2020. A higher participation rate can translate into a higher unemployment rate. The employment population ratio for March was 60.1% vs. 59.9% in February but was 61.2% in February 2020. In February 2020 more people were participating in the labour force and more people were employed. In March 2022 the total labour force was 164,409 thousand vs. 164,583 thousand in February 2020. Meanwhile, the population level, meaning all those 16 years and over, was 263,444 thousand in March vs. 259,628 thousand in February 2020. So, the working age population has gone up but the number actually employed has gone down and fewer are participating in the jobs market. It was reported that 99,170 thousand were not in the labour force in March vs. 95,393 thousand not in the labour force in February 2020. Of the March’s total, retirees total 56,367 thousand and those on disability total 9,134 thousand. Many more are students or stay-at-home mothers/fathers.
Full-time employment has done well with 132,718 thousand employed full-time and 25,902 thousand part-time. In March those numbers were 131,806 thousand and 25,801 thousand. But in February 2020, full-time was 130,839 thousand and part-time 27,848 thousand. So, in some respects that’s good news with more working full-time and fewer part-time. The U6 unemployment rate (U3 plus those marginally attached plus those employed part-time for economic reasons) was 6.9% vs. 7.2% in February and 7.0% back in February 2020. The Shadow Stats (www.shadowstats.com) unemployment number (U6 plus discouraged workers unemployed over one year and who are no longer in the BLS numbers defined away in 1994) fell to 24.4% from 24.6% in February but up from 21.3% in February 2020.
Notable job gains were seen in leisure and hospitality, professional and business services, retail trade and manufacturing. Average weekly hours were 34.6 vs. 34.7 in February. Average hourly earnings rose 0.4% in March or 5.6% year over year (y-o-y). That rise is less than the 7.9% inflation rate posted for February. For the moment, wages are lagging inflation which could be problematic down the road. In February 2020 inflation was 2.3%. Best wage gains were for those in leisure and hospitality, but transportation and warehousing also reported good wage gains. With fewer participants in the job market, finding people to fill jobs remains difficult.
A great jobs report? Well, when you are still short by almost 1.6 million jobs after two years and the population and labour force have grown, it is difficult to call it great.
MARKETS AND TRENDS
|
|
|
|
% Gains (Losses) Trends
|
|
||||
|
|
Close Dec 31/21 |
Close Apr 1/22 |
Week |
YTD |
Daily (Short Term) |
Weekly (Intermediate) |
Monthly (Long Term) |
|
|
Stock Market Indices |
|
|
|
|
|
|
|
|
|
S&P 500 |
4,766.18 |
4,545.86 |
0.1% |
(4.6)% |
up |
neutral |
up |
|
|
Dow Jones Industrials |
36,333.30 |
34,818.27 |
(0.1)% |
(4.2)% |
up (weak) |
neutral |
up |
|
|
Dow Jones Transports |
16,478.26 |
15,511.30 |
(5.3)% |
(5.9)% |
up (weak) |
up |
up |
|
|
NASDAQ |
15,644.97 |
14,261.50 |
0.7% |
(8.8)% |
up |
down |
up |
|
|
S&P/TSX Composite |
21,222.84 |
21,952.95 (new highs) |
(0.2)% |
3.4% |
up |
up |
up |
|
|
S&P/TSX Venture (CDNX) |
939.18 |
897.42 |
1.3% |
(4.5)% |
up |
down (weak) |
up |
|
|
S&P 600 |
1,401.71 |
1,331.34 |
flat |
(5.0)% |
up |
down (weak) |
up |
|
|
MSCI World Index |
2,354.17 |
2,228.14 |
0.8% |
(5.4)% |
neutral |
down |
up (weak) |
|
|
NYSE Bitcoin Index |
47,907.71 |
45,884.34 |
3.5% |
(4.2)% |
up |
neutral |
up |
|
|
|
|
|
|
|
|
|
|
|
|
Gold Mining Stock Indices |
|
|
|
|
|
|
|
|
|
Gold Bugs Index (HUI) |
258.87 |
321.38 |
2.1% |
24.2% |
up |
up |
up |
|
|
TSX Gold Index (TGD) |
292.16 |
360.12 |
3.0% |
23.3% |
up |
up |
up |
|
|
|
|
|
|
|
|
|
|
|
|
Fixed Income Yields/Spreads |
|
|
|
|
|
|
|
|
|
U.S. 10-Year Treasury Bond yield |
1.52% |
2.38% (new highs) |
(4.0)% |
56.6% |
|
|
|
|
|
Cdn. 10-Year Bond CGB yield |
1.43% |
2.43% (new highs) |
(4.7)% |
69.9% |
|
|
|
|
|
Recession Watch Spreads |
|
|
|
|
|
|
|
|
|
U.S. 2-year 10-year Treasury spread |
0.79% |
(0.07)% (new lows) |
(108.9)% |
(138.9)% |
|
|
|
|
|
Cdn 2-year 10-year CGB spread |
0.48% |
0.10% (new lows) |
(50.0)% |
(79.2)% |
|
|
|
|
|
|
|
|
|
|
|
|
|
|
|
Currencies |
|
|
|
|
|
|
|
|
|
US$ Index |
95.59 |
98.63 |
(0.2)% |
3.2% |
up |
up |
up |
|
|
Canadian $ |
.7905 |
0.7991 |
(0.3)% |
1.1% |
up |
up |
up |
|
|
Euro |
113.74 |
110.50 |
0.6% |
(2.9)% |
down (weak) |
down |
down |
|
|
Swiss Franc |
109.77 |
108.11 |
0.6% |
(1.5)% |
neutral |
down |
up (weak) |
|
|
British Pound |
135.45 |
131.14 |
(0.6)% |
(3.2)% |
down |
down |
neutral |
|
|
Japanese Yen |
86.85 |
81.63 (new lows) |
(0.3)% |
(6.0)% |
down |
down |
down |
|
|
|
|
|
|
|
|
|
|
|
|
|
|
|
|
|
|
|
|
|
|
Precious Metals |
|
|
|
|
|
|
|
|
|
Gold |
1,828.60 |
1,923.70 |
(1.6)% |
5.2% |
neutral |
up |
up |
|
|
Silver |
23.35 |
24.65 |
(3.8)% |
5.6% |
neutral |
up |
up |
|
|
Platinum |
966.20 |
988.60 |
(2.0)% |
2.3% |
down |
down (weak) |
up |
|
|
|
|
|
|
|
|
|
|
|
|
Base Metals |
|
|
|
|
|
|
|
|
|
Palladium |
1,912.10 |
2,267.50 |
(5.3)% |
18.6% |
down |
neutral |
up |
|
|
Copper |
4.46 |
4.69 |
(0.2)% |
5.1% |
up |
up |
up |
|
|
|
|
|
|
|
|
|
|
|
|
Energy |
|
|
|
|
|
|
|
|
|
% |
75.21 |
99.27 |
(12.8)% |
32.0% |
neutral |
up |
up |
|
|
Natural Gas |
3.73 |
5.72 |
2.0% |
53.4% |
up |
up |
up |
|
Source: www.stockcharts.com, David Chapman
Note: For an explanation of the trends, see the glossary at the end of this article.
New highs/lows refer to new 52-week highs/lows and, in some cases, all-time highs. 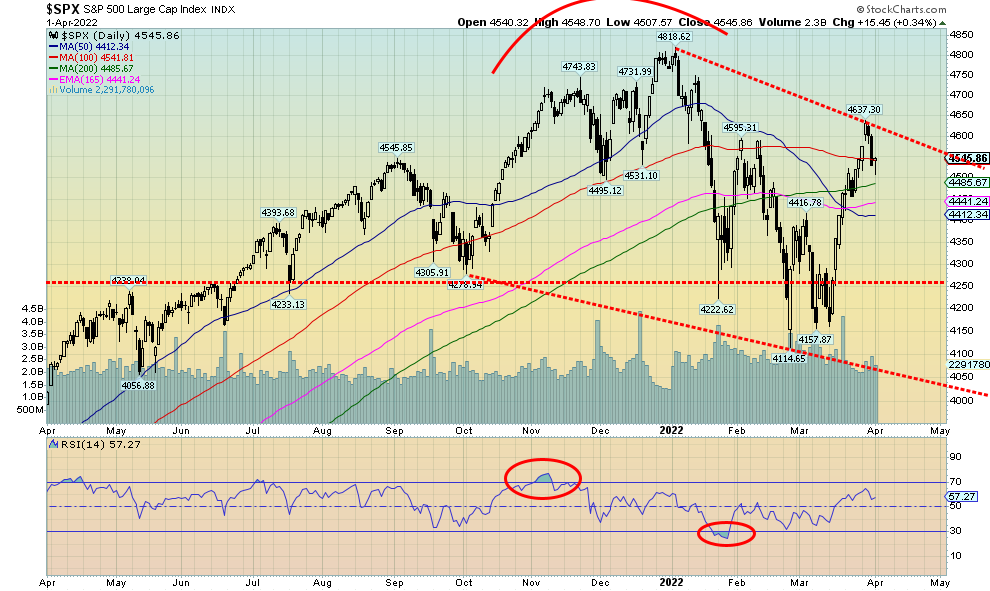
Source: www.stockcharts.com
Stock markets may have been higher to start Q2 on Friday, but Q1 ended on a sour note as the major stock indices ended Q1 with the first loss in two years since the pandemic crash of March 2020. Besides the job numbers, which many considered great, WTI oil fell below $100 as the Biden administration promised to release over a third of its strategic reserves to help lower oil prices. The jobs number may have been somewhat weaker than expected but it was still good enough for most so, following a two-day selloff, the markets rebounded on Friday.
Looming in the background are further signs of a possible recession. We have already noted that inflation above 5% and oil prices above $100 were potentially early warning signs of a coming recession. We can now add an inverting yield curve. Yes, the 2–10, 5–30, and 5–10 yield curves have all inverted, meaning the short rate is now higher than the long rate. But not the 3-month–10 curve that remains wildly positive at 1.85%. Many point to that one as being more key as a recession indicator than the others. So maybe the others are just early warning signs.
This past week the markets were decidedly mixed. The S&P 500 gained a small 0.1%, but the Dow Jones Industrials (DJI) lost 0.1% and the Dow Jones Transportations (DJT) were hit, down 5.3%. The NASDAQ rallied, up 0.7%. The S&P Equal Weight 500 also gained 0.1%. The small cap S&P 600 was flat while the mid-cap S&P 400 lost 0.1%. In Canada, the TSX Composite did it again making new all-time highs, but then reversed and
closed lower, off 0.2%. The TSX Venture Exchange (CDNX) gained 1.3% to its highest level since Mid-January. Bitcoin continued its recent winning ways thanks to thoughts that one could pay for Russian oil and gas with Bitcoin. The NY Bitcoin Index was up 3.5% to almost $46,000.
Overseas in the EU, the London FTSE was up 0.6%, the Paris CAC 40 gained 2.0%, and the German DAX was up about 1.0%. In Asia, China’s Shanghai Index (SSEC) was up 2.2% and the Tokyo Nikkei Dow (TKN) was down 1.7%. The MSCI World Index was up 0.8%. China’s SSEC was up despite the lockdown in Shanghai due to COVID and a manufacturing PMI index falling below 50, indicating that recessionary conditions are showing up in China. If China does slow, then that doesn’t bode well for the rest of the world.
Indicators remain mixed as well. The put/call ratio was 0.59, up from 0.50 the previous week. Seems they are getting a bit more cautionary. Bear indices are less bearish and bull indices are more bullish. The All-Bulls Index is practically into the “what’s a bear” territory. Just a short time ago it was the opposite. The advance/decline line is rising but it’s struggling. The percentage of stocks trading over their 200-day MA is at 52.5% while the number over their 50-day MA is 63.3%, getting high but not over 80% yet. The S&P 500 Bullish Percent Index (BPSPX) is at 72%—that’s high but, again, there’s room to move higher where it doesn’t get overbought until over 80.
The S&P 500 closed back below its 100-day MA this past week. A slightly negative sign. Support is seen down to just under 4,500, then down to 4,400. Below 4,400 a more serious decline could get underway. We believe any pullback now would just be a correction of the move from the low at 4,115 to the high this week at 4,637. Key Fibonacci supports are seen near 4,500, 4,440, 4,375, and 4,310 but below 4,240 new lows are probable.
The Fed doesn’t meet again until May and it is widely expected that they will hike 50 bp. Recessionary signs are being seen but none of them tells us when it will happen. It could be six months away or a year away. Or it could appear really fast if things go awry. One thing that would help is peace in the Ukraine, but don’t expect that soon either. Even if Russia and Ukraine came to an agreement tomorrow, sanctions would remain, and as long as sanctions remain commodity prices are going to remain high and Russia actually has little incentive to come to an agreement unless it’s strictly on their terms. So don’t expect any relief there.
As to the markets, stocks may have gone as high as they are going to go for the moment. The rebound rally from the February low of 4,115 recouped 74.1% of the decline from January 4 to the bottom on February 24 (oddly, the day that Russia invaded Ukraine). If the S&P 500 managed to clear over 4,650, then the odds start to rise that we could see new all-time highs over 4,819 the high of January 4. We could still do that even now, but if we were to break back under 4,475 then the odds begin to dissipate that we could see new highs.
For now, ongoing high inflation, the Fed hiking rates, and the ongoing war in Ukraine are more than likely to keep the markets down rather than returning to a full bull market anytime soon.
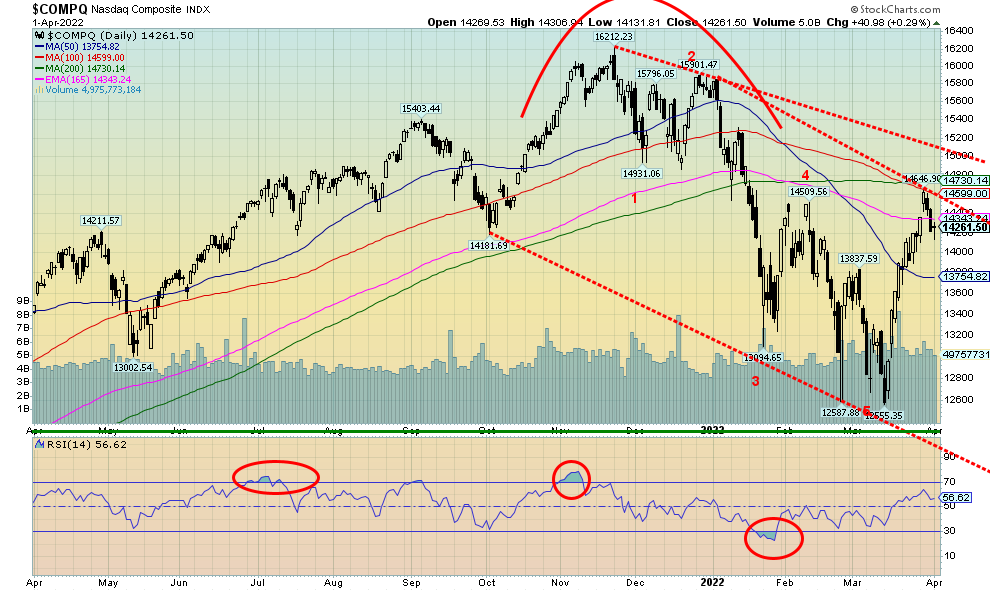
Source: www.stockcharts.com
The NASDAQ was one of the few gainers this past week, up about 0.7%, but it was no consolation as the NASDAQ remains down 8.8% in 2022. The FAANGs did perform this past week mostly to the downside. Meta (Facebook) was up 1.4%, Apple lost 0.2%, Amazon was down 0.8%, Netflix off 0.1%, Google down 0.6%, but Microsoft beat, gaining 1.8%. Tesla was a big winner, gaining 7.3% and Twitter was up 1.8%. But the Chinese stocks took it on the chin again with Baidu down 3.8% and Alibaba off 2.5%. Seems the word is “avoid” the Chinese stocks. Nvidia lost 3.6%. Not a great record with seven out of the 10 down on the week. Overall, the NY FAANG Index lost about 0.1% on the week and is down 10.5% on the year. If we are right that the NASDAQ completed a 5-wave decline from the high in early January, then we are embarking on an upward B-wave correction. The A wave may have completed this week. Following a pullback that could take the NASDAQ back to the 13,600 area, we could then embark on another wave to the upside. We see support at 13,750/13,800, but below that level it is pretty open to the recent bottom at 12,555.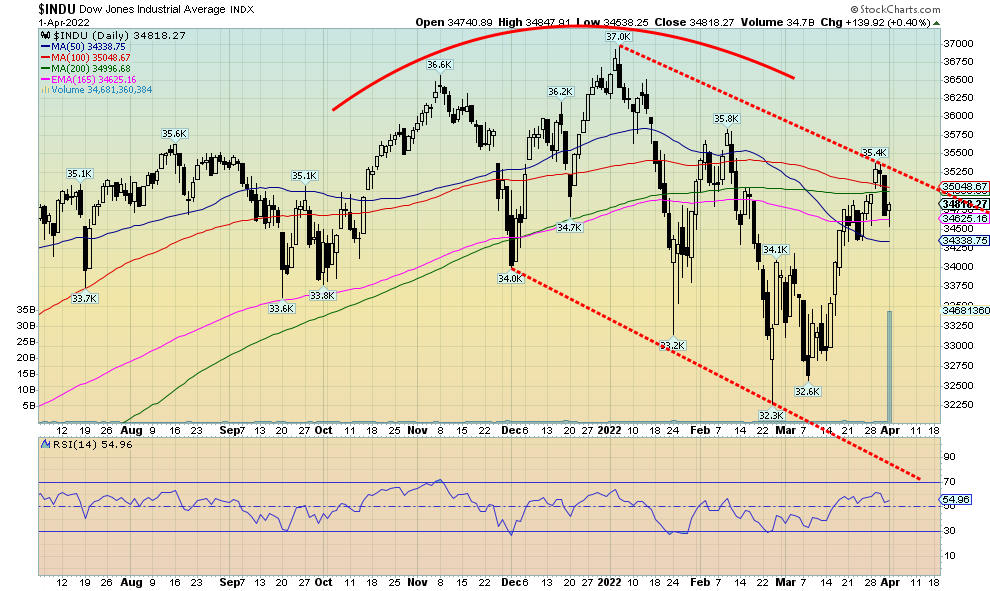
Source: www.stockcharts.com
Last week we drew a line off the top of the DJI parallel to the line from the December low, connecting the late February low. We hit that line this week, then the DJI reversed and closed down. The DJI did bounce back on Friday following the jobs report but it was a small gain of 0.4%. On the week the DJI was down 0.1% and remains down 4.2% on the year. The top this week came just above the 100-day MA and the close on the week put the DJI back below both the 100- and 200-day MAs. Another breakdown under 34,300 should send the DJI lower once again. Only new highs and breakout of the down channel could suggest further gains.
Source: www.stockcharts.com
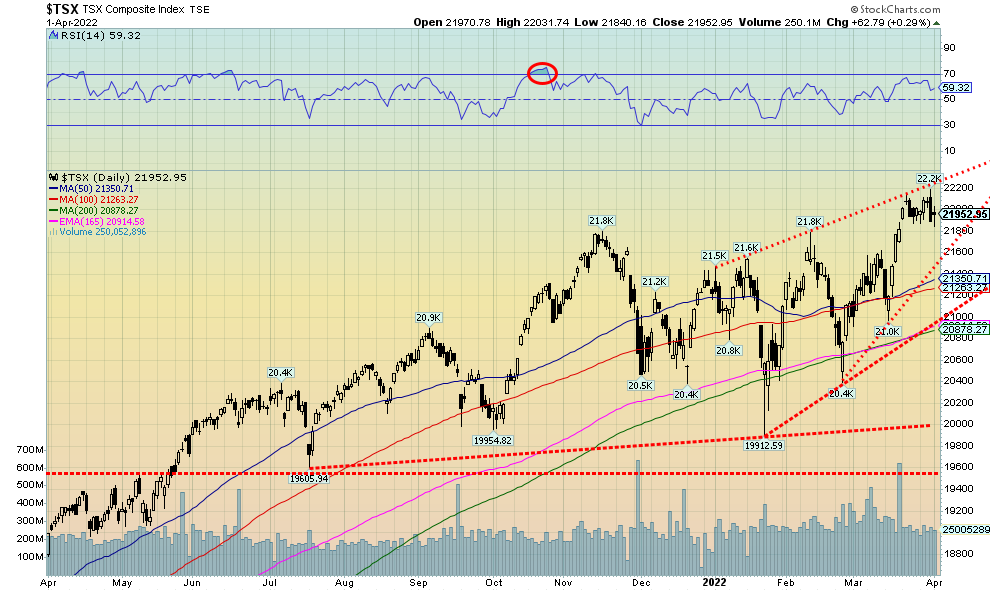
The TSX Composite continues to be the star once again, making new all-time highs. But it didn’t last and the TSX actually closed the week down 0.2%. A reversal week. Ten of the 14 sub-indices finished in the green this past week, led by Utilities (TUT) and Telecommunications (TTS). They gained 3.4% and 3.0% respectively and both hit fresh 52-week highs. Also hitting new 52-week highs was Metals & Mining (TGM), up just under 3.0%. Golds (TGD) also gained 3.0%. Leading the way to the downside was Health Care (THC) down 5.9%. Industrials (TIN) was the other main loser, down 2.1%. The TSX Composite appears to be trading near the top of what might be an ascending wedge triangle. Ascending wedge triangles are bearish. Currently the breakdown zone is seen at 21,600 and it could project the TSX back to 20,000. The TSX also could continue to rise in the wedge triangle. Support under 21,600 can be seen near 21,000. The TSX could also push to new highs again above 22,200 but the top of that triangle should limit the gains. The key areas to be in continue to be golds, metals, and materials. Given the shakedown in oil prices this past week some caution on energy; however, it is showing no major signs of a top. We note that Consumer Staples (TCS) also made new all-time highs this past week, up about 1.7%. Consumer Staples are a great place to hide in a potential recession, given everyone has to eat. No surprise that one finds Loblaws (L), Metro (MRU), George Weston (WN), Empire (EMP.A), and Alimentation Couche Tarde (ATD) amongst the components.
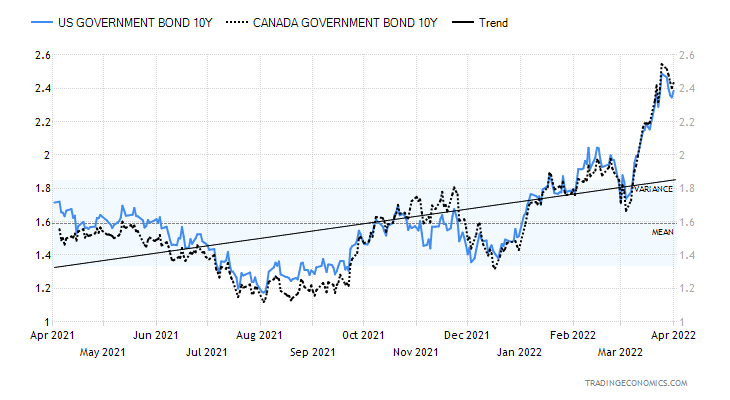
U.S. 10-year Treasury Bond/Canadian 10-year Government Bond (CGB)
Source: www.tradingeconomics.com, www.home.treasury.gov, www.bankofcanada.ca
U.S. treasuries rallied this past week (prices rose, yields fell as yields move inversely to prices). Despite the decent job numbers on Friday, the bond market rallied as some early warning signs of an impending recession were seen. The 2–10 spread turned negative (fell to -0.06%) as did the 5–30 spread and the 5–10 spread. The 5–30 spread turned negative for the first time since 2006. But, as we note next, the 3M–10 spread is nowhere near turning negative. That could change quickly but, overall, a recession still appears to be months away, possibly not until 2023. Economic numbers were decidedly mixed this past week. The job numbers were reviewed earlier. The trade balance for February was a hugely negative at $106.59 billion. A huge negative trade balance weighs on the economy and is considered a drag. The Case-Shiller home price rose 19.1% y-o-y to January 2022. That gain, we suspect, is not sustainable. The house price index y-o-y was up 18.2%. Q4 GDP was 7.1% which was about as expected. More concerning were PCE prices, up 6.4% in Q4. Personal spending for February was a disappointment, up only 0.2% but personal income rose 0.5%. Initial jobless claims for the week were 202,000, above the expected 195,000 and last week’s 188,000. The Chicago PMI was a robust 62.9, well above the expected 56.5 and last month’s 56.3. The S&P Global Manufacturing PMI was 58.9 higher than the expected 56. The March ISM Manufacturing Index was 57.1, slightly lower than the expected 58.5. There are not a lot of economic numbers of importance out this coming week. Canada releases its job numbers next Friday, April 8. The market is looking for a gain of 140,000 jobs vs. last month’s gain of 336,600. The unemployment rate is expected to remain at 5.5%.
Earlier in the week the 10-year climbed to 2.48% before coming down and closing the week at 2.38%. The low on the week was 2.32%. If that breaks again, then we could expect the 10-year to fall to support levels, first to support at 2.30% then down to 2.20% where better support could be found. New highs above 2.48% could suggest a move to the 2.65% area. With some growing signs of a possible recession, it is possible that bonds have seen their high (yield). It is possible that, with the high of 2.48%, the 10-year has completed what might be five waves up from lows seen last August 2021. If the 10-year falls below 2.30%, we could get a confirmation of a high.
Source: www.stockcharts.com
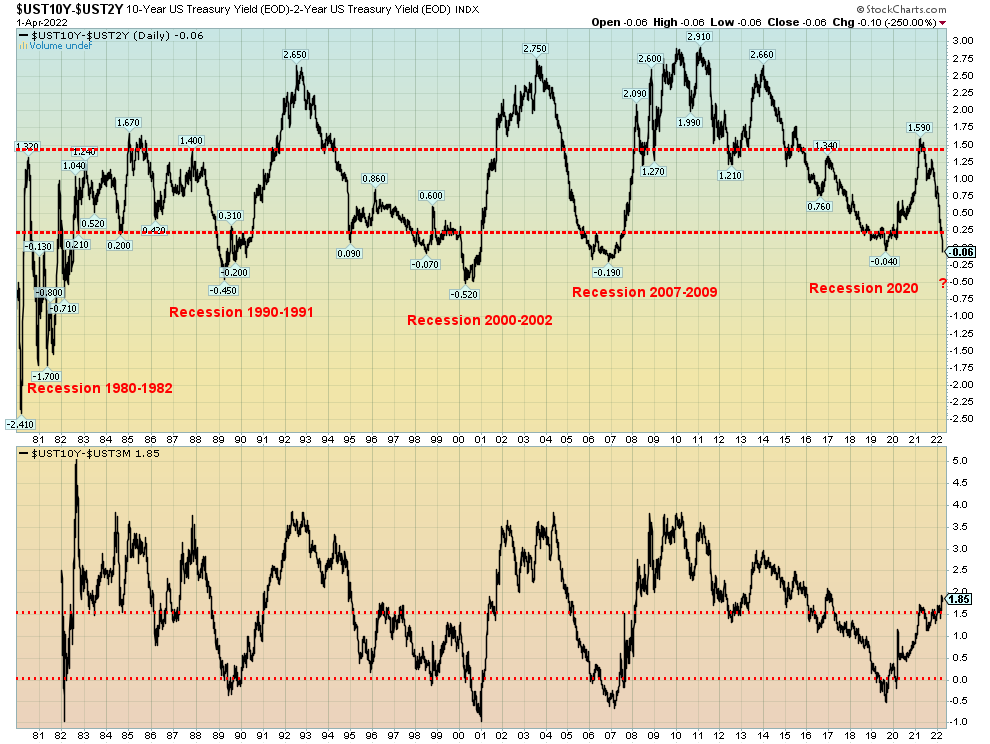
Recession warning! Recession warning! Okay, it’s only one but for the first time since late 2019 the spread between the 2-year U.S. treasury note and the U.S. 10-year treasury note has turned negative (known as the 2–10 spread). Also turning negative this past week was the 5–30 spread and the 5–10 spread. An inverted yield curve has been a consistent sign of a possible recession over the past forty years. However, we also show the 3month-10 spread and at 1.85% it is nowhere near turning negative. There are many who put more faith in the
3M-10 spread than the 2–10 spread. As we can see, we need to see the 3M–10 spread turn negative to give us more confidence that a recession could be coming. If the Fed hikes interest rates 50 bp in May as many expect, that could get things going towards an inverted 3M–10 spread. Until that happens the 2–10 spread inverting may just be an early warning sign. A recession remains potentially months away.
Source: www.stockcharts.com
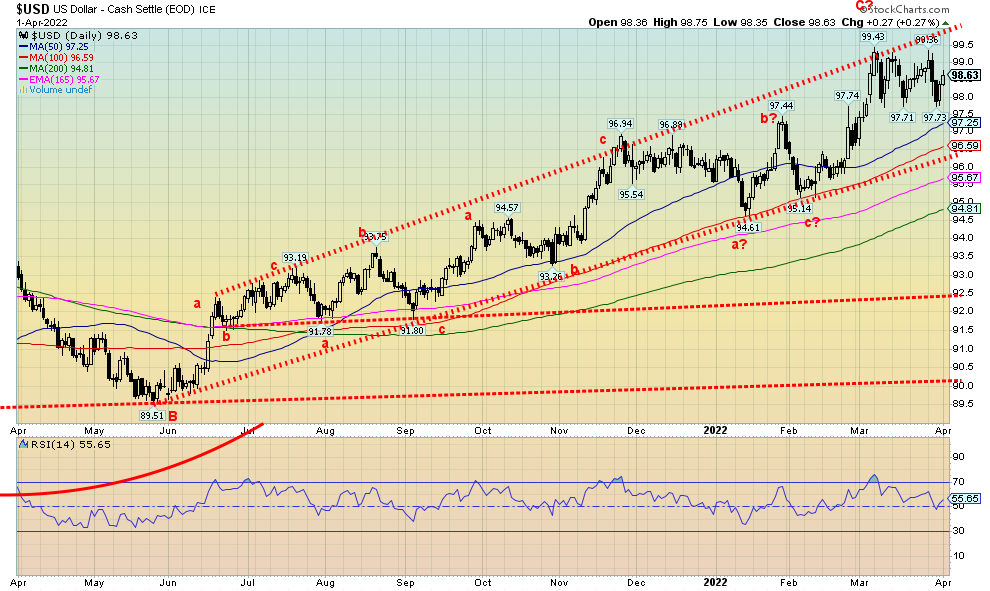
The jobs report, coupled with thoughts of a higher interest rates, helped propel the US$ Index back up this past week after it sold off earlier in the week. Odd how the selloff got underway on Tuesday as the world slowly learned of Russia’s demand to pay for its energy (oil and gas) in rubles rather than U.S. dollars or euros. That sparked the initial selloff, but the job numbers helped to slow the decline and the US$ Index bounced back. A strong number from the Chicago Purchasing Managers report (PMI) plus the strong GDP growth in Q4 also helped the US$ Index. Still, the US$ Index ended the week down 0.2%. The euro was a beneficiary, up 0.6% on the week while the Swiss franc gained 0.6% as well. The pound sterling didn’t fare as well, down about 0.6% while the Japanese yen continued its recent losing ways, off 0.3% although it did bounce back from fresh 52-week lows. The Canadian dollar lost some shine with oil prices falling, as it was down 0.3% on the week.
The US$ Index has what may be a double top on the charts at 99.43 and again at 99.36. The neckline is around the recent lows of 97.71/97.73. A breakdown under 97.70 could suggest that the US$ Index could fall to around 96. A decline to that level could break the uptrend line from the low of 89.51 seen last May 2021.
Support below would be down to 94.80/95.00. New highs above 99.43 would end this scenario and the US$ Index would test higher to 100 or even higher. The pattern appears negative, but until it breaks under 97.70 some caution is warranted.
Source: www.stockcharts.com
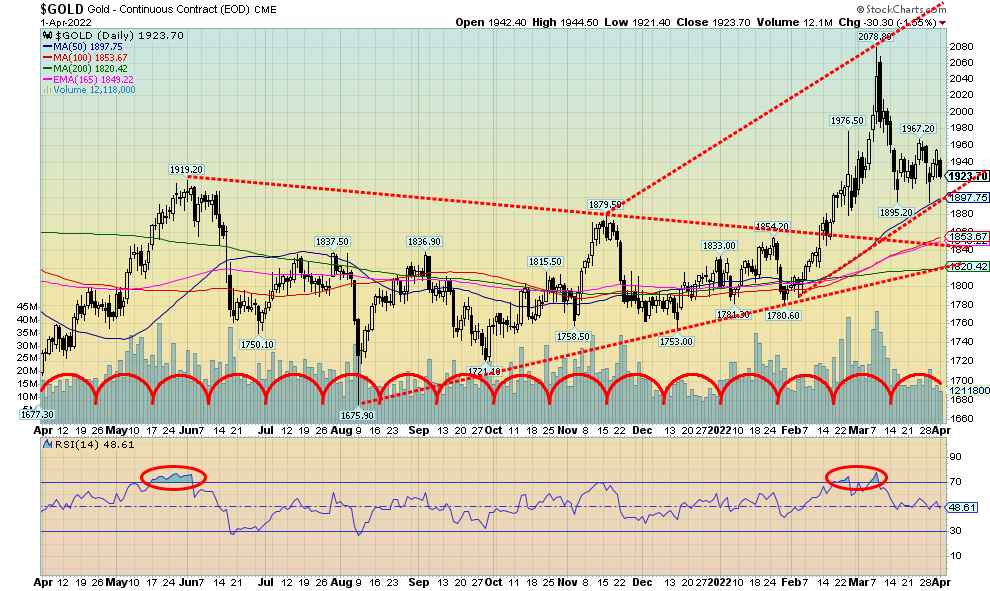
Gold spiked lower earlier in the week but rebounded following news of Russia asking for payment for its oil and gas in rubles and effectively backing the ruble with gold by announcing they’ll purchase gold at 5,000 rubles per gram. That more or less puts a floor on the gold price. All of this is being prompted by the U.S.’s attempt to freeze Russian gold. That the U.S. is trying to freeze Russia’s gold along with the freeze on Russia’s other currency reserves is, we believe, an admission that gold is money and is money with no liability. The establishment of buying gold at 5,000 rubles/gram is effectively a gold standard. At 5,000 rubles/gram, that works out to around $1,940/ounce with U.S.$1 = 80 rubles. Russia has also indicated gold would be acceptable as payment as well. Russia also removed a value-added tax (VAT) from domestic gold sales to encourage purchase of gold rather than foreign currencies. All of these moves helped recently to strengthen the ruble against the U.S. dollar. Russia’s moves, however, are an attack on U.S. dollar supremacy as the world’s reserve currency.
Gold fell this past week 1.6% with most of the loss on Friday following the jobs report and the subsequent strengthening of the U.S. dollar. Gold’s loss on Friday was effectively the week in a nutshell. The strong job numbers helped bolster the thoughts the Fed will raise interest rates more aggressively, starting with the May
FOMC where some expect at least a 50 bp hike. Silver lost 3.8%, platinum continued its recent losing streak, off about 2.0%, and palladium also fell again, down 5.3%. Copper didn’t escape, down a small 0.2%.
Thoughts of higher interest rates weighed on gold this past week especially after the jobs report. Higher interest rates make carrying gold more expensive. We believe that the positives outweigh the negative for gold to move higher. As we noted, we are now seeing early signs of a potential recession. Second inflation continues to rampage and if growth slows, we have the perfect conditions for stagflation. Gold would thrive in a stagflationary environment as it did during the 1970s. Not that this is new but the recent maneuvers by Russia to strengthen the ruble are another shot across the bow in a currency war that has now been ongoing for the past several years. Finally, with the real Russia/Ukraine conflict being a U.S./Russia conflict, there remains in the background the threat of nuclear war, albeit that’s slim at this point in time. Wars need commodities and commodity prices have been rising sharply. Gold is an asset that can be held outside the banking system unlike stocks and bonds. And unlike paper money, it doesn’t burn, either. 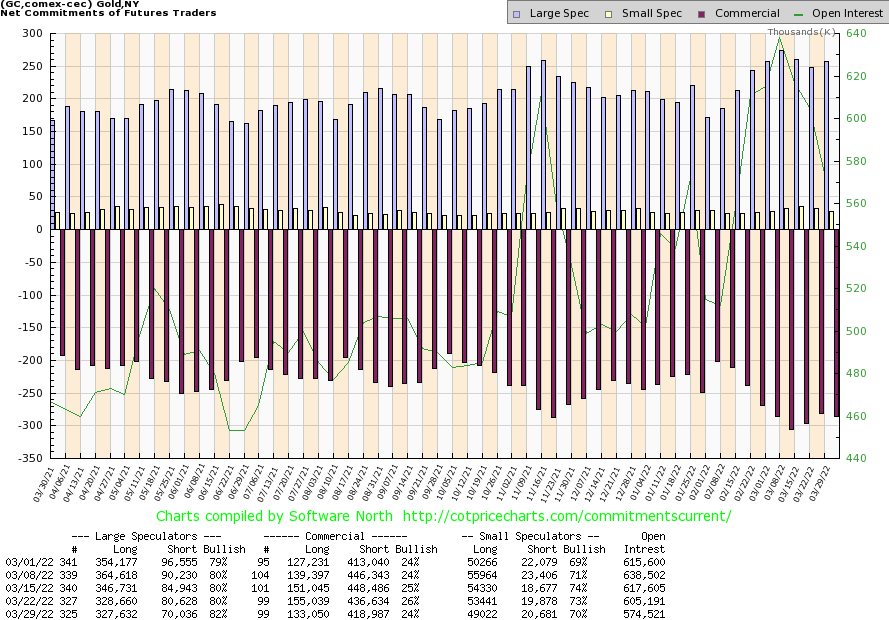
Source: www.cotpricecharts.com
The gold commercial COT (bullion companies and banks) slipped to 24% this past week from 26%. Long open interest fell about 22,000 contracts while short open interest was also down off about 18,000 contracts. The large speculators COT (hedge funds, managed futures, etc.) rose to 82% from 80% as they were relatively flat on longs but reduced their short position by over 10,000 contracts. Overall open interest fell almost 31,000 contracts on a down week, suggesting short covering. This report is decidedly mixed and gives us little in the way of clues as to the next move. We’d like to see the commercial COT at least around 30% to suggest a move to higher prices.
Source: www.stockcharts.com
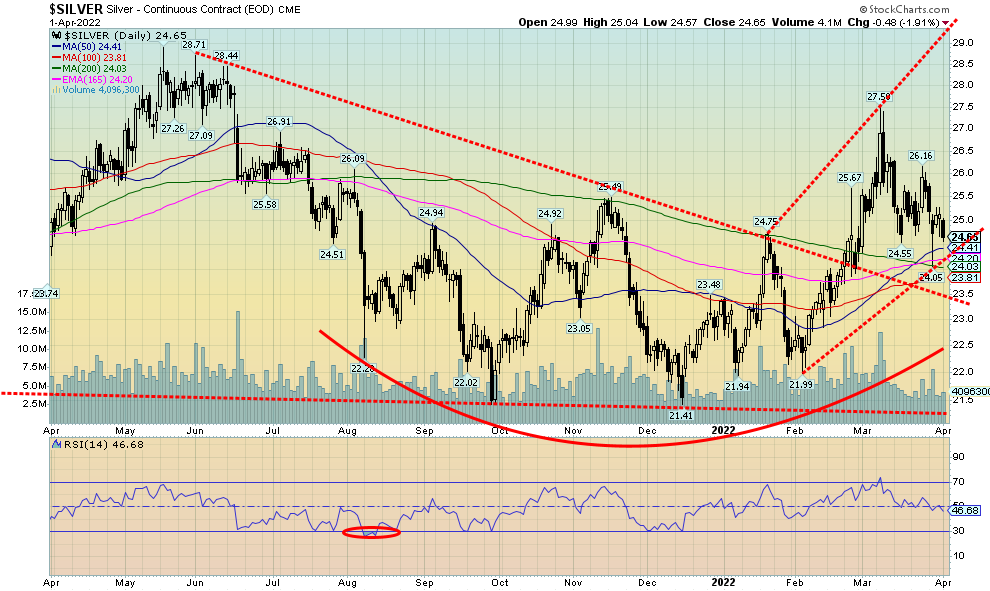
Silver fell 3.8% this past week. As with gold, silver was propelled lower following the U.S. job numbers and a rising US$ Index. Silver did spike lower earlier in the week on March 29 but that was the day of the reversal when buying came right back in and silver closed only marginally lower on the day at $24.74, off the low of $24.05. It was important that silver hold above $24 as that was where the uptrend line came in from the $21.99 low of February 3. The silver uptrend remains intact. The breakdown level this coming week is seen at $24.20 with further support down to around $23.80. But a break of $23.50 would be dangerous and under $23.30 new lows could lie ahead. To the upside, silver needs to break above $26 to suggest higher prices. Above $26.70, new highs above $27.50 could be seen. Is silver in short supply as some claim? We haven’t heard of any huge short position on the futures exchanges as what happened to nickel. Our expectation is that silver should hold its uptrend line and once we clear $26.50, we could start moving substantially higher. Above $28.25 silver could see new highs above the February 2021 high of $30.35. 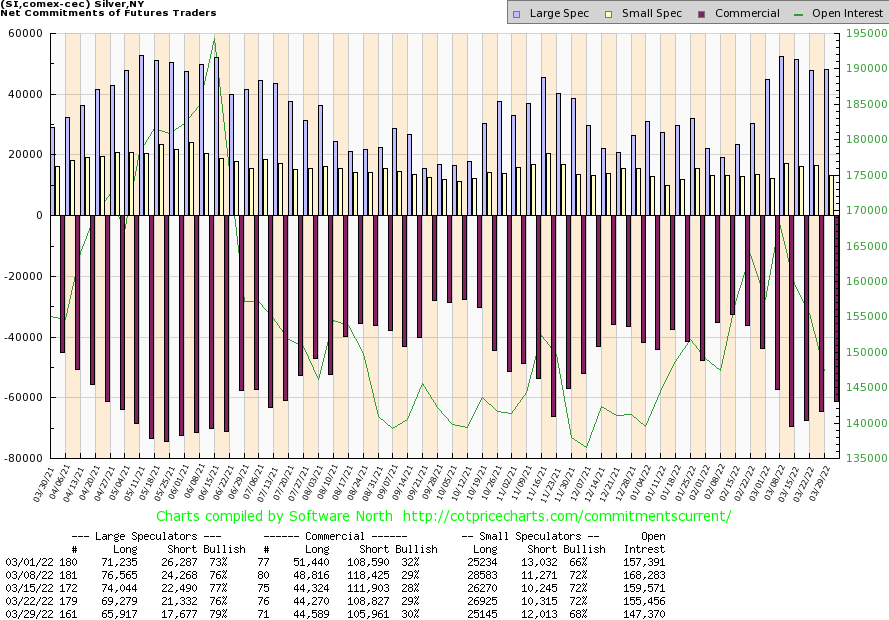
Source: www.cotpricecharts.com
The silver commercial COT rose to 30% this past week. Long open interest was relatively flat but short open interest fell about 3,000 contracts, suggesting that the week saw short covering. The large speculators COT rose to 79% as they saw both long and short positions fall. Longs fell over 3,000 contracts while shorts were down almost 4,000 contracts. On the week, open interest fell about 8,000 contracts, suggesting that the week was all about short covering during a down week. We view this as at least mildly positive.
Source: www.stockcharts.com
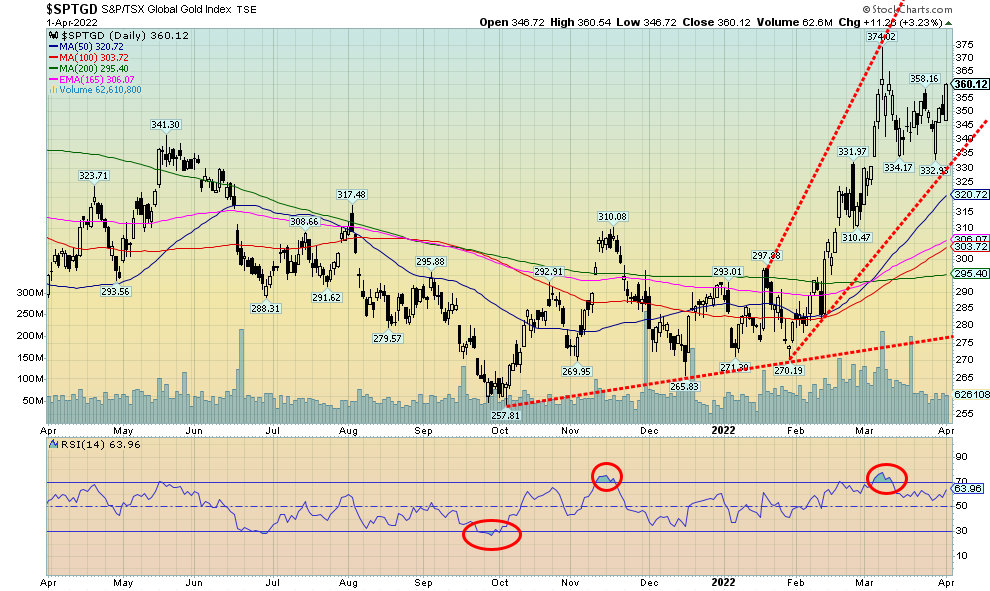
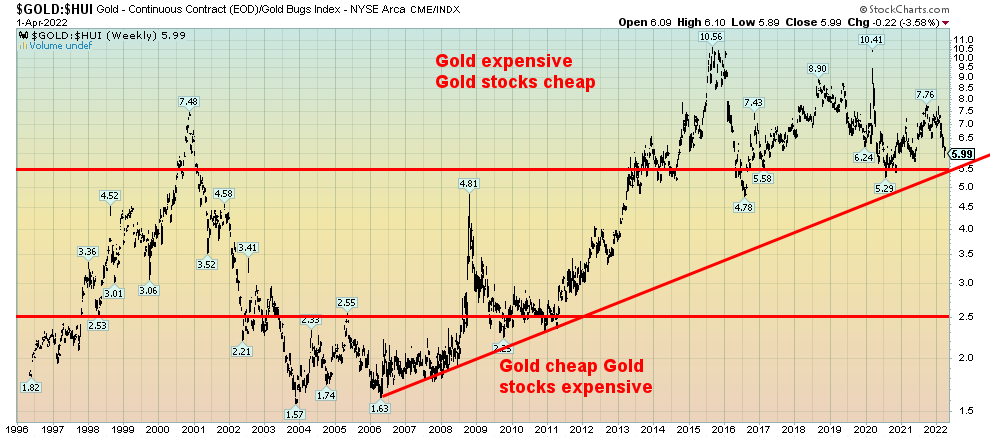
Are the gold stocks leading the way? This past week, even as both gold and silver fell on the week, the gold stocks put in a positive week. The Gold Bugs Index (HUI) jumped 2.1% while the TSX Gold Index (TGD) was up almost 3.0%. The big up day was on Friday when the TGD gained 3.2% and the HUI jumped 3.1%. Meanwhile, gold fell 1.6% and silver was down 3.8%. So why the big difference? Our suspicion is that the gold stocks are anticipating upward pressure on gold prices following the announcement that Russia wants payment for its oil and gas in rubles and backing the ruble at 5,000 rubles per gram of gold. The anticipation is that this will eventually be very good for gold and ultimately the gold stocks. As we noted, the decline in gold and silver on Friday may have been a takedown to get some players in at lower prices. The gold stocks didn’t have to wait for that moment and leaped instead on Friday. The recent drawdown to a low near 332 for the TGD held the up-trend line from the early February low of 270. The TGD appears to be forming a funnel, meaning the channel is widening as it goes higher. Funnels are quite bullish normally. The current breakdown point is around 330, but the pattern suggests we could move higher and eventually see new highs. The TGD is not yet overbought and the Gold Miners Bullish Percent Index (BPGDM) is currently at 79.31 so it has room to move higher. Other indicators support that as well. Follow-through to the upside this coming week will help solidify the up move. For the record, the August 2020 high was at 417 and the all-time high seen in 2011 was at 455. Given current levels of 360, we still have room to move higher. The Gold/HUI ratio is at 5.99, implying that gold stocks remain cheap vs. gold. If the gold stocks were expensive vs. gold, the ratio would be at 2.5.
Gold/HUI Ratio 1996–2022
Source: www.stockcharts.com
Source: www.stockcharts.com
Was it the nuclear option? Faced with rising complaints against the high cost of gasoline at the pump, the Biden administration took the unprecedented decision to release some 180 million barrels of oil from the U.S.’s strategic reserves (SPR) over the next six months—the equivalent to one million barrels a day. As a result, oil prices plunged the most in two years as WTI oil fell 12.8% this past week.
To put that in perspective, we note that in 2021 the U.S. imported some 405,000 bpd from Russia. This release more than doubles that loss. The U.S. is the world’s largest consumer of oil, consuming some 19.7 million bpd. The U.S. also imports roughly 8–9 million bpd, including a million bpd from OPEC countries. On March 28,
2022, the U.S. paid on average $4.63/US gallon for gasoline. The highest in the world is Hong Kong at $10.90/US gallon while the global average is $5.07/US gallon. Canada paid the equivalent of $5.90/US gallon.
Meanwhile, U.S. crude oil stocks are declining at a rapid pace, well below their 5-year average, last at about 410 million barrels. This release will run those stocks down even further and eventually they will have to be replaced. The result is, this is nothing more than a short-term fix and may actually accomplish little.
OPEC met this past week and refused to up their production increases of an additional 432,000 bpd in May. This was designed to stay in alignment with Russia. Russian oil faces more headwinds, given the Russian request to pay for their oil and gas in rubles, although euros deposited with Russia’s Gazprombank are acceptable. Gazprombank would then convert the euros to rubles. Meanwhile, India is in the process of paying Russia for its energy in rubles/rupees. It has quickly drawn the ire of the U.S. that could result in U.S. sanctions. It also sends a message to other countries that they will be restricted if they do business with Russia. Saudi Arabia and China are looking at China paying for its oil from Saudi Arabia in yuan. All of these moves are attacks against the U.S. dollar that has been the prime currency of payment for all commodities for 50 years.
Nonetheless, it’s the Biden administration move to release 180 million barrels from the SPR that has the market abuzz, but, as many observers point out, it is also a sign of how desperate things have become.
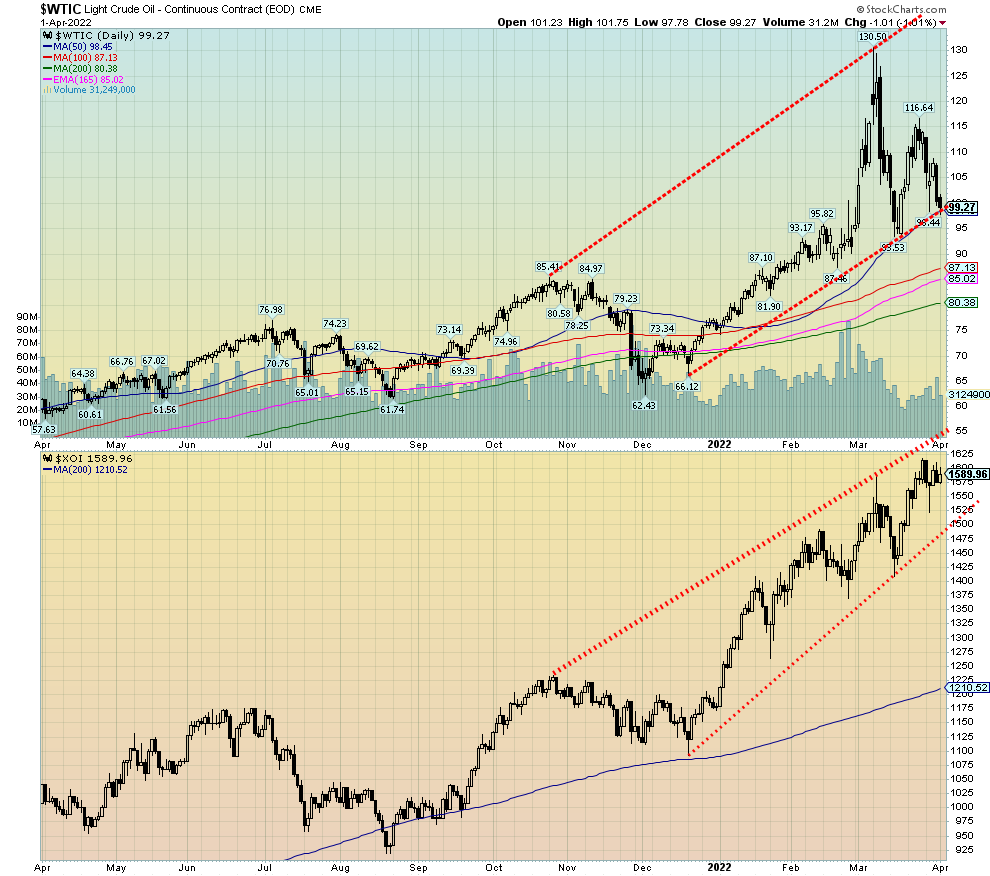
Despite the fall for WTI oil and Brent (down 10.8% this past week), natural gas (NG) rose almost 2.0%. The energy indices were off but not by a lot. The ARCA Oil & Gas Index (XOI) fell 1.5% this past week while the TSX Energy Index (TEN) was down 1.3%. Both remain up strong on the year with the XOI up about 35% and the TEN up 38.5%. WTI oil has fallen to the bottom of the channel up from the December 2021 lows. Could WTI oil break down under the channel and break under the March low of $93.53? It could and that would raise the potential for a real washout for oil as it could then fall to swing targets down to around $70. That’d be a big relief at the pumps.
But there is a difference between could it happen and will it happen. Yes, it could happen. Even a fall to the 200-day MA near $80 is a possibility as well. But will it? That’s a more difficult question as it could only take some further deterioration in the ongoing Ukraine war or the EU refusing to bend to the Russian request to pay in rubles (euros, then Gazprombank converts to rubles) and Russia follows through on their threat to cut them off. There are insufficient global supplies to replace all the oil and gas the EU would lose if Russia cut them off. And Russia does not have immediate outlets to sell its oil and gas elsewhere. Both would suffer, with the EU falling into a recession and Russia’s economic woes deepening further. The question then becomes who could absorb the hit better.
The oil stocks are holding up relatively well. They also remain relatively cheap vs. oil towards the upper range of the WTI Oil/XOI ratio over the past 40+ years. Oil stocks were relatively expensive vs. oil back in 1998 and again in 2015/2016. Oil was expensive vs. the energy stocks during the 1980s and again in 2002 and 2008.
Copyright David Chapman, 2022
|
GLOSSARY Trends Daily – Short-term trend (For swing traders) Weekly – Intermediate-term trend (For long-term trend followers) Monthly – Long-term secular trend (For long-term trend followers) Up – The trend is up. Down – The trend is down Neutral – Indicators are mostly neutral. A trend change might be in the offing. Weak – The trend is still up or down but it is weakening. It is also a sign that the trend might change. Topping – Indicators are suggesting that while the trend remains up there are considerable signs that suggest that the market is topping. Bottoming – Indicators are suggesting that while the trend is down there are considerable signs that suggest that the market is bottoming. |
Disclaimer
David Chapman is not a registered advisory service and is not an exempt market dealer (EMD) nor a licensed financial advisor. He does not and cannot give individualised market advice. David Chapman has worked in the financial industry for over 40 years including large financial corporations, banks, and investment dealers. The information in this newsletter is intended only for informational and educational purposes. It should not be construed as an offer, a solicitation of an offer or sale of any security. Every effort is made to provide accurate and complete information. However, we cannot guarantee that there will be no errors. We make no claims, promises or guarantees about the accuracy, completeness, or adequacy of the contents of this commentary and expressly disclaim liability for errors and omissions in the contents of this commentary. David Chapman will always use his best efforts to ensure the accuracy and timeliness of all information. The reader assumes all risk when trading in securities and David Chapman advises consulting a licensed professional financial advisor or portfolio manager such as Enriched Investing Incorporated before proceeding with any trade or idea presented in this newsletter. David Chapman may own shares in companies mentioned in this newsletter. Before making an investment, prospective investors should review each security’s offering documents which summarize the objectives, fees, expenses and associated risks. David Chapman shares his ideas and opinions for informational and educational purposes only and expects the reader to perform due diligence before considering a position in any security. That includes consulting with your own licensed professional financial advisor such as Enriched Investing Incorporated. Performance is not guaranteed, values change frequently, and past performance may not be repeated.
About the author


Website: https://www.enrichedinvesting.com
Disclaimer: David Chapman is not a registered advisory service and is not an exempt market dealer (EMD) nor a licensed financial advisor. We do not and cannot give individualised market advice. David Chapman has worked in the financial industry for over 40 years including large financial corporations, banks, and investment dealers. The information in this newsletter is intended only for informational and educational purposes. It should not be considered a solicitation of an offer or sale of any security. The reader assumes all risk when trading in securities and David Chapman advises consulting a licensed professional financial advisor before proceeding with any trade or idea presented in this newsletter. David Chapman may own shares in companies mentioned in this newsletter. We share our ideas and opinions for informational and educational purposes only and expect the reader to perform due diligence before considering a position in any security. That includes consulting with your own licensed professional financial advisor.