Jobs up, jobless up, political tariffs, interest soars, normal highs, Bitcoin frenzy, weak gold, struggling energy
Next week we will provide our annual forecast. 2025 promises to be a volatile year with many unknowns. Then we will be off through Christmas/New Years.
The big news of the week was the November jobs report. The jobs report for both the U.S. and Canada is featured as our chart of the week (page 8). We even added a bonus chart of the week (page 11) with the Michigan Sentiment Index that had some interesting stats to report.
This week is a bit of this and that. We look at the US money supply, the soaring U.S. dollar, the surge of funds into money market, and the sinking bond market even as it has come back to life a bit of late. Finally we note how U.S. interest payments on the debt have soared past defense spending.
New highs in markets have, it seems, become normal. But we note a few interesting things from this past week's surge to once again all-time highs. We also couldn't ignore Bitcoin that soared past $100,000 sending that market into a frenzy. Gold and oil are still struggling as they were the weakest groups this past week. Will it last? Or will the broader market and the commodities trade places? The strong gold market, for example, has resulted in record high cash flow, record revenues and record adjusted EBITDA for Lundin Gold Inc., a gold mine producer and explorer that pays a dividend and is held in the Enriched Capital Conservative Growth Strategy.*
We have snow. Maybe we'll have a White Christmas after all. Have a great week!
DC
* Reference to the Enriched Capital Conservative Growth Strategy and its investments, celebrating a 6-year history of strong growth, is added by Margaret Samuel, President, CEO and Portfolio Manager of Enriched Investing Incorporated, who can be reached at 416-203-3028 or msamuel@enrichedinvesting.com
"Capital, like water, goes where it encounters the least resistance".
—Martin Armstrong, self-taught economist, convicted felon, served 11 years in jail for defrauding investors of $700 million, hiding $15 million in assets, author of the Economic Confidence Model, also The Forecaster, www.armstrongeconomics.com; b. 1949
"It is a sobering fact that the prominence of central banks in this century has coincided with a general tendency towards more inflation, not less. [I]f the overriding objective is price stability, we did better with the nineteenth-century gold standard and passive central banks, with currency boards, or even with 'free banking.' The truly unique power of a central bank, after all, is the power to create money, and ultimately the power to create is the power to destroy."
—Paul Volcker, American economist, 12th Chairman of the Federal Reserve 1979–1987, President of the Federal Reserve Bank 1975–1979, Chair of President’s Economic Recovery Board 2009–2011; 1927–2019
“It takes a man a long time to learn all the lessons of all his mistakes. They say there are two sides to everything. But there is only one side to the stock market; and it is not the bull side or the bear side, but the right side. It took me longer to get that general principle fixed firmly in my mind”
—Edwin Lefèvre, American journalist, writer, diplomat, long on Wall Street, famous for book Reminiscences of a Stock Operator, based on a series of articles in The Saturday Evening Post (1922–1923); 1871–1943
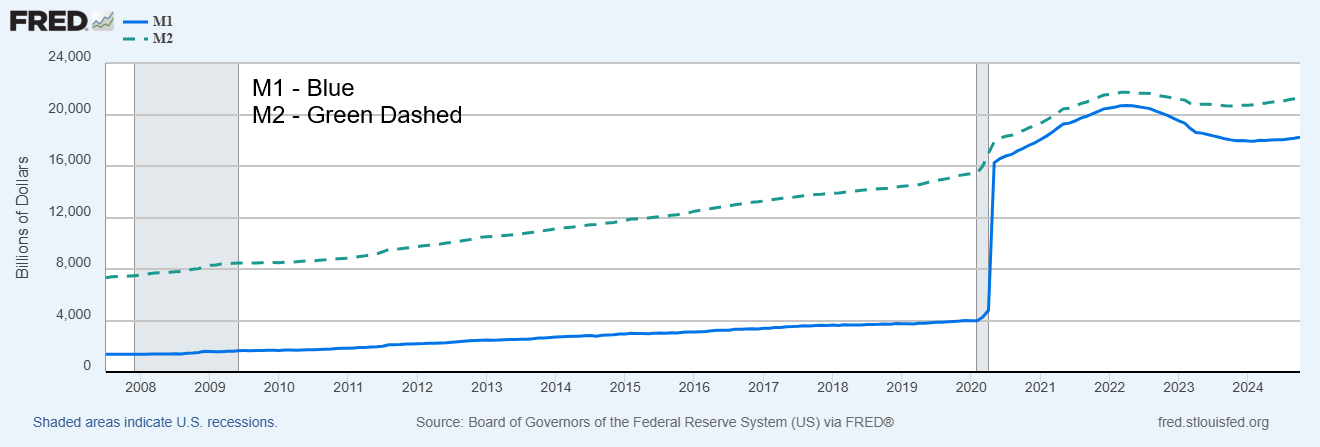
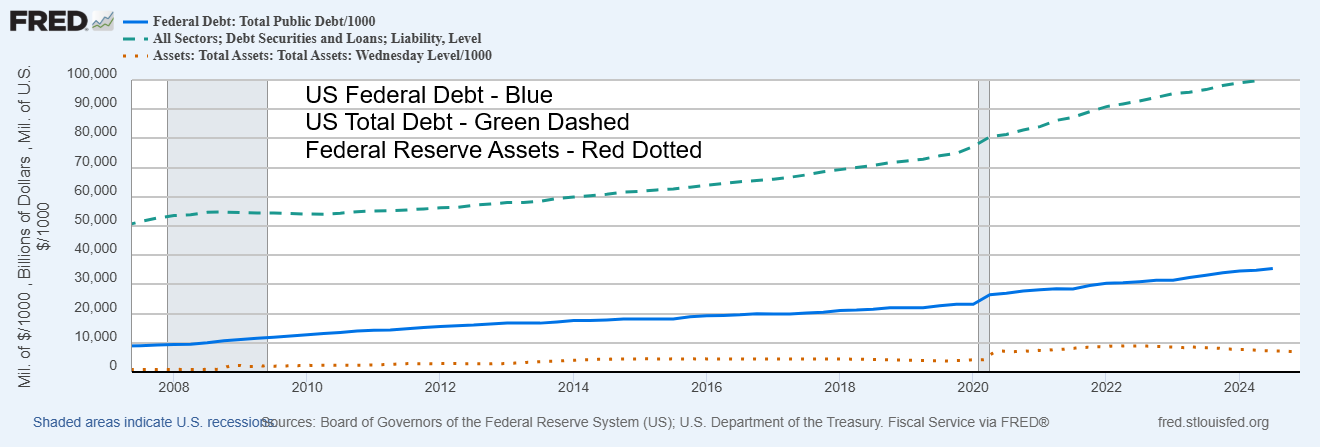
One thing that has caught our attention is that money and the Fed’s balance sheet exploded after the outbreak of the pandemic in 2020. The reason – massive quantitative easing QE. Whether quantitative easing was the right move to make at the time is debatable; however, many politicians and monetary authorities thought if they did nothing, the world could be plunged into an economic depression. The huge outpouring of money had the desired effect, but it also set off bubbles in the stock market, crypto, housing, and more that are still with us today. It also helped to unleash a run-up in inflation, forcing monetary authorities everywhere to tighten by raising interest rates. The huge volume of money unleashed was not the only reason for a surge in inflation as the pandemic sparked supply disruptions. Then the Russia/Ukraine war broke out in February 2022. War by its very nature is inflationary and oil prices surged to near-record highs.
U.S. money supply surged with M1 up an astounding $16.7 trillion or 417% from January 2020 to a peak in April 2022. Similarly, M2 also surged but at a much slower rate, up $6.4 trillion or about 42%. The Fed’s balance sheet leaped $4.8 trillion or 215%. Money was sloshing around everywhere. Federal debt also surged, up $12.3 trillion or 33%. All that contributed to what is so far a 120% increase for the NASDAQ and an 88% gain for the S&P 500. Gold also gained, up about 76%. But Bitcoin exploded, up a mind-boggling 1,274%. Once
interest rates started rising, bond yields rose (prices move inversely to yields). The U.S. 20-year bond (TLT) has fallen over 21% (price) during the same period.
Note: M1 and M2 money have several definitions, ranging from narrow to broad. M1 = coins and currency in circulation + checkable (demand) deposit + traveler's checks. M2 = M1 + savings deposits + money market funds + certificates of deposit + other time deposits.
U.S. Money Supply M1 and M2 2007–2024 $billions
Source: www.stlouisfed.org
U.S. Federal Debt, All Debt, Federal Reserve Assets 2007–2024 $billions
Source: www.stlouisfed.org
But a funny thing has happened on the way to Washington. M1, M2, and the Fed’s balance sheet peaked in April 2022. Since then, M1 has fallen 12% or $2.5 trillion, while M2 is down a much smaller 2% or a $421 billion. The Fed’s balance sheet has also shrunk by almost 23% or $2.0 trillion. Quantitative tightening QT? The Fed rate had gone from 0–0.25% to a recent peak at 5.5%. The Fed was trying to bring down inflation and hopefully only cause a soft landing. Inflation, after peaking at 5.6% in 2022, has since fallen to 2.6% although it now sits at 2.8%, suggesting we may be rising once again.
Nonetheless, all this has had an impact on markets. Even as the stock markets continue to soar, the U.S. and other countries are experiencing rising loan delinquencies and defaults, plus in some cases falling prices (i.e. housing). Problems are growing, particularly in the commercial real estate market. There is also a risk of sovereign debt defaults. The EU, along with the U.K., is falling into recession as the Russia/Ukraine war takes a toll, particularly as related to the formerly cheap energy supplies the EU received from Russia. Sanctions have largely ended that and the negative result was predictable. Japan is in an almost continual recession. Both the EU and Japan are also experiencing declining demographics as their populations are actually retracting and growing older. Fewer workers to support the growing cohort of seniors.
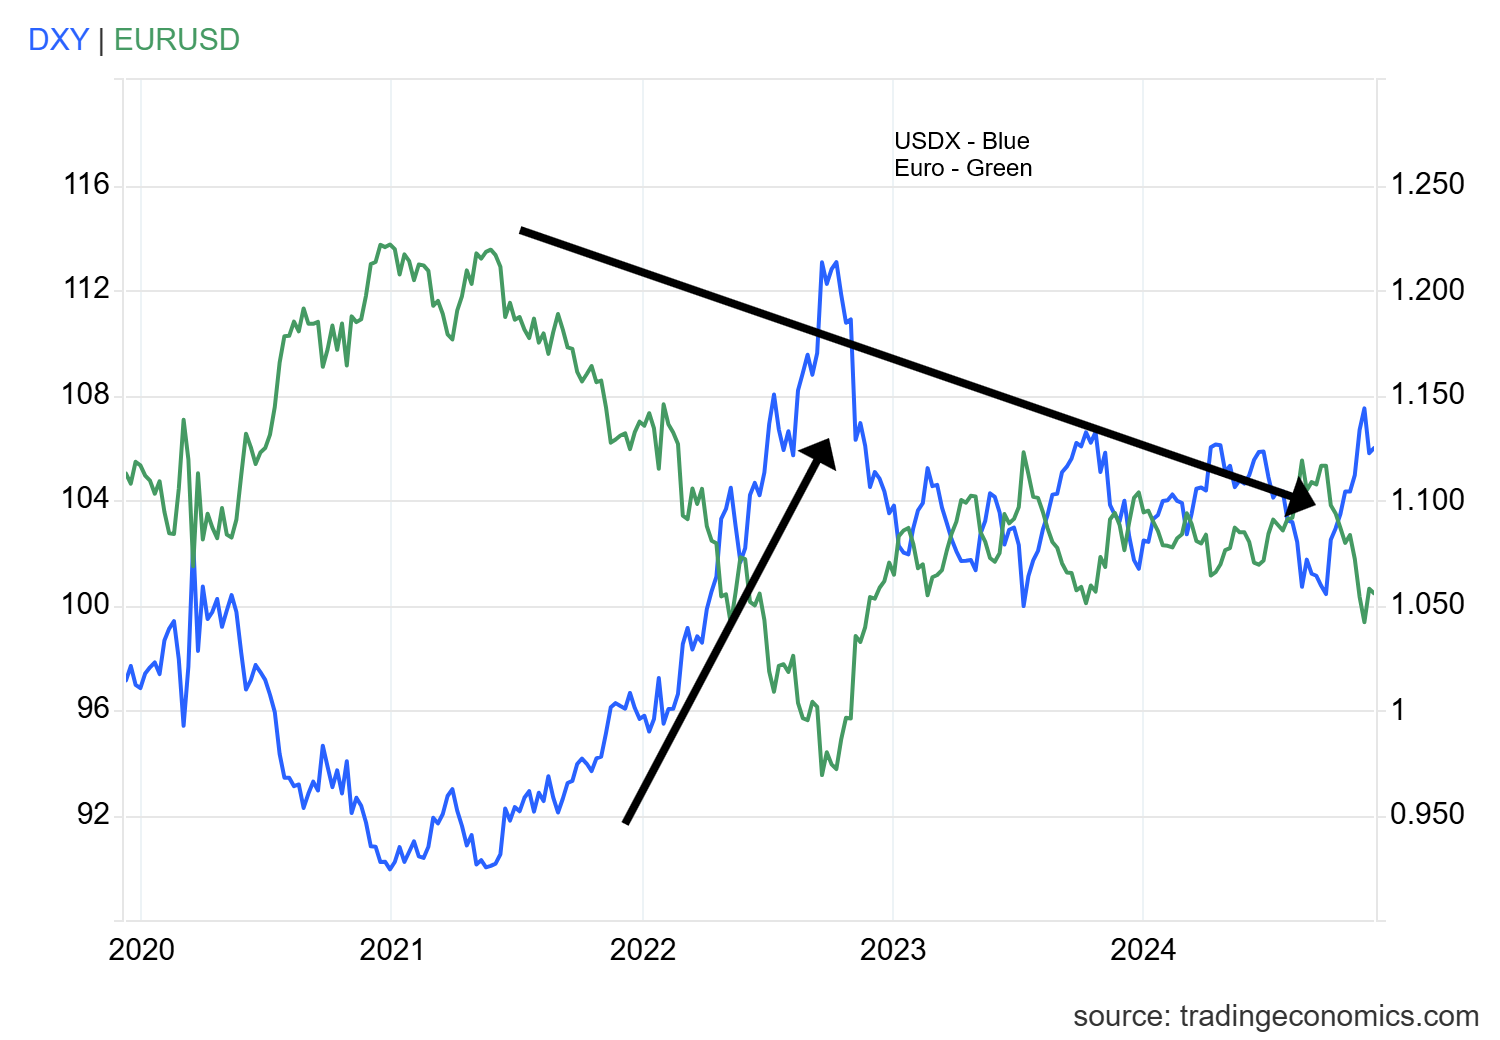
The U.S. is the world’s leading economy and, despite the ongoing problems, the U.S. has easily led the G7 in terms of economic growth. Everybody else is a distant second or worse. The U.S.’s success has meant that the U.S. dollar has soared as funds seek the higher interest rates. The U.S. maintains the highest rates in the G7. The U.S. also receives funds from other countries fleeing war or repressive governments. That translates into a strong U.S. dollar. Since January 2020, the US$ Index is up about 18% from a low in 2021, while the euro has fallen about 14%. Other currencies have also declined against the U.S. dollar.
US$ Index vs. Euro 2020–2024
Source: www.tradingeconomics.com
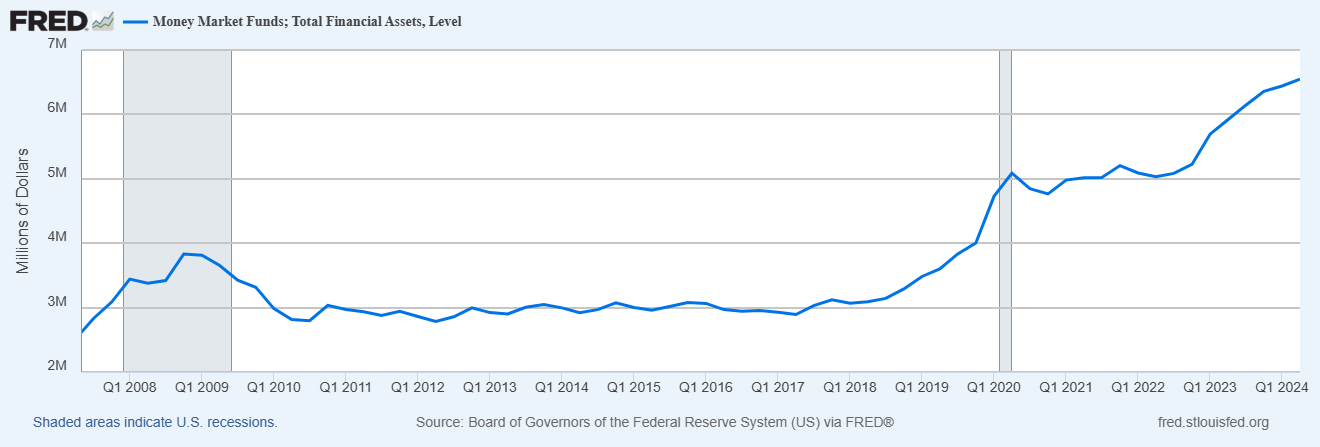
As the next chart shows, there has been a surge of funds into money market assets, particularly over the past couple of years. Is this a reflection of concern for the markets? As we have noted, Berkshire Hathaway (Warren Buffett) has raised a mind-boggling cash reserve of some $325 billion. What does Buffett know? We have also seen a surge of funds into gold ETFs as concern for global geopolitical disruption, domestic politics disruption, and loss of confidence in government grows. Gold ETFs have gone up with the record price of gold that hit $2,800, even as they have currently pulled back.
U.S. Money Market Assets 2007–2024
Source: www.stlouisfed.org
As we have noted, there has been a surge of funds into stock markets with many indices making new all-time highs. But is it sustainable? Since 2007, our chart on the next page shows that the NASDAQ, led by the FAANGs and the MAG7, has surged 717%. The S&P 500 is up a more modest 329% while gold has gained 319%. Notably, bond prices have fallen as denoted here by the U.S. 20-year treasury bond, up only 83% in the same period. Bond prices have been on a downswing since peaking 2020. But could bonds and the stock market be primed to switch places?
With rising interest rates, interest on the U.S. federal debt has now surpassed expenditures for defense. Interest on the debt now surpasses defense expenditures by some $26 billion. Interest on the debt overtook defense expenditures in Q4 2023. The balance has been widening ever since. But then the U.S. budget deficits have been growing since surpluses were recorded in the late 1990s. Our chart shows how the budget deficits have grown, now constituting some 6.3% of U.S. GDP. Note: The Economist reports it as 6.9%. Yes, there are a few countries with budget deficits over 7% of GDP, notably Brazil, Pakistan, and Israel, but in the G7 the U.S. has the highest. Notably, Canada at 1.3% has the lowest. Germany is close at 1.6%. Our chart shows how budget deficits have been growing, contributing to the huge rise in U.S. government debt.
The U.S. bond market has been falling now for 52 months. It’s the longest bond bear dating back to the 1980s. Meanwhile, the stock market has been rising since 2009 with few signs that it is stopping. Are these two markets due to switch places?
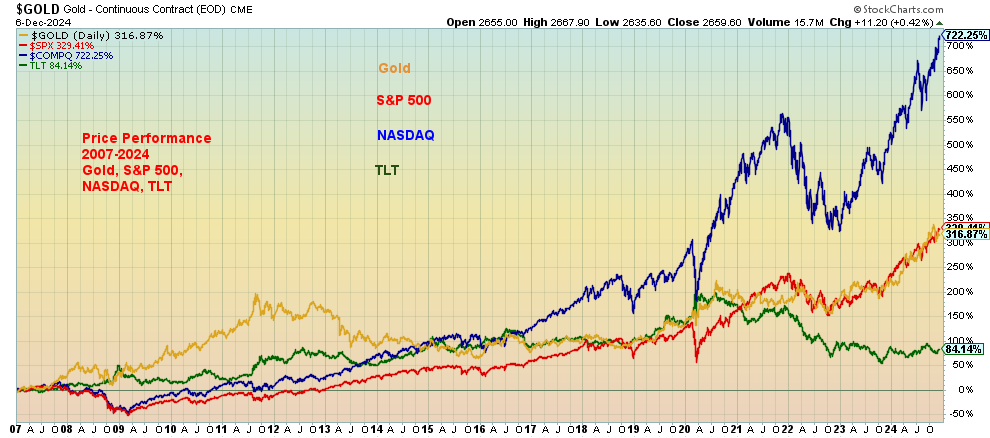
Source: www.stockcharts.com
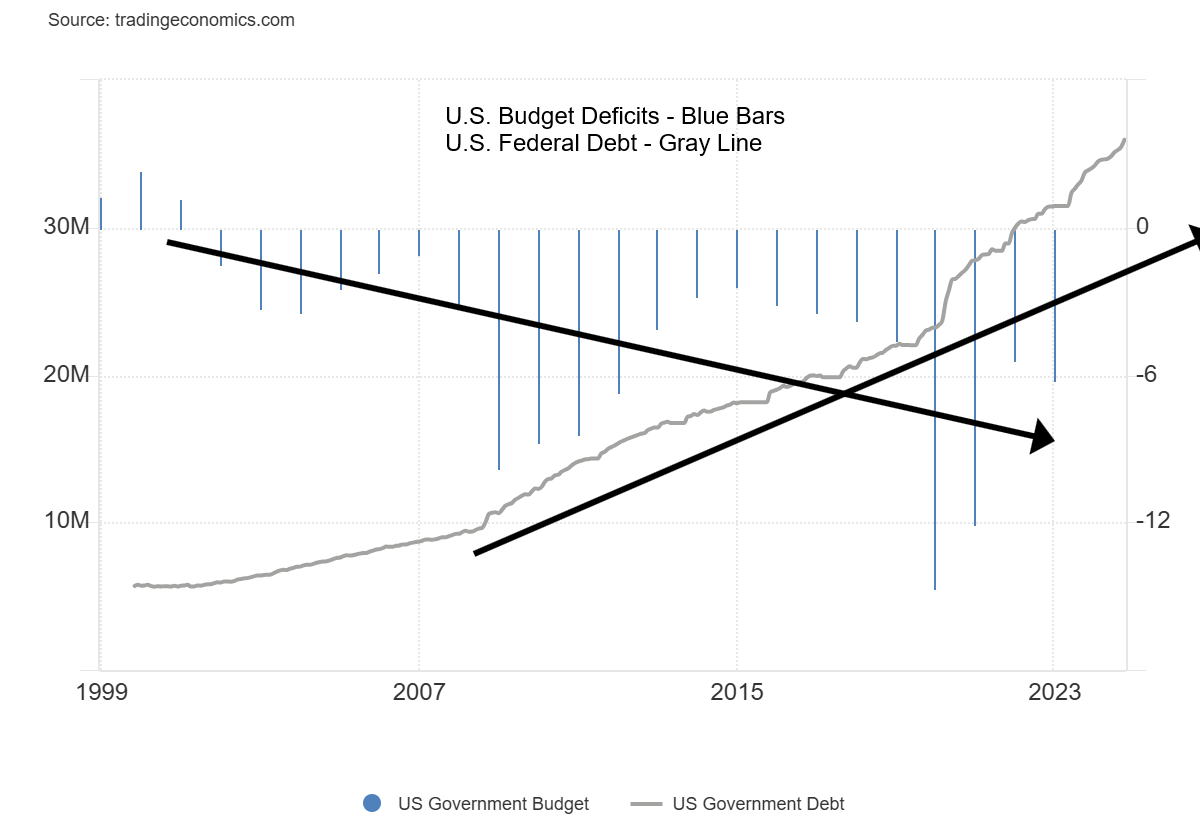
Source: www.tradingeconomics.com
U.S. Defense Spending vs. Interest on the Debt $millions
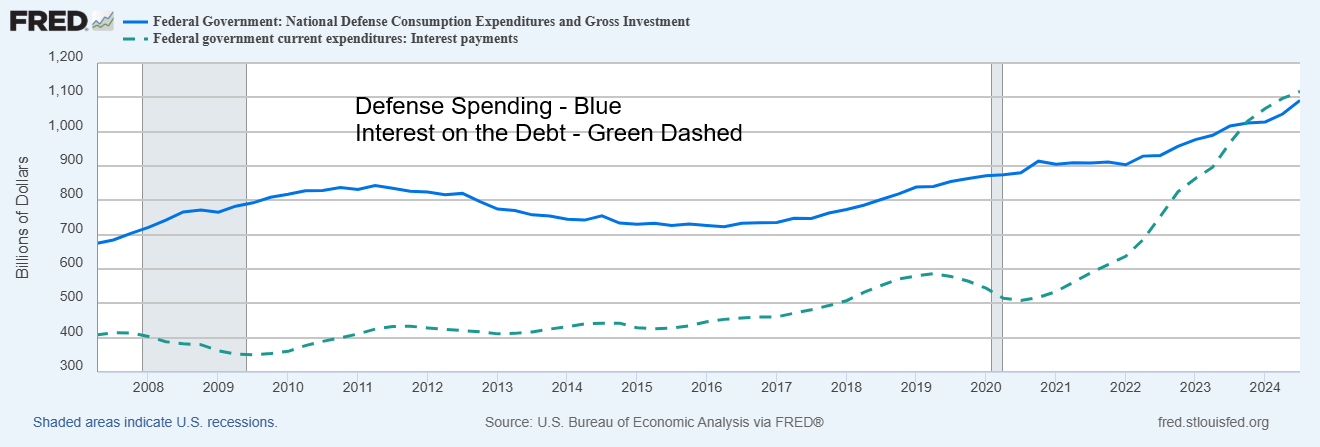
Source: www.stlouisfed.org
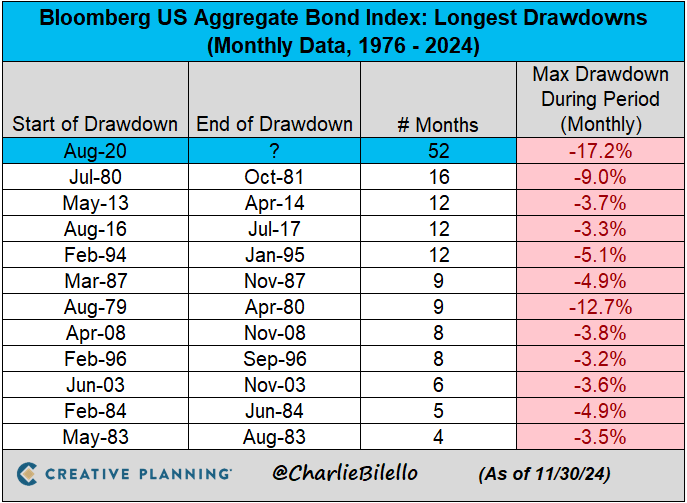
Source: www.bilello.blog @charliebilello Via Mauldin Economics www.mauldineconomics.com, www.bloomberg.com
Chart of the Week
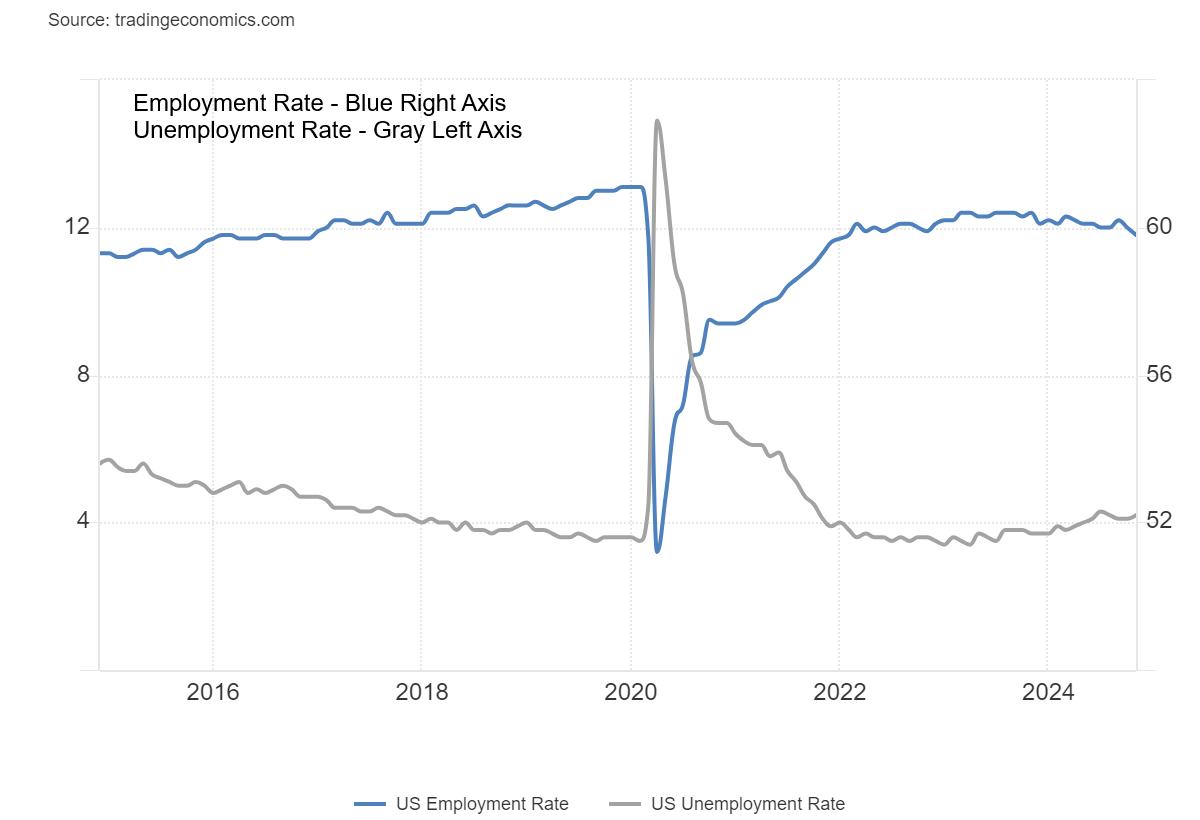
U.S. Job Numbers
Source: www.tradingeconomics.com, www.bls.gov
We suppose it wasn’t really a surprise. The U.S. nonfarm payroll for November came in at 227,000, above the expected 200,000. No surprise either that the October nonfarm payrolls was revised up to 36,000 from 12,000. The low number was strictly due to the hurricanes/storms plus strikes effect. Further revisions may be seen. Earlier it was reported that weekly initial jobless claims rose to 224,000 from 213,000 and the expected 214,000. The four-week average is 218,500.
So far, the stock market has loved it. Gold is mixed. That the unemployment rate (U3) rose to 4.2% from 4.1% helps keep a Fed cut alive at the December 17–18 FOMC. The pace has slowed as the average of the past three months is 173,000 less than in previous months. The U6 unemployment rate (plus all persons marginally attached to the labour force, plus total employed part-time for economic reasons, as a percent of the civilian labour force, plus all persons marginally attached to the labour force) rose to 7.8% from 7.7%. U6 is the highest
unemployment rate provided by the Bureau of Labour Statistics (www.bls.gov). The number of unemployed (in U3) rose by 161,000.
The nonfarm payroll number comes from the Establishment Survey. It exhibits strength. The remaining numbers come from the Household Survey and here things are not reassuring. Numbers here appear to point to growing weakness in the labour market. The civilian labour force fell by 193,000, the labour force participation rate fell to 62.5% from 62.6%, while the employment population ratio dropped to 59.8% from 60.0%. All this points to fewer people working. The number for those not in the labour force rose by an astounding 579,000. The bulk of those not in the labour force is made up of retirees (60.2 million) and the disabled (8.3 million), representing roughly almost 68% of the number not in the labour force. Others are long-term unemployed, no longer counted as being in the labour force (includes marginally attached workers, discouraged workers, those who want to work but have been unemployed a year or more, plus people who just stay at home). Others include students and caregivers.
The percentage of those working two jobs rose to 5.3% from 5.1%. The average number of weeks unemployed rose to 23.7 from 22.9, while the median number of weeks unemployed rose to 11.0 from 10.7. The number for those unemployed 27 weeks or longer rose by 35,000. Average hourly earnings were up 4% on the year, which is as expected and equals October’s numbers.
While on the surface the nonfarm payroll number was better than expected elsewhere, we see nothing but weakness. As noted, that keeps alive thoughts of a Fed cut of at least 25 bp. Some even think it will be 50 bp.
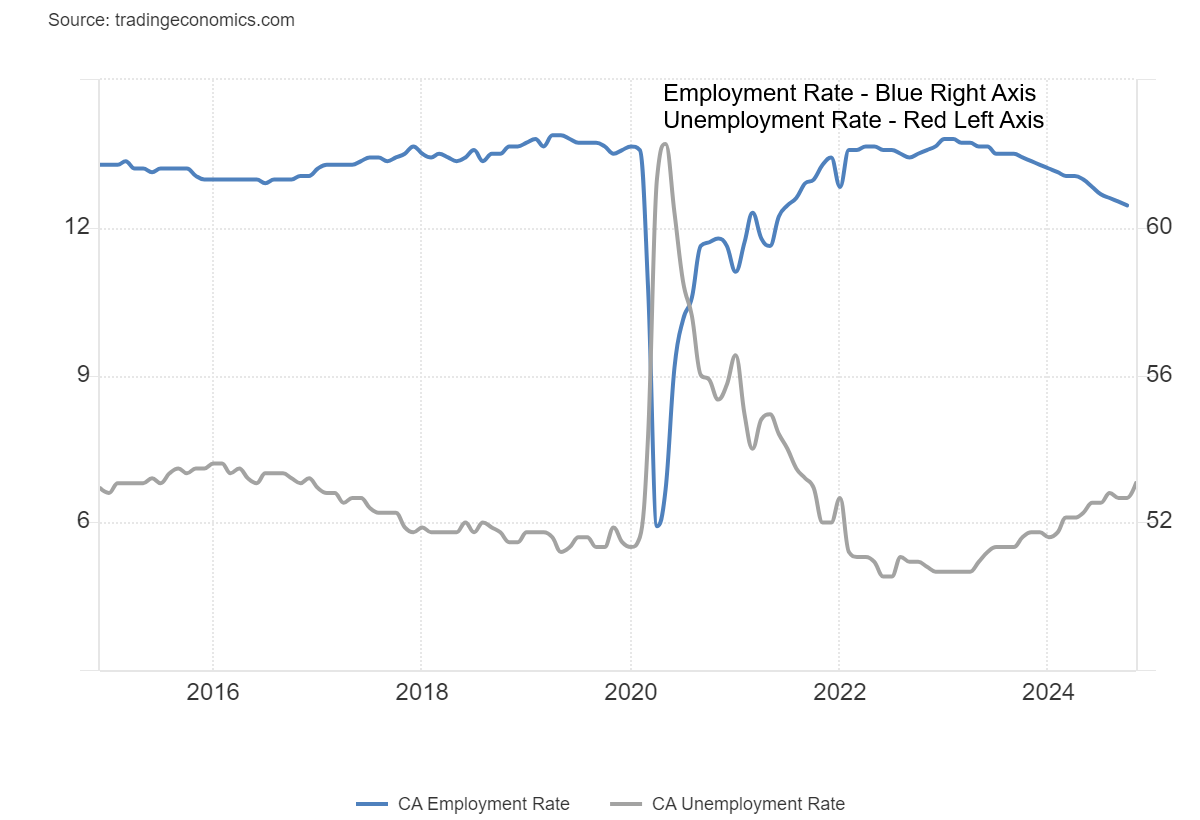
Canada Job Numbers
Source: www.tradingeconomics.com, www.statcan.gc.ca
Surprisingly, Canada added 50,500 jobs in November. They had expected only 25,000 vs. 14,500 in October. Better still, full-time employment rose 54,200 while part-time employment fell by 3,600. More people were looking for work as the labour force participation rate rose to 65.1% from 64.8%.
The unemployment rate jumped to 6.8% from 6.5% and the expected 6.6%. The unemployed population rose by 87,300. The R8 unemployment rate (discouraged workers, involuntary part-timers – highest reported by Statistics Canada) rose to 8.5% from 7.9%. When calculated similarly to the U.S., the unemployment rate was 5.7% vs. 5.2%. The weaker unemployment rates might prompt the BofC to cut rates again this coming week at its last interest rate meeting of the year on December 11. Expectations are for at least 25 bp, but some are calling for 50 bp.
A mixed report with unemployment up but the number of jobs created unexpectedly higher. So, which is it?
Bonus Chart of the Week
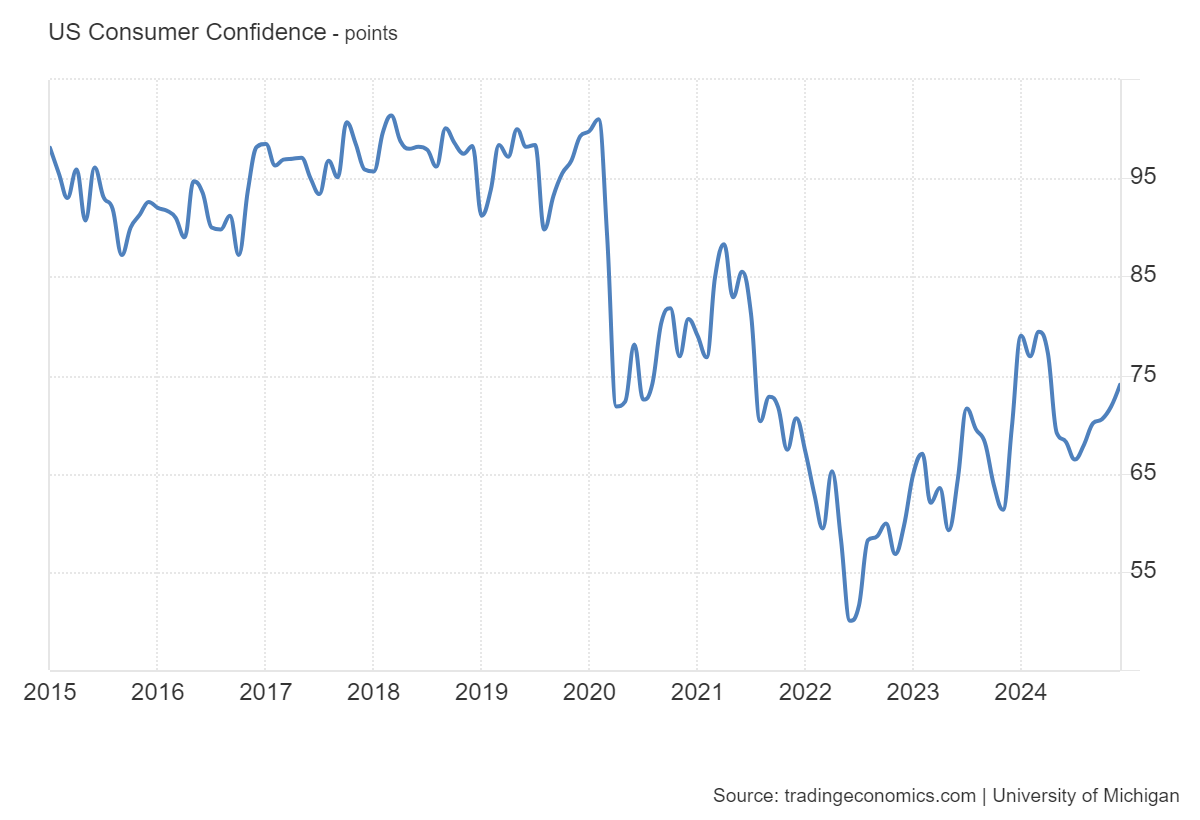
Michigan Consumer Sentiment Index 2014–2024
Source: www.tradingeconomics.com, www.umich.edu
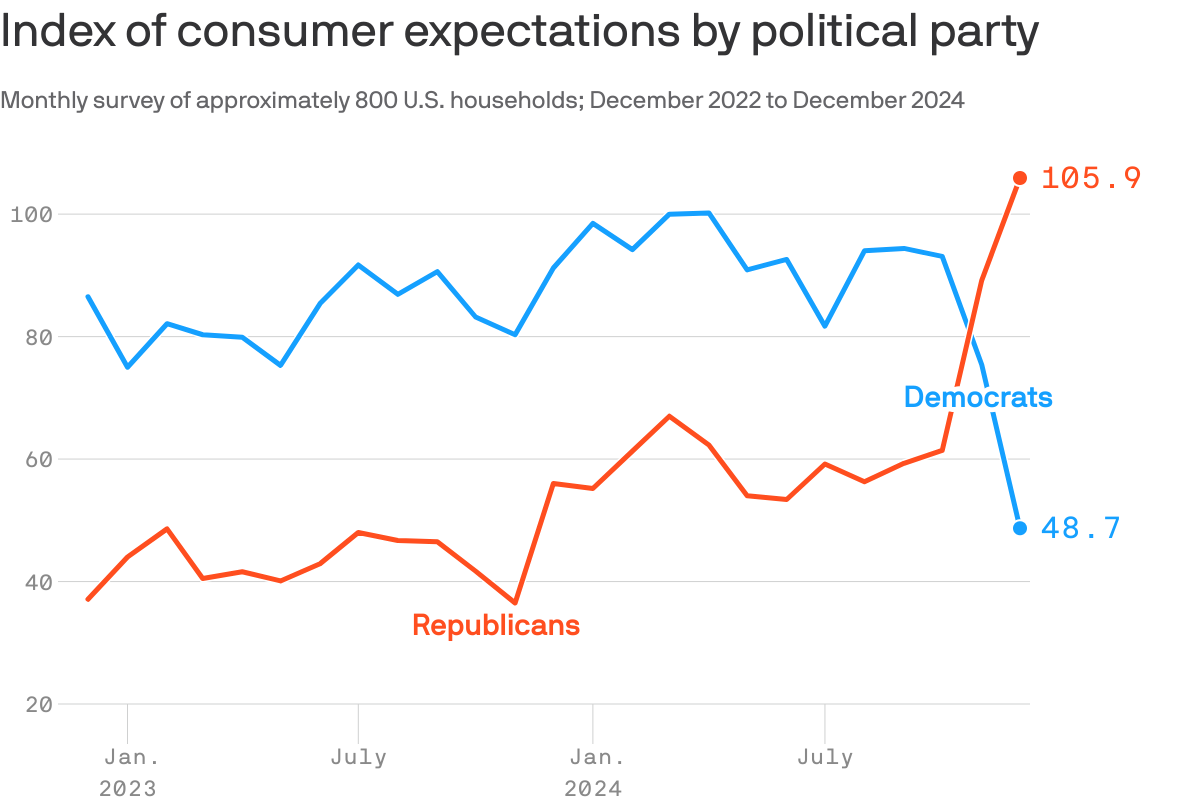
Yes, a bonus chart because there were some interesting things about this month’s Michigan Sentiment Index for December. The Michigan Sentiment Index jumped to 74 in December, the highest level since April. The market had expected 73 and last month’s was 71.8. But that wasn’t the real story. The University of Michigan also puts out sub-indices including Consumer Expectations, Inflation Expectations, and Current Conditions. Consumer Expectations plunged in December to 71.6 from 76.9 in November. It was the lowest in five months. But, as our chart on the next page shows, there was quite a split between Republicans and Democrats.
The chart comes courtesy of Axios. Naturally, the survey is from a much smaller sample size and this is for November, following the election. The result was quite telling. Sentiment under Democrats plunged to 70.9 from 91.4 while sentiment under Republicans soared to 81.6 from 53.6. In terms of future expectations, Democrats plunged to 48.7 from 93.1 while Republicans soared from 61.4 to 105.9. The last time these
numbers were in this position was 2016 when Trump was last elected. Oddly, or maybe not so oddly, Democrats see tariffs as potentially inflationary and could face retaliation. Republicans, on the other hand, are expecting lower inflation and maybe have convinced themselves the other country pays the tariffs. Well, no, they do not. The tariffs are paid in the U.S. and would raise the cost of goods, which is inflationary. Could Republicans be in for a big disappointing surprise?
The question is how to interpret this, given the introduction of politics.
Source: www.umich.edu, www.axios.com
Markets & Trends
|
|
|
|
% Gains (Losses) Trends
|
|
||||
|
|
Close Dec 31/23 |
Close Dec 6, 2024 |
Week |
YTD |
Daily (Short Term) |
Weekly (Intermediate) |
Monthly (Long Term) |
|
|
Stock Market Indices |
|
|
|
|
|
|
|
|
|
S&P 500 |
4,769.83 |
6,090.27 (new highs)* |
1.0% |
27.7% |
up |
up |
up |
|
|
Dow Jones Industrials |
37,689.54 |
44,652.42 (new highs)* |
(0.6)% |
18.5% |
up |
up |
up |
|
|
Dow Jones Transport |
15,898.85 |
16,879.40 |
(4.2)% |
6.2% |
up |
up |
up |
|
|
NASDAQ |
15,011.35 |
19,859.77 (new highs)* |
3.3% |
32.3% |
up |
up |
up |
|
|
S&P/TSX Composite |
20,958.54 |
25,691.80 (new highs)* |
0.2% |
22.6% |
up |
up |
up |
|
|
S&P/TSX Venture (CDNX) |
552.90 |
610.22 |
(0.7)% |
10.4% |
up |
up |
down (weak) |
|
|
S&P 600 (small) |
1,318.26 |
1,510.70 |
(1.4)% |
14.6% |
up |
up |
up |
|
|
MSCI World |
2,260.96 |
2,406.00 |
2.2% |
6.4% |
down |
up |
up |
|
|
Bitcoin |
41,987.29 |
101,395.37 (new highs)* |
4.1% |
141.5% |
up |
up |
up |
|
|
|
|
|
|
|
|
|
|
|
|
Gold Mining Stock Indices |
|
|
|
|
|
|
|
|
|
Gold Bugs Index (HUI) |
243.31 |
296.28 |
(1.6)% |
21.8% |
down |
up |
up |
|
|
TSX Gold Index (TGD) |
284.56 |
355.36 |
(0.8)% |
24.9% |
down |
up |
up |
|
|
|
|
|
|
|
|
|
|
|
|
% |
|
|
|
|
|
|
|
|
|
U.S. 10-Year Treasury Bond yield |
3.87% |
4.17% |
(0.2)% |
7.8% |
|
|
|
|
|
Cdn. 10-Year Bond CGB yield |
3.11% |
3.00% |
(3.5)% |
(3.5)% |
|
|
|
|
|
Recession Watch Spreads |
|
|
|
|
|
|
|
|
|
U.S. 2-year 10-year Treasury spread |
(0.38)% |
0.06% |
200.0% |
115.8% |
|
|
|
|
|
Cdn 2-year 10-year CGB spread |
(0.78)% |
0.09% |
50.0% |
111.5% |
|
|
|
|
|
|
|
|
|
|
|
|
|
|
|
Currencies |
|
|
|
|
|
|
|
|
|
US$ Index |
101.03 |
105.98 |
0.2% |
4.9% |
up |
up |
up |
|
|
Canadian $ |
75.60 |
70.65 (new lows) |
(1.1)% |
(6.6)% |
down |
down |
down |
|
|
Euro |
110.36 |
105.66 |
0.1% |
(4.3)% |
down |
down |
down |
|
|
Swiss Franc |
118.84 |
113.80 |
0.2% |
(4.2)% |
down |
neutral |
up |
|
|
British Pound |
127.31 |
127.40 |
0.1% |
0.1% |
down |
down (weak) |
neutral |
|
|
Japanese Yen |
70.91 |
66.69 |
(0.2)% |
(6.0)% |
up |
up (weak) |
down |
|
|
|
|
|
|
|
|
|
|
|
|
|
|
|
|
|
|
|
|
|
|
Precious Metals |
|
|
|
|
|
|
|
|
|
Gold |
2,071.80 |
2,659.60 |
(0.8)% |
28.4% |
neutral |
up |
up |
|
|
Silver |
24.09 |
31.59 |
1.5% |
31.1% |
neutral |
up |
up |
|
|
Platinum |
1,023.20 |
933.80 |
(2.1)% |
(8.7)% |
down |
down |
down (weak) |
|
|
|
|
|
|
|
|
|
|
|
|
Base Metals |
|
|
|
|
|
|
|
|
|
Palladium |
1,140.20 |
965.60 |
(3.0)% |
(15.3)% |
down |
neutral |
down |
|
|
Copper |
3.89 |
4.20 |
1.5% |
8.0% |
down |
down |
up (weak) |
|
|
|
|
|
|
|
|
|
|
|
|
Energy |
|
|
|
|
|
|
|
|
|
WTI Oil |
71.70 |
67.20 |
(1.4)% |
(6.4)% |
down |
down |
down |
|
|
Nat Gas |
2.56 |
% |
(8.3)% |
20.3% |
up |
up |
down (weak) |
|
Source: www.stockcharts.com
Note: For an explanation of the trends, see the glossary at the end of this article.
New highs/lows refer to new 52-week highs/lows and, in some cases, all-time highs.
- * New All-Time Highs
Source: www.stockcharts.com
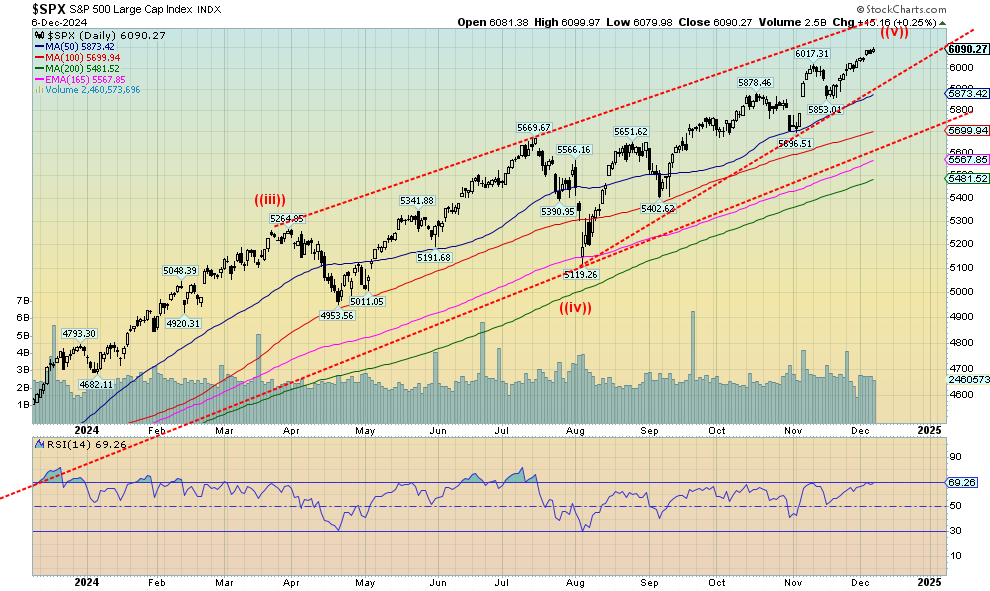
We suppose one could say this is getting tiresome—all-time highs, that is. Seems that most every week (day?) the market soars to yet another all-time high. The S&P 500 (SPX) has made 57 all-time highs in 2024. The NASDAQ is apparently a piker, making only 36 all-time highs. There are 252 trading days in 2024 and there are 16 trading days left. That suggests that the S&P 500 has made all-time highs to date roughly 25% of the time. We haven’t checked how many times it made all-time highs in 1929. But we had that low of 5,119 back in August and from there we appear to be making five waves up. So, is this the fifth wave?
On the week, the S&P 500 gained 1.0%, the Dow Jones Industrials (DJI) made all-time highs, then reversed and closed down 0.6%, while the Dow Jones Transportations (DJT) never made it up and lost 4.2%. The NASDAQ joined the all-time high parade, up 3.3%. Also joining the all-time high parade was S&P 100 (OEX), the NASDAQ 100, the Wilshire 5000, and the Russell 1000 and 3000. The all-time high crowd is actually dwindling. Oh yes, and Bitcoin (discussed later) soared past $100,000. The S&P 400 (Mid) lost 1.0% while the S&P 600 (Small) fell 1.4%.
In Canada, the TSX Composite made all-time highs with a feeble 0.2% gain. The TSX Venture Exchange (CDNX) fell 0.7%. In the EU, the London FTSE rose 0.3%, the EuroNext was up 1.8%, the Paris CAC 40 rose 2.7%, while the German DAX made all-time highs, up 3.9%. The EU indices gains were mysterious against the backdrop of weakening economies and political turmoil in France. Some have said the rise in the CAC 40 is a blip soon to be
reversed. In Asia, China’s Shanghai Index (SSEC) rose 2.3%, the Tokyo Nikkei Dow (TKN) was up 2.3%, and Hong Kong’s Hang Seng (HSI) was up 2.3%. Happy days all around.
The bull channel seems to suggest that the SPX has more room to move even higher. We haven’t even had the Santa Claus rally yet (last five days of the year and first two of the New Year), nor have we hit the start of the January effect (starts in mid-December another week from now). Of course, big on the horizon is the FOMC on December 17–18 where it is now widely expected to see a 25 bp cut. But could they go 50 bp?
Trouble starts under 5,850, breaks under 5,700, and panics under 5,400. Usually hitting whole numbers like 6,000 brings a pause, at least. But here we are at roughly 6,100. The top of the channel is up around 6,300. The DJI reversed this past week, closing lower after making its all-time high. Could that be a harbinger? Negative divergences are across all time frames. The market is grossly overvalued but in a super bull, elated about a new president who wants to cut regulations, cut taxes, and put tariffs on every country overvalued is merely a pause before even more overvalued. After all, the market went up about 68% under Trump 1 despite the nasty drop in 2018 and the pandemic panic in 2020. But it is also up 58% during Biden’s tenure, despite the nasty correction in 2022. What will Trump 2 bring? Expectations are high.
Source: www.stockcharts.com
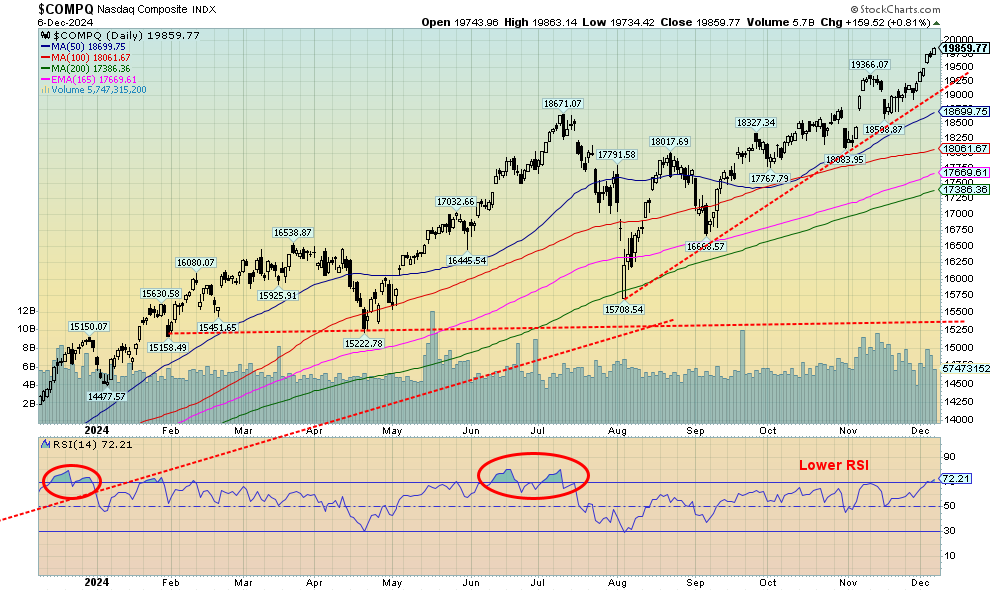
The MAG7 still rules, it seems, as they helped the NASDAQ to soar once again to new all-time highs. The companion NY FANG Index also soared to new all-time highs. NASDAQ gained 3.3% this past week while the NY FANG Index was up 6.0%. Numerous MAG7 stocks made all-time highs including Meta, Apple, Amazon, Netflix and, of course, Elon Musk’s Tesla. Tesla jumped 12.8%, Amazon jumped 9.2%, while Meta was up 8.6%. While not members of the MAG7, Broadcom was up 10.8% and Trump Media (DJT) was up 9.9%. Neither made all-time highs. We don’t know where this ends, but we do know that what goes up fast comes down even faster. Once again, the dailies are in overbought mode on the RSI, over 70. But at this point it is diverging with even higher RSIs back in June/July 2024. A break comes under 19,000, but a more significant one would be under 18,000.
Source: www.stockcharts.com
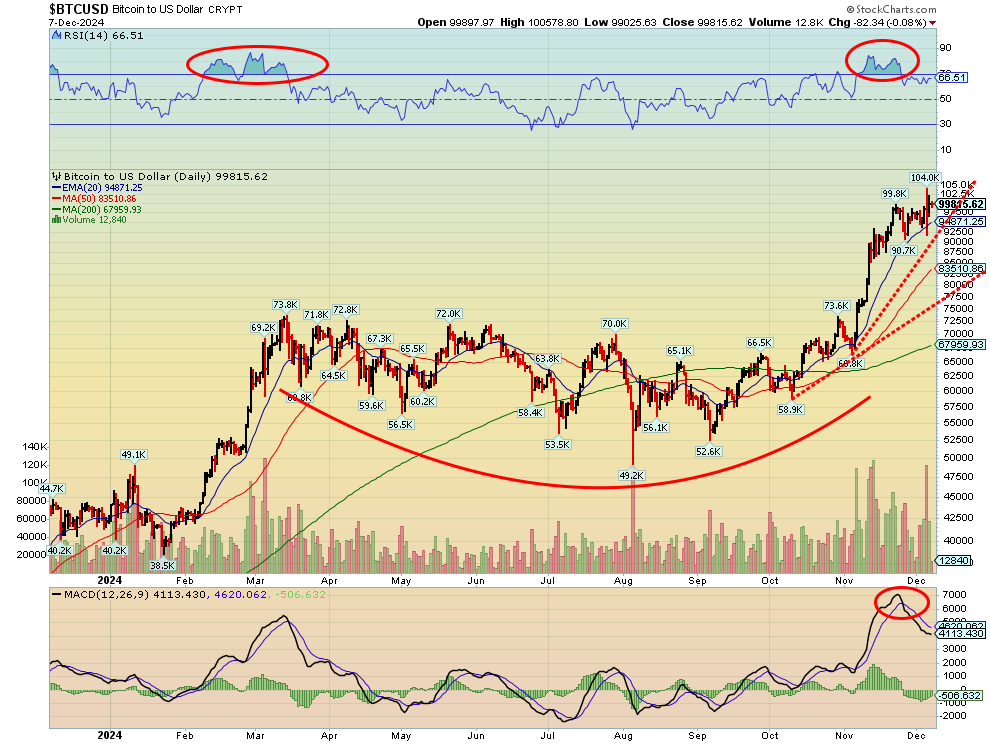
It’s a bird! It’s a plane! No, it’s Bitcoin (BTC). Yes, Bitcoin soared again, hitting a high this week of $104,000. The crypto fans were having their wet dream come true. BTC is now up 141% in 2024 and there are some in the Trump administration already talking of having BTC become the new U.S. dollar. Trump has even appointed a crypto fan as the head of the Securities and Exchange Commission, ex-commissioner Paul Atkins who served from 2000 to 2008. More recently, Atkins was head of Patomak Global Partners (www.patomak.com), a financial and crypto currency consulting firm. Amongst Trump’s numerous appointed billionaires, led by Elon Musk, Atkins is worth a rather poverty-stricken $60 million. But he believes in deregulation and many believe the SEC is too regulatory. There are a couple of issues with Bitcoin. Despite the exhilarating higher highs, the RSI is making lower highs and the MACD (also shown) is in sell mode. It’s only on the dailies, but the weeklies are rolling over. The weeklies and the monthlies are so far up into overbought territory that it is a matter of when, not if, Bitcoin could fall. We’ll give it some room, but under $92,500 the downfall may be getting
underway. Under $77,500 it’s definitely underway and under $68,800 panic could set in. In the interim, the crypto fans (and owners) are living a dream.
We are, however, reminded that Charlie Munger, vice-chair of Berkshire Hathaway, once said about Bitcoin that “it's like somebody else is trading turds and you decide, I can't be left out.” Jamie Dimon, CEO of JP Morgan, calls crypto a “fraud” and a “Ponzi scheme.” (Thanks, Mike, for the hint to include this). Irrespective of this, what is Bitcoin? Well, it is nothing, just a computer-generated asset that you can’t touch or see (except the logo), an imaginary asset that can’t be expanded, unlike money supply and the U.S. dollar. So, we wonder how it could possibly replace the U.S. dollar. Trump has threatened the BRICS nations that if they stop using the U.S. dollar, which they are working on getting away from, he’ll slap 100% tariffs on them. So, on one hand, they want to punish the BRICS for not using the U.S. dollar and on the other they want Bitcoin to replace the U.S. dollar. No, we can’t tell when the Bitcoin party will be over. It may well just pull back a bit before soaring once again. But we are also reminded that tulips were real, even if the price got way out of hand (Tulip Mania 1634–1637).
Source: www.stockcharts.com
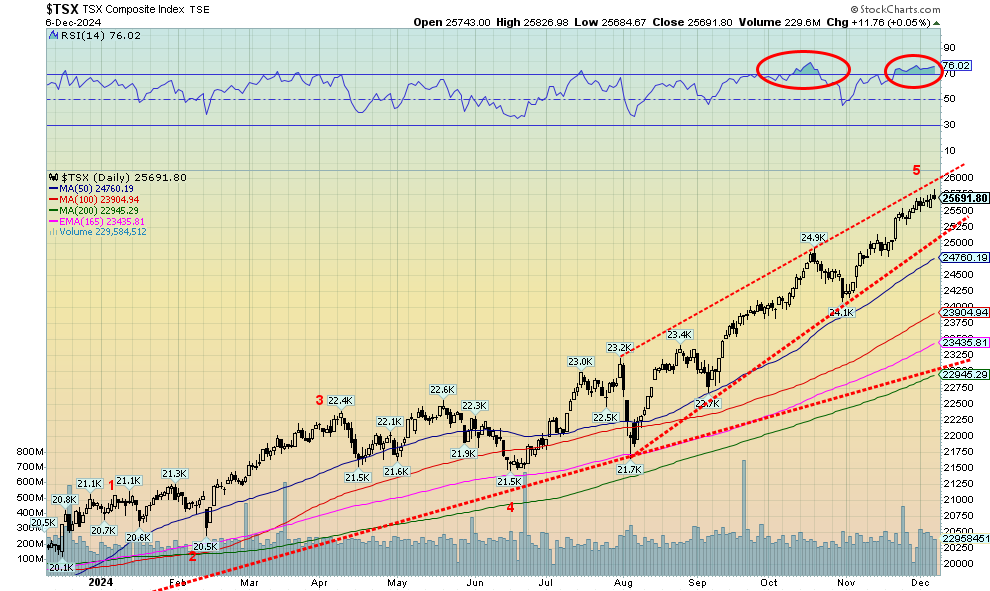
The TSX Composite once again rose to fresh all-time highs (seems like that happens every week), continuing the insanity of the markets. The TSX rose 0.2%. The TSX Venture Exchange (CDNX) didn’t fare as well, falling 0.7%. The junior market just gets no love, even as it is up 10.4% on the year. The TSX rose, despite eight of the 14 sub-indices falling on the week. The downward thrust was led by Energy TEN falling 3.6%. Health Care
THC fell 2.3% while Income Trusts TCM fell 2.1%. Amazingly, five sub-indices made all-time highs. They were Consumer Discretionary TCD that actually reversed and fell 0.3%, Consumer Staples TCS, up 2.5%, Financials TFS, up 0.5%, Industrials TIN, up 0.1%, and Information Technology TTK, up 2.1%. The TSX 60 also made all-time highs, up 0.2%, the same as the TSX. We’re getting closer to the top of that bull channel near 26,000. The
market has been in overbought territory with the RSI over 70 now for four consecutive weeks. It’s getting long in the tooth. The index breaks down 25,250 and under 24,000 a bigger breakdown gets underway.
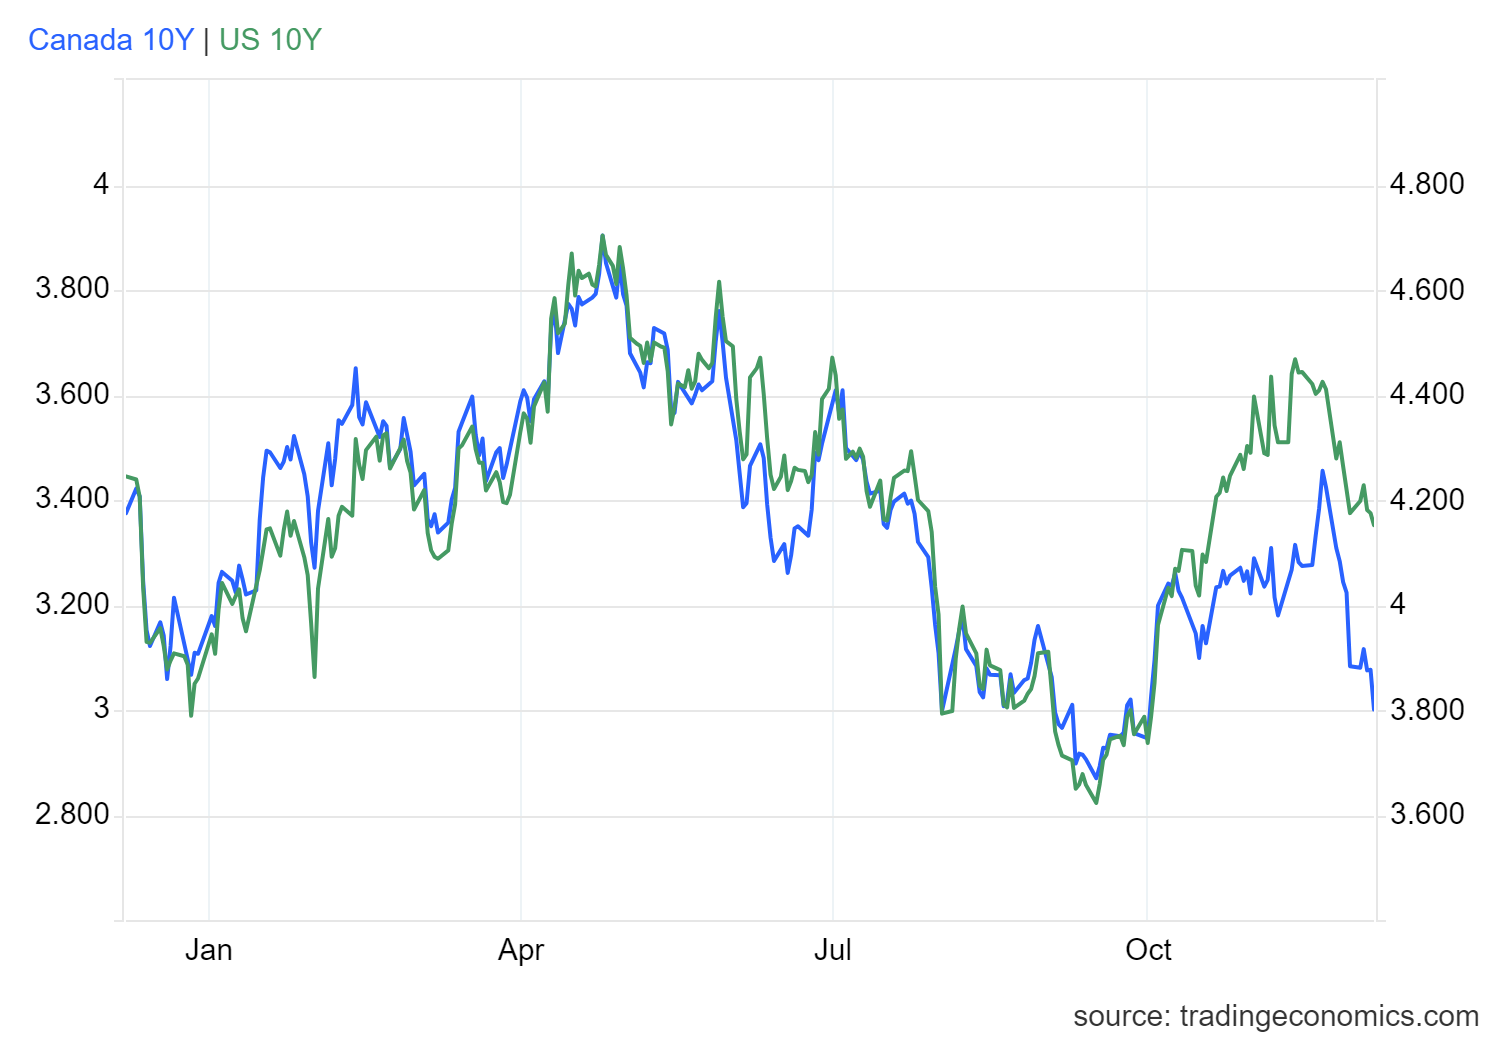
U.S. 10-year Treasury Note, Canada 10-year Bond CGB
Source: www.tradingeconomics.com, www.home.treasury.gov, www.bankofcanada.ca
The U.S. 10-year treasury bond barely moved this past week, falling a measly 1 bp to 4.17%. Nudging it lower was the nonfarm payrolls rise of 227,000 that was above expectations, although underneath things didn’t look as good. Unemployment rose to 4.2%. As a result of the weakening labour market, expectations have now soared that the Fed will cut 25 bp at the Dec 17–18 FOMC. Other numbers showed ISM Manufacturing improved slightly but was still in recessionary territory under 50. JOLTS job openings were higher than
expected, but so were JOLTS jobs quits, seeming to offset each other. ISM services came in under expectations, suggesting a slowing services market. Initial jobless claims at 224,000 were higher than expected, while the Michigan Consumer Sentiment Index hit its highest level since April. So maybe it wasn’t surprising that the 10-year barely moved. But the 2–10 spread widened to 6 bp from 2 bp. Canada’s 10-year Government of Canada bond did fall to 3.00%, a drop of 11 bp, while its 2–10 spread widened to 9 bp from 6 bp. Both the U.S. and Canada still seem headed for a recession, but the excitement in the market is that the Fed is engineering a soft landing. The Goldilocks economy. Maybe they haven’t assessed the potentially negative impact of all of Trump’s tariffs yet.
Source: www.stockcharts.com
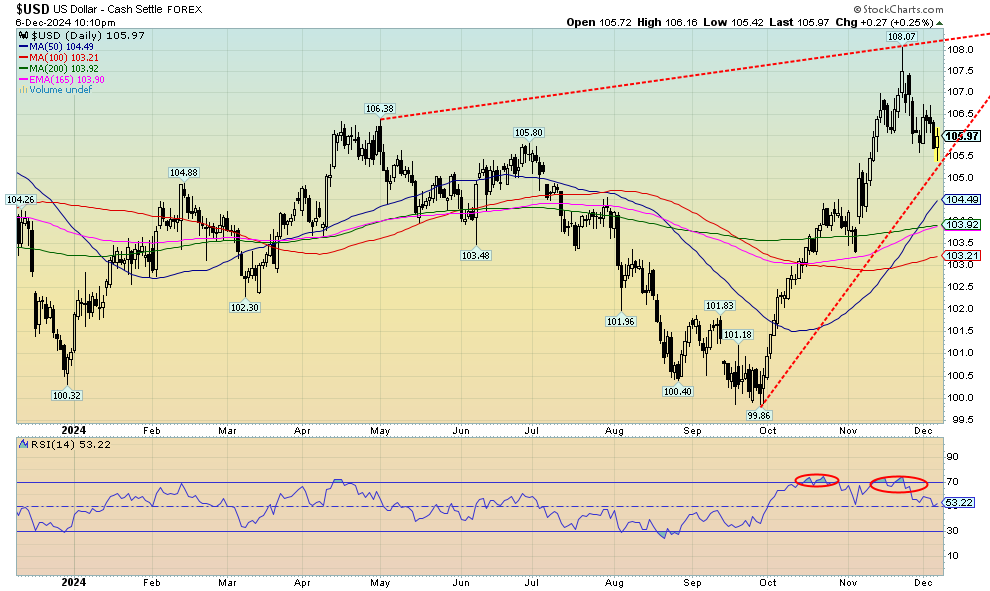
Has the US$ Index (USDX) topped? After peaking at 108.07, USDX has fallen to 105.97, or is down roughly 2%. It’s the biggest drop in some time. We could argue that USDX is holding support, but the reality is there is much better support down to 104/104.50. Under 103.50 a top would be confirmed. On the week, USDX rose a small 0.2%, the euro was down 0.1%, the Swiss franc rose 0.2%, the pound sterling was up 0.1%, while the Japanese yen fell 0.2%. The Cdn$ fell to 52-week lows near 70.50, losing 1.1%. Worst-performing currency of the group. Fear of Trump tariffs is driving some of this and the interest rate differential between Canada and the U.S. sees U.S. rates higher than Canada. The BofC meets this week and another rate cut is expected, which won’t help the Cdn$. If USDX is to recover, we need to get back above 107.50 to suggest new highs. If 108.07 holds, we could be forming a wedge triangle (bearish). But that is not confirmed as that up line from the September low is not fully confirmed yet.
Source: www.stockcharts.com
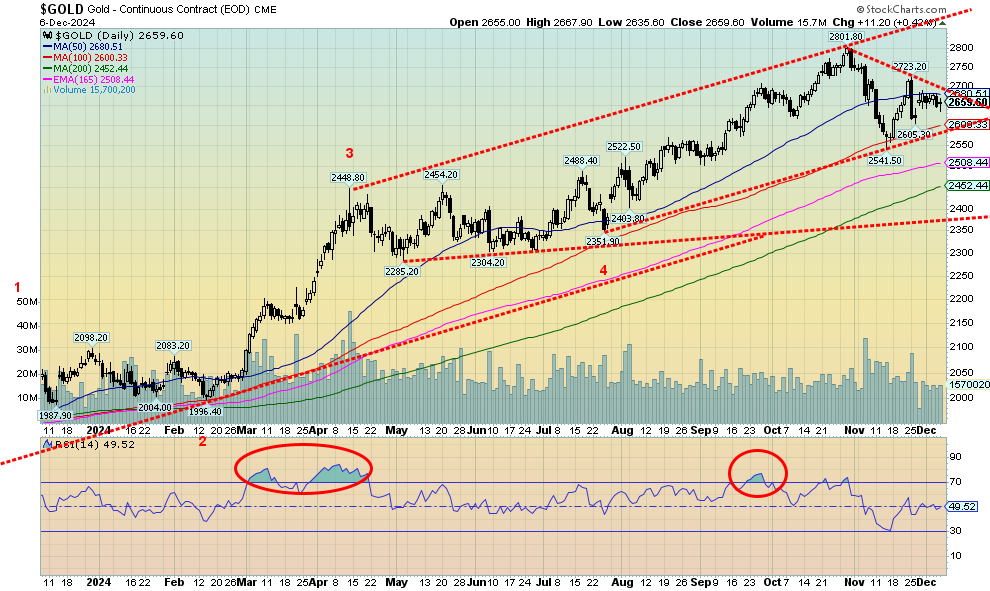
It was another lousy week for gold, even as it redeemed itself on Friday following the job numbers and finishing the week on a positive note. On the week, gold lost 0.8%. But in a surprise move, silver gained 1.5%. Haven’t seen that in some time with silver up and gold down. We like to see silver leading. Will we follow through? Platinum is still woeful, falling 2.1%, while palladium is also woeful, falling 3.0%. Both are down on the year by 8.7% and 15.1%. In another positive move, copper gained 1.5% and remains up on the year. Like silver, we like to see copper potentially leading. Eventually that should be positive for gold.
Gold recovered a bit on Friday following the job numbers that, as we noted appear strong on the surface, but showed considerable weakness underneath. That heightened thoughts that the Fed will cut at least 25 bp at the December 17–18 FOMC meetings. Weaker demand from China helped soften gold prices earlier in the week. We’ve recovered from that big drop on November 25, but the entire pattern from the $2,801.80 top looks like a correction that may not be over just yet. If these waves fall in three (ABC), then the A wave bottomed at $2,541 while the B wave may have topped at $2,723. C wave to come, of which the November 25 drop was just the start. Support is seen down to $2,600, but under that level we could fall to better support near $2,500. Interim support is at $2,550. Long-term support is down to $2,400. We don’t believe we will drop that low, but it can’t be ruled out, either.
A break above $2,700 would be good and above $2,740/$2,750 new highs are probable. Following that, the next move could be up to $3,000. We have further targets up to $3,600. But, as we discover, nothing is straight up—unless you’re Bitcoin.
Source: www.stockcharts.com
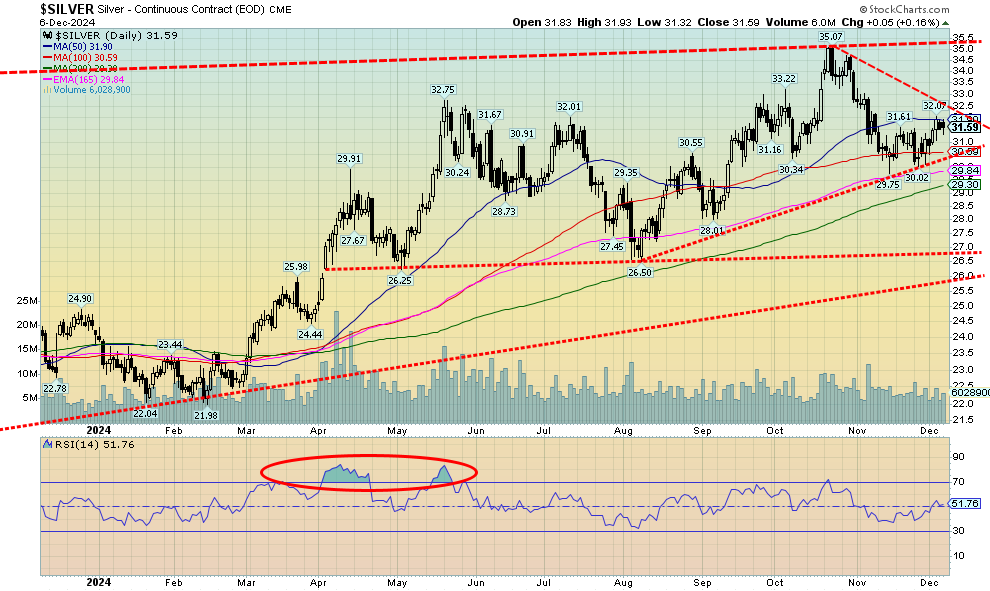
Like gold, silver put in a pretty mediocre week. Still, silver gained 1.5% vs. gold falling 0.8%. Is this a positive bullish sign we’ve been looking for? We like to see silver leading—both up and down. It helps affirm the trend. And, despite silver being in constant demand deficit, its price remains moribund. Gold made new all-time highs; silver is not even close. We see resistance up to $32.50, but above that level we could move higher. We need to regain above $33.80/$34 to suggest new highs above $35.07. However, a breakdown under $30.50 could have the opposite effect, causing us to move lower. That low in February 2024 saw silver advance in what appears to be five waves up to $32.75. A three-wave correction down bottomed in August. Then came another five-wave advance, topping in October at $35.07. So far, we’ve seen a wave down and now a wave up. So, a C wave could still be seen to the downside. There is solid support down to $29/$29.25, but a break under that could see silver fall further towards long-term support at $27. Our targets of $39/$40 have been looking increasingly wobbly, but if our wave count is correct once this correction is over, we should once again advance strongly.
Source: www.stockcharts.com
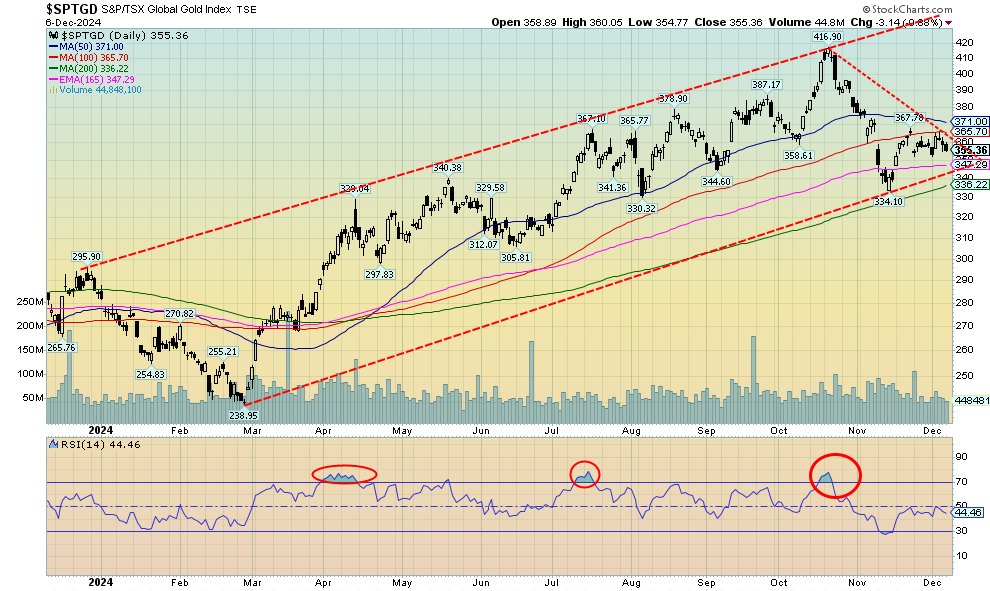
The gold stocks wobbled this past week with the price of gold off. It’s hard to say what pattern is forming, as it could be bearish or bullish. Failure to regain back above the 50/100-day MAs suggests bearish. But the small consolidation pattern might be a bull flag. On the week, the TSX Gold Index (TGD) fell 0.8% while the Gold Bugs Index (HUI) was off 1.6%.
The TGD needs to regain above 371 to suggest higher prices. Above 397/400 new highs are probable. Indicators are pretty neutral here and volume has tapered off in typical corrective mode. If this is supposed to be an ABC-type correction, the A wave bottomed at 334 while the B wave is the current small up wave. Will a C wave come to the downside? Support is seen down to 336, but under 334 we fall further, possibly towards 300.
Source: www.stockcharts.com
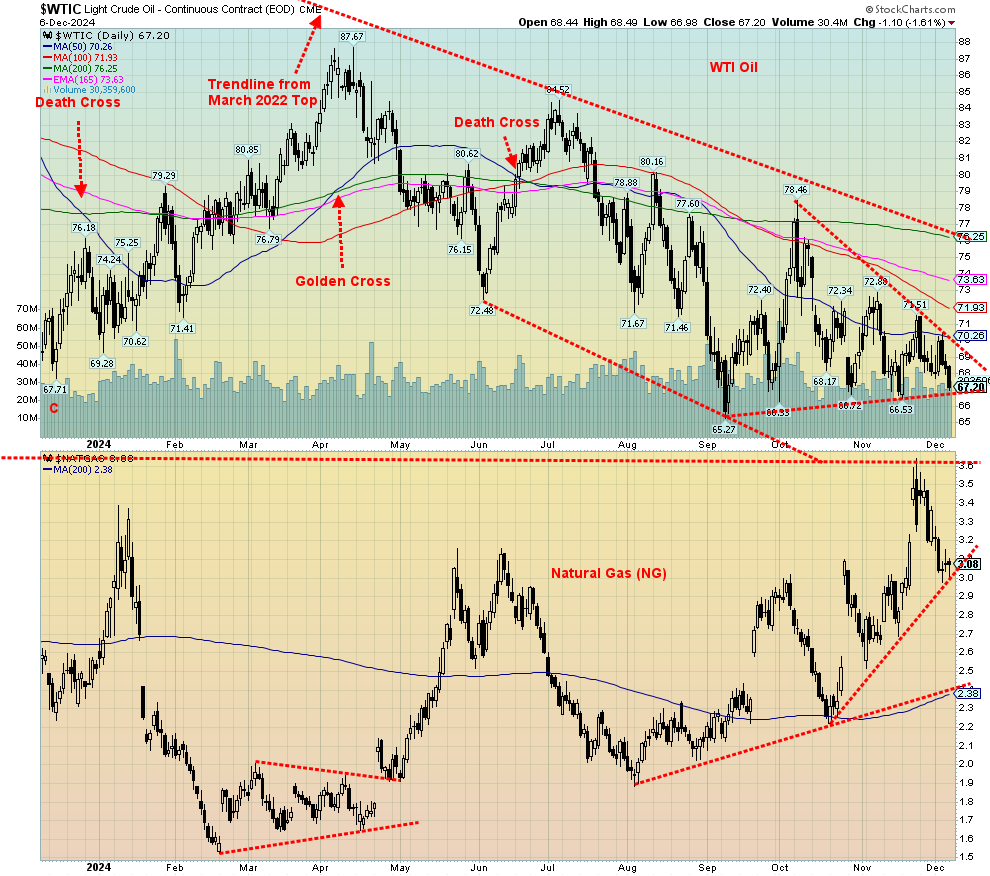
Misery continues in the energy sector. Nothing was up this past week. Just down, then down again. WTI oil fell 1.4%, falling towards $67, natural gas (NG) dropped 8.3%, while EU NG at the Dutch Hub fell 2.9%, Brent crude was down 1.1% and as for the energy stocks, well, they fell too. The ARCA Oil & Gas Index (XOI) dropped 4.3% while the TSX Energy Index (TEN) fell 3.6%. WTI oil and Brent crude are both down on the year by 6.4% and 7.8% respectively. The XOI has turned negative, down 0.6% on the year, but the TEN still holds a gain of a not so bad 11.7%. NG has done well with Henry Hub up 20.3% while the Dutch Hub has gained 43.9%. War helps the Dutch Hub.
Part of the problem is demand uncertainty. Demand has slipped and there are predictions of more demand uncertainty. OPEC was planning a meeting that might have seen production rises, but they cancelled it, so the production cuts stay in place in an attempt to keep oil prices elevated. They are planning on lifting some cuts by April 2025. Still, many anticipate supply surpluses adding to the downward pressure. China demand, in particular, has fallen.
NG slipped this past week due to a lower than expected drawdown. While we’ve been through a cold spell (such as it was) warmer weather is anticipated, which could cut prices going forward. Oddly, in the EU, Russia eased payment rules, reducing fear of supply disruptions. Yes, the EU is still getting some supplies from Russia, usually through third parties, and payment goes through other banks to pay Gazprombank and avoid U.S. sanctions. It shows that sanctions don’t really work.
Both WTI oil and NG are sitting on support as the week ended. If WTI oil firmly breaks under $67, we could target down to $54. We need to regain and get back above $70 to suggest higher prices. A bigger breakout now doesn’t come until above $76. NG is resting on $3, but a break back under that level could send us down to $2.70. We need to regain above $3.20 to suggest higher prices.
|
GLOSSARY Trends Daily – Short-term trend (For swing traders) Weekly – Intermediate-term trend (For long-term trend followers) Monthly – Long-term secular trend (For long-term trend followers) Up – The trend is up. Down – The trend is down Neutral – Indicators are mostly neutral. A trend change might be in the offing. Weak – The trend is still up or down but it is weakening. It is also a sign that the trend might change. Topping – Indicators are suggesting that while the trend remains up there are considerable signs that suggest that the market is topping. Bottoming – Indicators are suggesting that while the trend is down there are considerable signs that suggest that the market is bottoming. |
Disclaimer
David Chapman is not a registered advisory service and is not an exempt market dealer (EMD) nor a licensed financial advisor. He does not and cannot give individualised market advice. David Chapman has worked in the financial industry for over 40 years including large financial corporations, banks, and investment dealers. The information in this newsletter is intended only for informational and educational purposes. It should not be construed as an offer, a solicitation of an offer or sale of any security. Every effort is made to provide accurate and complete information. However, we cannot guarantee that there will be no errors. We make no claims, promises or guarantees about the accuracy, completeness, or adequacy of the contents of this commentary and expressly disclaim liability for errors and omissions in the contents of this commentary. David Chapman will always use his best efforts to ensure the accuracy and timeliness of all information. The reader assumes all risk when trading in securities and David Chapman advises consulting a licensed professional financial advisor or portfolio manager such as Enriched Investing Incorporated before proceeding with any trade or idea presented in this newsletter. David Chapman may own shares in companies mentioned in this newsletter. Before making an investment, prospective investors should review each security’s offering documents which summarize the objectives, fees, expenses and associated risks. David Chapman shares his ideas and opinions for informational and educational purposes only and expects the reader to perform due diligence before considering a position in any security. That includes consulting with your own licensed professional financial advisor such as Enriched Investing Incorporated. Performance is not guaranteed, values change frequently, and past performance may not be repeated.


