
Overview:
Financial war, soaring commodities, sanction ramifications, protection purchase, high jobs, rate hikes
The law of unintended consequences. The world is now at war. At least financial war. When it comes to sanctioning the world's 12th largest economy there may be blowback. Russia has defaulted before. 1998. The LTCM collapse that almost brought down the global financial system. Only this time the stakes are bigger.
Commodity prices are soaring. Russia is a commodity powerhouse. Will anybody be caught short sparking a financial collapse? We look at the ramifications of sanctions on Russia and how this could all end badly - for everyone. But got gold, commodities? You may be buying some protection.
Our chart of the week (page 12) looks at the U.S. job numbers that came in higher than expected. Canada reports their job numbers this coming week. The Fed is still on target to hike interest rates at the March FOMC. The BofC did hike rates this past week as expected. Bonds rallied this past week but the yield curve narrowed further. A recession is looming - inflation over 5%, narrowing yield curve and soaring energy costs.
Inflation is expected to help boost sales in the first half of 2022 for Loblaw Companies Limited, a company which pays a dividend, operates in two segments including retail food, and is held in the Canadian Conservative Growth Strategy*. We provide a special look at soaring food prices. They have the potential for unintended consequences as well. Many commodity prices hit fresh 52-week highs or even all-time highs this past week. Gold, oil, palladium, copper and more.
The world is in turmoil. But the weather is hinting at spring. So get outside and enjoy it. Have a great week.
DC
* Reference to the Canadian Conservative Growth Strategy and its investments is added by Margaret Samuel, President, CEO and Portfolio Manager of Enriched Investing Incorporated, who can be reached at 416-203-3028 or msamuel@enrichedinvesting.com
“Control oil and you control nations; control food and you control the people.”
—Henry Kissinger (attributed to), German-born American politician, diplomat, geopolitical consultant, U.S. Secretary of State 1973–1977, National Security Advisor 1969–1975 under presidents Richard Nixon and Gerald Ford, Nobel Peace prize 1973; b: 1923
“A crowd is extraordinarily credulous and open to influence; it has no critical faculty… it thinks in images.”
—Gustave Le Bon, French polymath, areas of study anthropology, psychology, sociology, medicine, invention, physics, author of The Crowd: Study of the Popular Mind (1895), and others, Doctor of Medicine; 1841–1931
“Anyone taken as an individual is tolerably sensible and reasonable—as a member of a crowd, he at once becomes a blockhead.”
—Friedrich Schiller, German playwright, poet, philosopher, part of literary movement Sturm and Drang, Weimar Classicism, author of William Tell (1825), and others; 1759–1805
August 17, 1998. That’s the day the Russian financial crisis (aka: ruble crisis, Russian flu) started. Russia devalued the ruble and then defaulted on its debt. They also declared a moratorium on repayment of foreign debt. It all came as a shock. Contagion soon spread. Russian banks failed. Banker’s Trust, an historic U.S. bank was saddled with huge amounts of Russian bonds. Banker’s Trust was saved when Deutsche Bank bailed them out by acquiring them for $10 billion. But contagion spread further into EU banks and then came LTCM.
Long Term Capital Management (LTCM) was a highly leveraged hedge fund run by such luminaries as John Meriwether, former head of bond trading at Salomon Brothers, and Myron Scholes and Robert Merton who had shared a Nobel prize in economics for their development of the Black-Scholes option trading model. LTCM was highly exposed to Russia and leveraged to the tune of 25:1 with derivatives on the books of $1.25 trillion face value. LTCM was already suffering from the effects of the Asian financial crisis in 1997 when the Russian crisis hit. LTCM had to be bailed out by a consortium of Wall Street banks brokered by the Federal Reserve. The Fed slashed the Fed rate and along with other central banks provided billions in liquidity to the financial system (early form of QE?). The global financial system was at risk of collapsing. LTCM was wound up by 2000.
Stock markets were hit but, because of the action of the central banks, damage was limited. From a high in July 1998 to a low in September/October 1998 the Dow Jones Industrials (DJI) fell 21.6%, the Tokyo Nikkei Dow (TKN) was down 23.7%, the German Dax was off 38.3%, the MSCI World Index dropped 20.6%, and the TSX Composite fell 28.8%. Oh yes, and the Russian Stock Index (MOEX) fell 80% from the July top and was down 89% from its March 1998 top.
In June 1930, President Herbert Hoover signed the Smoot-Hawley Tariff Act putting tariffs on over 20,000 imported goods. In retaliation, 25 other countries responded by increasing their own tariffs on U.S. goods. This set-in motion the trade wars of the 1930s that sent global trade plummeting. Trade wars were a major contributor to the Great Depression.
While sanctions are not quite the same as tariffs and trade wars, the effect could be the same. Banning Russian banks from SWIFT raises a number of issues because of the interconnection of the global banking system. SWIFT underpins the global economy. Global international trade is conducted through SWIFT in U.S. dollars. Global trade depends on SWIFT. The SWIFT system is owned by the central banks of the G10 including the ECB, the Fed, and the National Bank of Belgium where SWIFT is located. Seven Russian banks have been banned, joining Iranian banks who were banned in 2012. Some 11,000 financial institutions in 200 countries around the world use SWIFT.
In banning Russian banks (with notable exceptions), the financial world has signaled that they are willing to resort to financial war. It also means the politicization of SWIFT. Also included in the sanctions are Russia’s National Wealth Fund and the Ministry of Finance. Yes, Russian banks can still move money the old-fashioned way via telex, fax, telephone, emails, etc. But those processes are slow and awkward and could put a dent in global trade, just as Smoot-Hawley did 92 years ago. The message is, if we don’t like you, you can be banned from the global financial system. Can SWIFT be trusted?
Following the banning of Iran from SWIFT in 2012, China and Russia set out to build an alternative system. But development has been slow and it is not quite up to par just yet. Russia’s payment system only has 23 foreign banks while China’s Cross-Border Interbank Payment System (CIPS) has 176 banks from 47 countries. Funds could be moved through the crypto market. But there are definitive unintended consequences of barring banks from SWIFT. Besides the risk to global trade, it could result in slower economic growth and would translate into less business for the banks that dominate in the eurozone and the U.S. And it encourages the development of alternative systems. Call it the fracturing of the global financial system. Yes, and through it all Russia could be driven closer into the arms of China. That could create a global financial split. Ultimately, that could prove destabilizing for the U.S. dollar, the world’s reserve currency.
Russia is the world’s 12th largest economy with nominal GDP of roughly $1.7 trillion or about the size of Texas or New York. It is not insignificant. But when it comes to national debt to GDP, Russia has a distinct advantage. Russia has one of the lowest national debt to GDP levels in the world at about 19.5%. Russia has an estimated $280 billion of national debt vs. the U.S.’s $30.3 trillion. Compare that to the U.S. national debt to GDP at 125.6%, Japan at 282.7%, or Italy at 173.4%. Of the G7 countries, Germany is the lowest at 75.0%. Russia also has external debt estimated at over $478 billion. Sanctions are potentially driving Russia to a credit crisis of major proportions. Some $92 billion of the debt is denominated in U.S. dollars and another $15.8 billion in euros. An estimated $9 billion comes due in the next three months. An estimated $135 billion comes due within a year. Investors are estimated to hold some $250 billion of bonds issued by Russian companies.
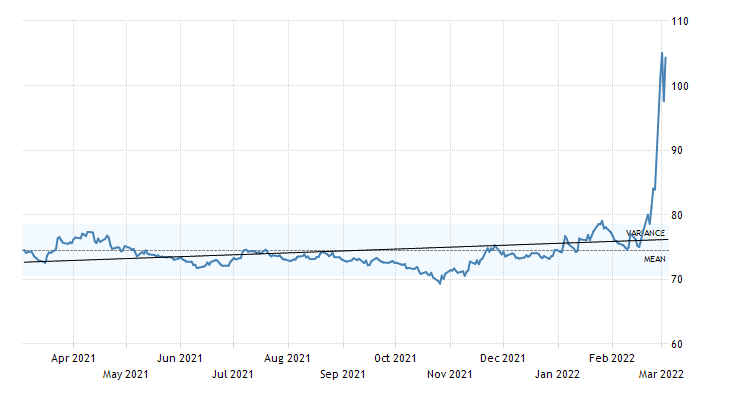
The question is, how will they be paid? Capital controls are being put in place by Russia which in turn could freeze the debt (and assets of foreign companies in Russia), resulting in a debt default of significant size. Irrespective of this, there is no indication right now that debts won’t be paid nor will servicing of existing debt be blocked. But that is not by any means ensured. The result has been to see spreads on Russian debt soar. The chart below of 5-year CDS spreads shows how it has soared from just over 100 bp to over 400 bp in 2022.
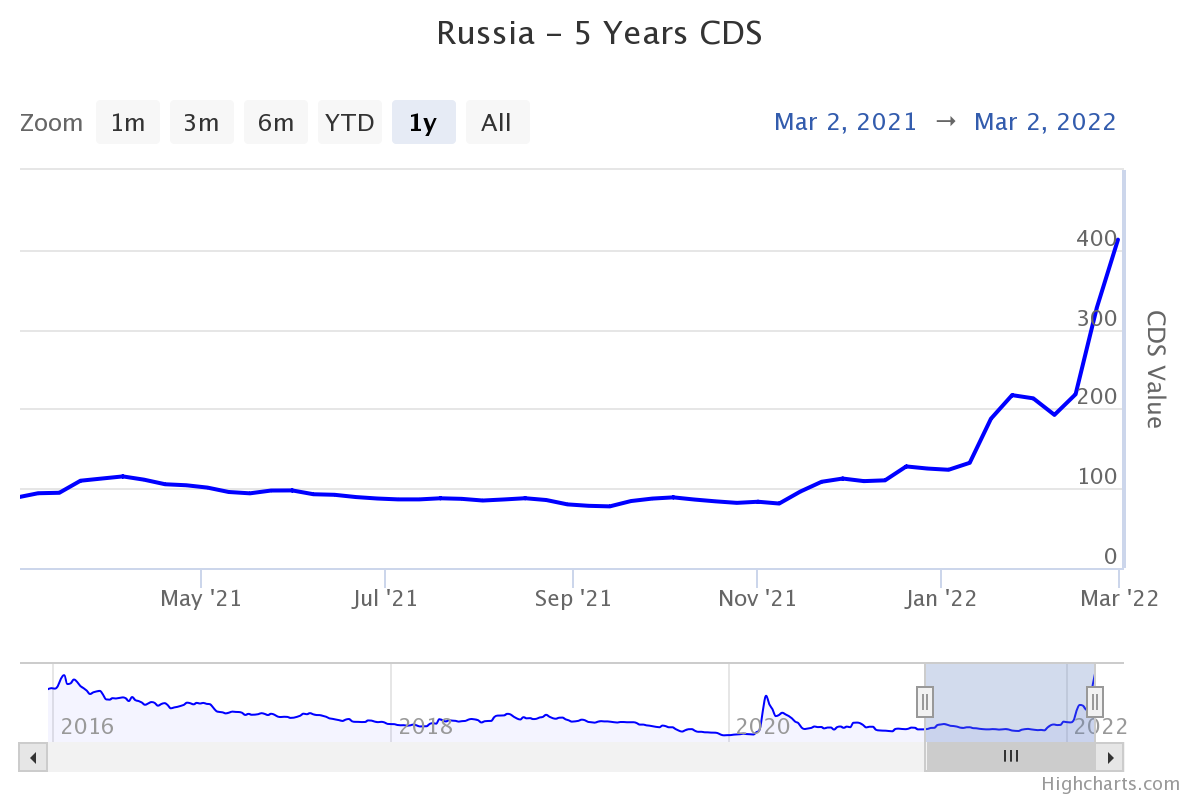
Source: www.worldgovernmentbonds.com, www.highcharts.com
While Russia’s national and external debt in a world awash with debt, last estimated to be about $303 trillion globally, is not particularly large, it is not insignificant. A Russian default, which now becomes more likely, could send shivers through the global banking system. The real danger is default begets default begets default = contagion. Already, contracts worth $41 billion of Russian sovereign debt could be rendered worthless as they are signaling the high likelihood of a default. The chart below shows that the risk of default of Russian sovereign debt is now very high. Swaps are signaling that there is a 65% chance of default within five years and 40% within one year. Traders had rushed to protect themselves through credit default swaps (CDS) and they now hold effectively worthless paper. What they thought was covered may no longer be covered because the underlying debt is effectively worthless.
Our second chart below from Statista (www.statista.com) shows where roughly $111 billion of Russian debt is held. It is noteworthy that Credit Suisse has compared the potential default of Russia to the Lehman Brothers
collapse of 2008 and the pandemic crunch of March 2020 when liquidity problems sparked a major intervention by the Federal Reserve and other central banks. The trouble is, today the central banks are already starting with record ultra-low interest rates, have already been through years of QE that are still somewhat ongoing even as they are starting QT, and national debt is already at astronomical levels against a backdrop of sharply rising inflation. Where do they go from here? Do they even have sufficient room to maneuver in the event of a Lehman Brothers-like collapse (or worse) sparked by a Russian debt default?
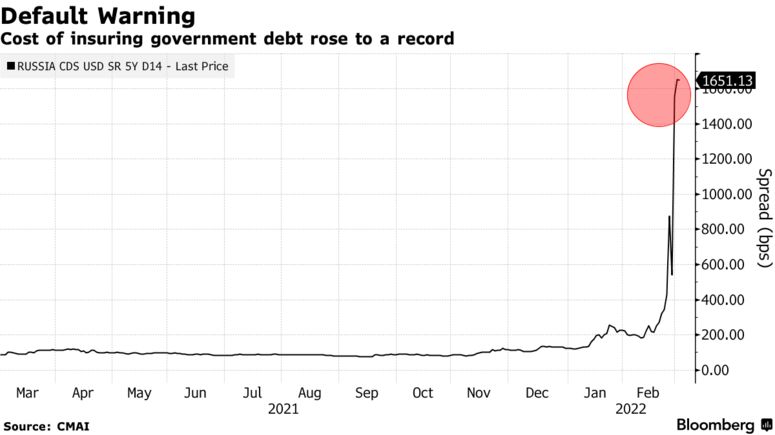
Source: www.Bloomberg.com, www.theice.com
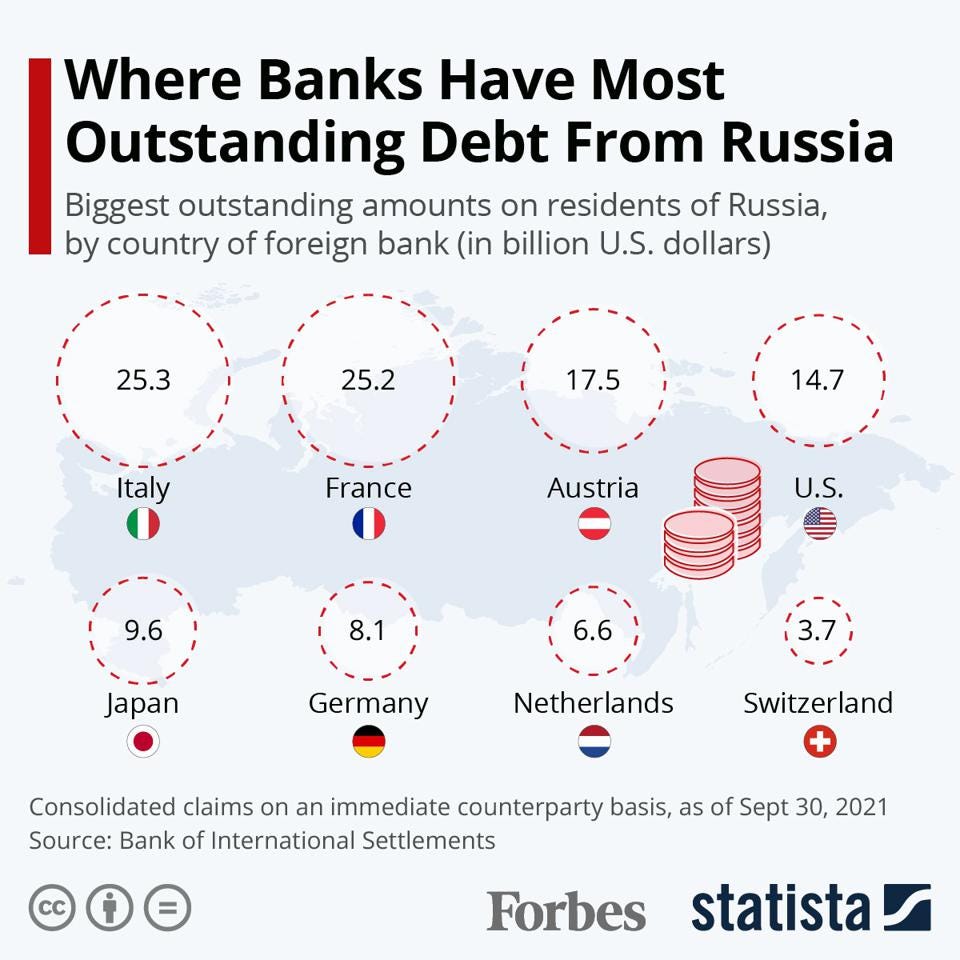
Source: www.statista.com, www.forbes.com
As a result of the growing sanctions, Russia’s stock market, bond market, and currency (ruble) have taken a huge hit. The MOEX, Russia’s stock market, has closed due to the volatility but not until after it had already fallen almost 50% since a high last October. The Bank of Russia has hiked the bank rate to 20% from 9.5% to stem the tide of funds and has advised Russian export companies to sell their foreign currency in order to help the ruble. The Russian 10-year bond has jumped to 13.93%, almost at the 7-year high of 14%. At the beginning of the year, it was 8.42%. The currency that was US$ = 74.65 back on February 9 is now US$ = 104.85 and has been as high as 118, a roughly 30% devaluation. It could fall further.
Russia Government 10-year Bonds
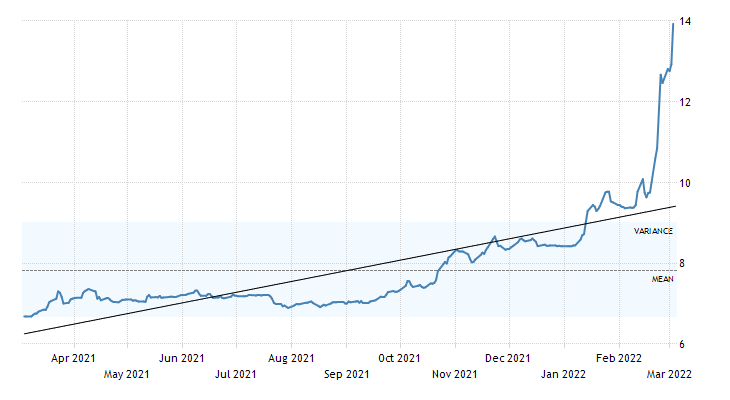
Source: www.tradingeconomics.com, www.cbr.ru
Russian Ruble to Purchase US$
Source: www.tradingeconomics.com, www.cbr.ru
As we have noted on numerous occasions, gold can protect against currency devaluation. Back on March 2, 2021 one ounce of gold could purchase 128 thousand rubles. Today, one ounce of gold could purchase 185 thousand rubles, a revaluation of 44.5%. Russia (and China) in an effort to wean themselves off of the U.S. dollar have increased their gold reserves sharply. Russia’s foreign reserves total some $630 billion of which 21.7% are held in gold in Russia. The gold reserves are not subject to sanctions. Russia’s gold reserves total some 74 million ounces, the fifth highest in the world. China holds some 62.6 million ounces (most likely
under-reported) the sixth largest in the world. Russia holds an estimated 13% of the world’s minable gold reserves (second highest) and produces roughly 9% (third highest) of the world’s gold. China produces roughly 11% of the world’s total (highest) and holds about 7% of the world’s mineable reserves.
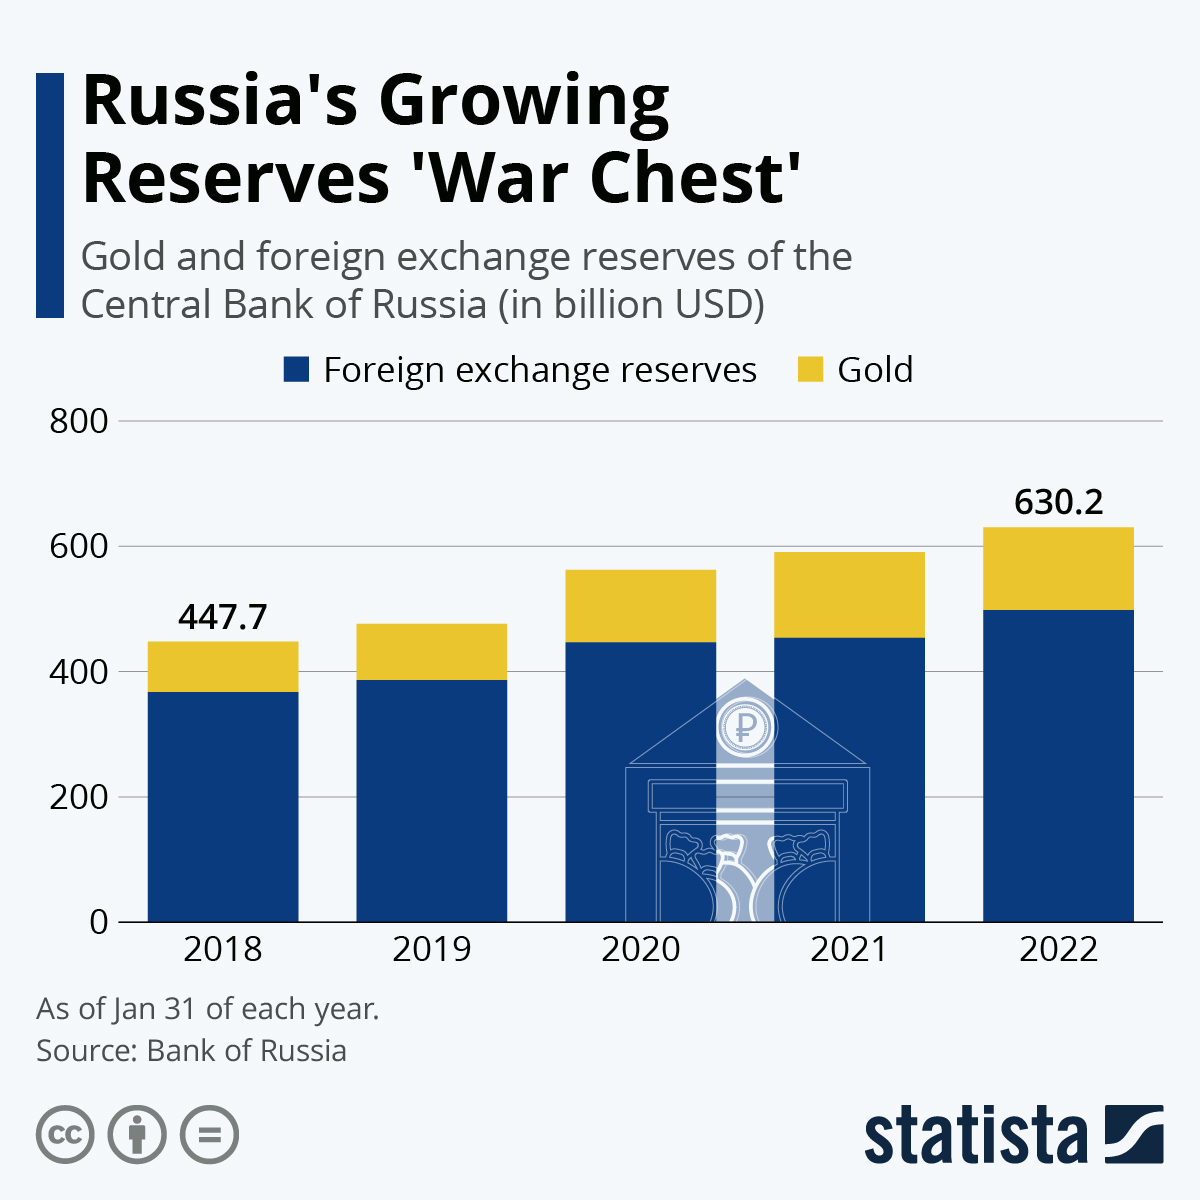
Source: www.statista.com, www.cbr.ru
Could sanctions upend Russia’s ability to access its central bank reserves? Yes, to the extent they are held in other central banks. Roughly 48% of Russia’s reserves are held, not in Russia or China, but in other central banks including the Bank of France, Bank of Japan, Bundesbank, Federal Reserve, Bank of England, plus some others. Russia has been barred from accessing the foreign reserves held outside Russia and China. Still, that
leaves over half of Russia’s reserves accessible. And gold prices are rising. But what message does it send about the integrity of central banks? Can they be trusted?
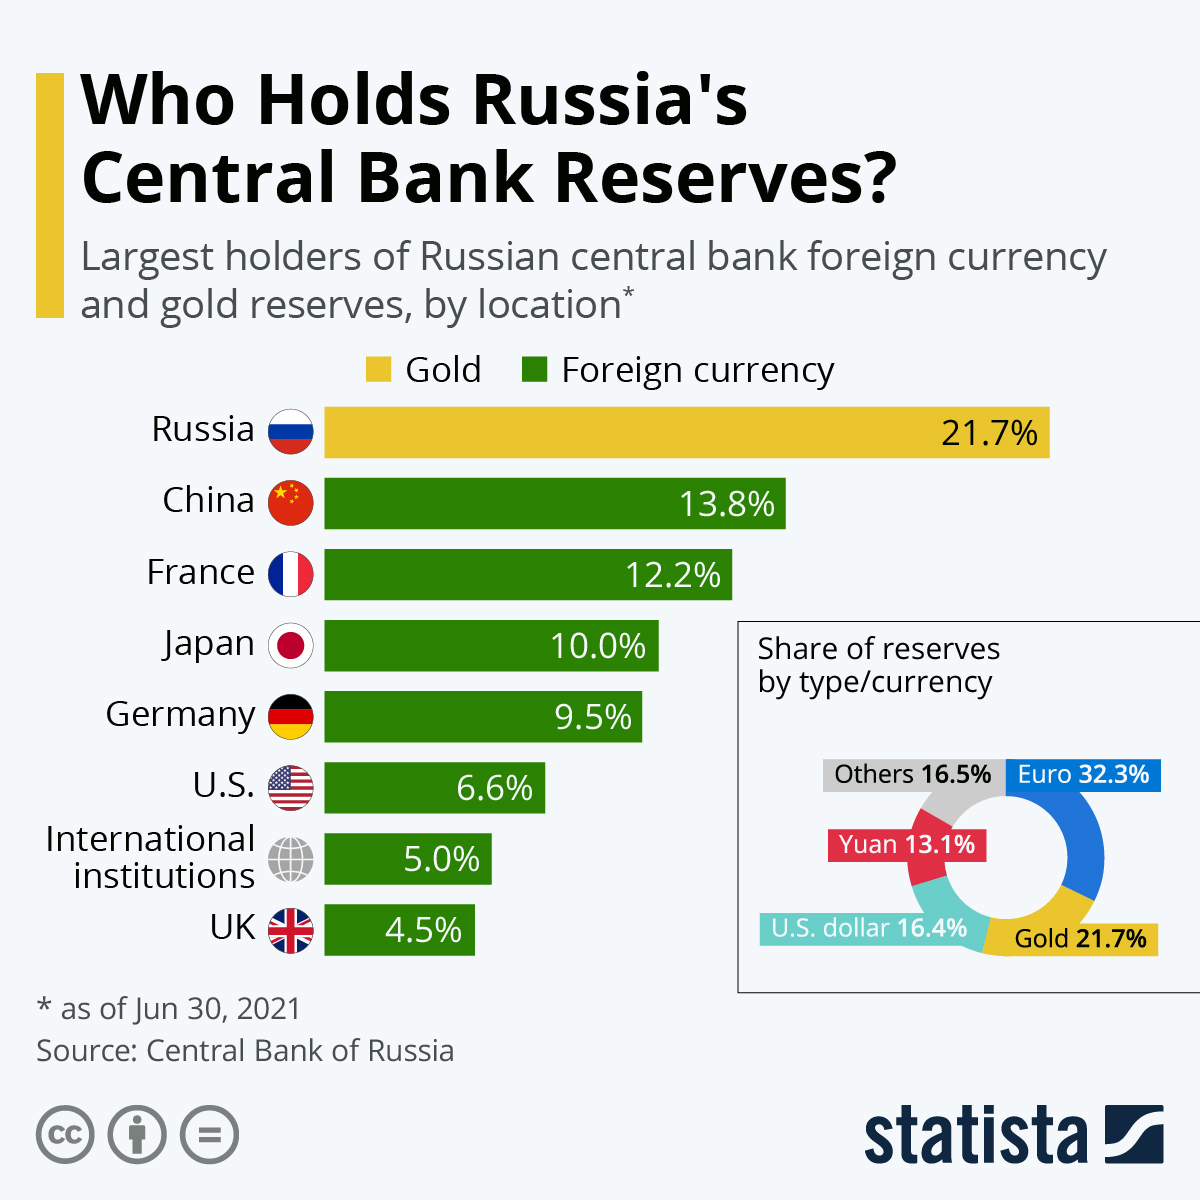
Source: www.statista.com, www.cbr.ru
The inability to access foreign reserves is problematic for Russia and could weigh further on the ruble. While it is one thing to freeze the foreign reserves of the Bank of Afghanistan, it is another to freeze the foreign reserves of the Bank of Russia. The foreign reserves of Iran, Syria, and Venezuela have also been frozen in the
past. The payback for Russia could be a default on its debt. As well, as long as there are no sanctions on Russia’s oil and gas, Russia can still use its reserves to make energy payments. But that only holds if sanctions are not placed on Russia’s oil and gas and that by blocking access to SWIFT purchasers of Russian oil and gas can still make payment. Many are already deciding they cannot for fear of breaking sanctions.
There is also the question of Russian assets and Russian oligarch assets held in sovereign wealth funds, hedge funds, mutual funds, pension funds, insurance companies, etc. Already the stocks of these companies are falling. Blackrock, the world’s largest hedge fund with roughly $10 trillion under management, has fallen over 20% so far in 2022. Withdrawals could mount, putting the funds in trouble or causing them to halt redemptions. Seizure of Russian assets in funds could imperil the integrity of the fund and meet resistance in courts. As it is, many companies with investments in Russia face billions in losses if they pull out, besides their inability to access SWIFT plus capital controls. Western firms in the energy and commodity sectors (which are considerable) could face some of the most difficult problems and losses in pulling out.
Sanctions could have vast unintended consequences. With Russia holding some of the world’s largest commodity reserves and being one of the world’s largest producers, sanctions could exacerbate shortages, interupt supply chains, and spark sharply higher prices for many commodities. That’s already happening along with disruption in global trade. Oil, natural gas, aluminum, tin, nickel, palladium, coal, nickel, wheat, and corn are already rising higher and some have hit decade or all-time highs.
The West needs a lot of what Russia has and one cannot just shut off the tap at one source and turn on another one elesewhere. It takes years to develop new sources, and there is a question of capacity with needing to build new facilities, which also takes time. With Russia and Ukraine producing upwards of 30% of the world’s wheat supply—much of which goes to the Middle East and Africa—unless that is replaced famines could soon be seen. China too is a large consumer of commodities but also has huge reserves of commodities, particularly rare earths, that the West needs. Given what is happening with Russia and its central bank, China is already looking carefully at its foreign reserve holdings and where they are held. China holds roughly $1.1 trillion of U.S. treasury debt.
But this goes on. Disruption of supply chains and trades puts many companies in a bind. Transport infrastructure in Ukraine has been severely damaged. Transportation through Russia will now be difficult to impossible. Chinese companies go through Russia to the EU. Air ties are severely hampered given the closing of airspace to Russia and the closing of Russian airspace to eurozone planes. Sea routes are being cancelled especially through the Black Sea. Turkey is restricting traffic through the Dardenelles and the Bosphorus. The cost of freight by land, sea or air is rising sharply. All of this feeds into global inflation and could ensure that global growth will take a hit. Countries close to Russia who depend on Russia for their energy needs could find themselves almost cut off completely.
All of the consequences of sanctions on Russia are still unknown at this time. But one has to wonder whether we are on the cusp of something beyond the west’s control. If Russia can’t access their reserves are these even
reserves? What is ownership? How are they going to monitor everything through SWIFT. Already Russian oil is being trapped at sea because no one will allow them to dock. Without even sanctions on Russian oil the inability to dock and unload could have a profound impact on global oil supply. How do they pay them for the oil given sanctions on SWIFT. Ultimately everything has to go through SWIFT. Do other countries have to hedge themselves against possible sanctions. There is talk of sanctions on India who are using air defense systems of Russia. The seizing of assets raises the question of due process. Does it exist any more? Some are now questioning whether there will now be a huge crackdown on the usage of crypto. To go after Russia for using crypto could negatively impact the entire system. All sorts of people use crypto to move money and much of it is not necessarily legal as they too are avoiding either sanctions or laundering money.
Gold is nobody’s liability. All of this suggests to us that one should be holding gold and investing in commodities over yield and growth stocks. By suspending Russia’s access to its own foreign reserves, this suggests that for all central banks holding currency reserves the central banks may not be trustworthy. It also highlights the reason for holding gold as a reserve currency. As one pundit wrote, as long as the prices of commodities and gold are underpinned, the race for yield will be replaced by the race for commodities and gold
Chart of the Week
US Job Numbers
Against the backdrop of sharply rising inflation, supply disruptions, and the war in Ukraine, U.S. job numbers surged in February. Call it the winter of the surging job creation. Last month the U.S. added 678,000 jobs, well above the expected 350,000 and January’s 481,000. Okay, wow, 1,168,000 new jobs added in two months. Who’d have thought? Seems nobody saw this one coming.
But what we like to see is the response. The stock market fell, sharply, once again; gold rose, oil soared, the U.S. dollar leaped, and bond prices jumped (yields, which move inversely to prices, fell). All of it seemingly the opposite of what one might normally have expected. But then, there is this little war going on and that, it seems, takes precedence over a booming jobs report.
Before we get too excited, we can’t help but note that despite the booming report the U.S. is still down 2.1 million jobs from where they were in February 2020. The total civilian labour force of 163,991 thousand is still down 592 thousand from February 2020. As well, of the 687,000 jobs created, 179,000 were in leisure and hospitality that are generally low paying. However, full-time employment jumped 704,000 while part-time employment fell 16,000. Other areas that showed strong employment growth were in healthcare and trade/transport.
The jobs report was probably helped by the easing of the Omicron variant and easing of lockdown, mask mandates, etc. Everything is opening up and the demand for people to fill positions is rising. While the number of daily cases in the U.S. has fallen substantially, the number of daily deaths remains high, although slowing. The U.S. is still on pace to reach one million dead by mid-March or so.
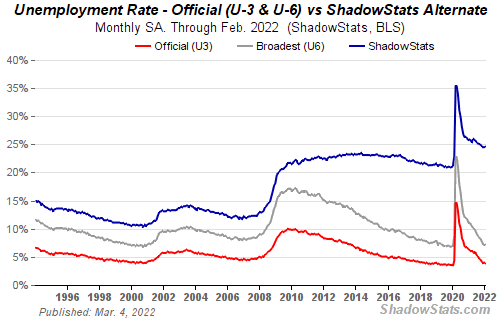
The labour force participation rate inched up to 62.3% from 62.2% but remains below the February 2020 level of 63.4%. The employment-population ratio also inched up to 59.9% vs. 59.7% but again was below the February 2020 level of 61.2%. The official unemployment rate (U3) slipped to 3.8% from 4.0%. The market had expected it to remain steady at 4.0%. The U6 unemployment rate, the highest reported by the Bureau of Labour Statistics (BLS), actually went up to 7.2% from 7.1%. U6 unemployment is U3 unemployment plus short-term discouraged workers and other marginally attached workers forced to work part-time (preferring full-time work but unable to find it). The Shadow Stats unemployment number (www.shadowstats.com) also rose to 24.6% vs. 24.5% in January. The Shadow Stats unemployment number is U6 plus those unemployed over one year and defined out of the labour force in revisions made in 1994. They are no longer included in the labour force. Are the U6 unemployment and the Shadow Stats unemployment reflecting the reality better than the nonfarm jobs and U3 unemployment?
Those reported not in the labour force totaled 99,600 thousand in February vs. 100,378 thousand in January. In February 2020 that number was 95,393 thousand. There are 56,371 thousand retirees and 9,163 thousand
disabled who are not employed. Full-time students, those remaining at home to care for kids, elderly persons, etc. are also part of those not in the labour force.
Possibly of concern was the fact that wage growth was feeble against an inflationary background. Month over month (m-o-m) hourly wage growth was flat when it was expected to grow 0.5%. Pay actually declined for the leisure/hospitality sector and even fell for manufacturing but rose for construction and trade/transportation. Professional business and services rose 0.1%. Year-over-year (y-o-y) hourly wage growth was up 5.1% but remember inflation was up y-o-y 7.5%. Are wages falling behind? Weekly earnings did grow 0.3% in February and y-o-y they are up 5.4%. It’s so hard to get a read on this. We note also that people leaving jobs as a percentage of the unemployed rose to 15.1% from 14.5%, the highest since April 2020. Is the labour market tight? Or does it just appear that way?
Despite the rosy numbers, the number of people unemployed 27 weeks or longer actually rose slightly. The average number of weeks unemployed rose to 26.6 weeks from 24.6 weeks and 20.8 weeks back in February 2020. The median number of weeks unemployed rose to 9.9 weeks from 8.5 weeks. In February 2020 it was 9.3 weeks.
It will now be important to see follow-through in the months ahead. With the Omicron variant subsiding, it is hoped that even more jobs are created. But what if the Omicron returns? Or yet another variant that is even more deadly appears? Given we are now into two years of COVID-19, some odds might favour COVID subsiding. The Spanish flu of 1918–1920 began to dissipate after two years, although it lingered for some time after that. The unknown is could there be fallout from the war in Ukraine and a negative impact from all the sanctions—i.e., a Russian default. As we note, another Lehman Brothers moment, but worse.
MARKETS AND TRENDS
|
|
|
|
% Gains (Losses) Trends
|
|
||||
|
|
Close Dec 31/21 |
Close Mar 4/22 |
Week |
YTD |
Daily (Short Term) |
Weekly (Intermediate) |
Monthly (Long Term) |
|
|
Stock Market Indices |
|
|
|
|
|
|
|
|
|
S&P 500 |
4,766.18 |
4,327.87 |
(1.3)% |
(9.2)% |
down |
down |
up |
|
|
Dow Jones Industrials |
36,333.30 |
33,614.80 |
(1.3)% |
(7.5)% |
down |
down |
up |
|
|
Dow Jones Transports |
16,478.26 |
15,392.41 |
1.2% |
(6.6)% |
down |
neutral |
up |
|
|
NASDAQ |
15,644.97 |
13,313.44 |
(2.8)% |
(14.9)% |
down |
down |
up |
|
|
S&P/TSX Composite |
21,222.84 |
21,402.43 |
1.4% |
0.9% |
up |
up |
up |
|
|
S&P/TSX Venture (CDNX) |
939.18 |
847.24 |
1.3% |
(9.8)% |
down |
down |
up |
|
|
S&P 600 |
1,401.71 |
1,299.07 |
(0.9)% |
(7.3)% |
down |
down |
up |
|
|
MSCI World Index |
2,354.17 |
2,150.69 |
(3.5)% |
(8.6)% |
down |
down |
up |
|
|
NYSE Bitcoin Index |
47,907.71 |
40,703.47 |
3.5% |
(15.0)% |
neutral |
down (weak) |
up |
|
|
|
|
|
|
|
|
|
|
|
|
Gold Mining Stock Indices |
|
|
|
|
|
|
|
|
|
Gold Bugs Index (HUI) |
258.87 |
304.69 (new highs) |
8.6% |
17.7% |
up |
up |
up |
|
|
TSX Gold Index (TGD) |
292.16 |
344.53 (new highs) |
8.6% |
17.9% |
up |
up |
up |
|
|
|
|
|
|
|
|
|
|
|
|
Fixed Income Yields/Spreads |
|
|
|
|
|
|
|
|
|
U.S. 10-Year Treasury Bond yield |
1.52% |
1.73% |
(8.0)% |
13.8% |
|
|
|
|
|
Cdn. 10-Year Bond CGB yield |
1.43% |
1.66% |
(12.2)% |
16.1% |
|
|
|
|
|
Recession Watch Spreads |
|
|
|
|
|
|
|
|
|
U.S. 2-year 10-year Treasury spread |
0.79% |
0.24% |
(36.8)% |
(69.6)% |
|
|
|
|
|
Cdn 2-year 10-year CGB spread |
0.48% |
0.28% |
(20.0)% |
(41.7)% |
|
|
|
|
|
|
|
|
|
|
|
|
|
|
|
Currencies |
|
|
|
|
|
|
|
|
|
US$ Index |
95.59 |
98.67 (new highs) |
2.1% |
3.2% |
up |
up |
up |
|
|
Canadian $ |
.7905 |
0.7848 |
(0.2)% |
(0.7)% |
down |
down |
up |
|
|
Euro |
113.74 |
109.32 (new lows) |
(3.0)% |
(3.9)% |
down |
down |
down |
|
|
Swiss Franc |
109.77 |
109.02 |
1.0% |
(0.7)% |
up (weak) |
neutral |
up (weak) |
|
|
British Pound |
135.45 |
132.43 |
(1.3)% |
(2.2)% |
down |
down |
neutral |
|
|
Japanese Yen |
86.85 |
87.07 |
0.6% |
0.3% |
neutral |
down |
down |
|
|
|
|
|
|
|
|
|
|
|
|
|
|
|
|
|
|
|
|
|
|
Precious Metals |
|
|
|
|
|
|
|
|
|
Gold |
1,828.60 |
1,966.60 |
4.2% |
7.6% |
up |
up |
up |
|
|
Silver |
23.35 |
25.79 |
7.4% |
10.5% |
up |
up |
up |
|
|
Platinum |
966.20 |
1,116.80 |
6.4% |
15.6% |
up |
up |
up |
|
|
|
|
|
|
|
|
|
|
|
|
Base Metals |
|
|
|
|
|
|
|
|
|
Palladium |
1,912.10 |
2,981.90 (new highs) |
26.1% |
56.0% |
up |
up |
up |
|
|
Copper |
4.46 |
4.94 (new highs) |
10.0% |
10.7% |
up |
up |
up |
|
|
|
|
|
|
|
|
|
|
|
|
Energy |
|
|
|
|
|
|
|
|
|
WTI Oil |
75.21 |
115.68 (new highs) |
26.3% |
53.8% |
up |
up |
up |
|
|
Natural Gas |
3.73 |
5.02 |
12.3% |
34.6% |
up |
up |
up |
|
Source: www.stockcharts.com, David Chapman
Note: For an explanation of the trends, see the glossary at the end of this article.
New highs/lows refer to new 52-week highs/lows and, in some cases, all-time highs.
Source: www.stockcharts.com
Ukraine tensions are roiling global stock markets. With the exception of the commodity-based TSX Composite and its small cap cousin the TSX Venture Exchange (CDNX), global stock markets fell this past week some to new lows. Yes, the TSX Composite was up 1.4% on the week while the CDNX gained 1.3%. The rest weren’t so fortunate. Ukraine tensions roiled them. The S&P 500 was down 1.3% as was the Dow Jones Industrials (DJI). The Dow Jones Transportations (DJT) also bucked the trend, rising 1.2% as many transportation stocks that are benefitting from inflation and supply disruptions rose on the week. The NASDAQ fell 2.8% while the small cap S&P 600 fell 0.9%. Some indices like the KBW Bank Index fell harder. The KBW was down 7.7%. The S&P 400 mid-cap dropped 1.7%, and the Semi-Conductor Index (SOX) was off 5.6%.
In the EU, the London FTSE fell 6.4%, the Paris CAC 40 dropped 10.2%, and the German DAX hit 52-week lows down 10.1%. The Euronext 100 dropped 9.1%, the Brussels Exchange was down 7.4%, and the Netherlands Index -7.7%. Proximity to Russia hurts stock exchanges it appears. In Asia, the losses continued although China’s Shanghai Index (SSEC) hung in, down only 0.1%. The Tokyo Nikkei Dow (TKN) dropped 1.9%. Singapore lost 2.1% while Hong Kong fell 3.8%. India’s Nifty Fifty dropped 2.5%. War has consequences even for stock markets. The MSCI World Index fell 3.5%. But for some cheer Bitcoin rose 3.5%, although it was falling again at the end of the week. Bitcoin and the cryptos were being helped by rumours that Russia was using cryptos to get around sanctions.
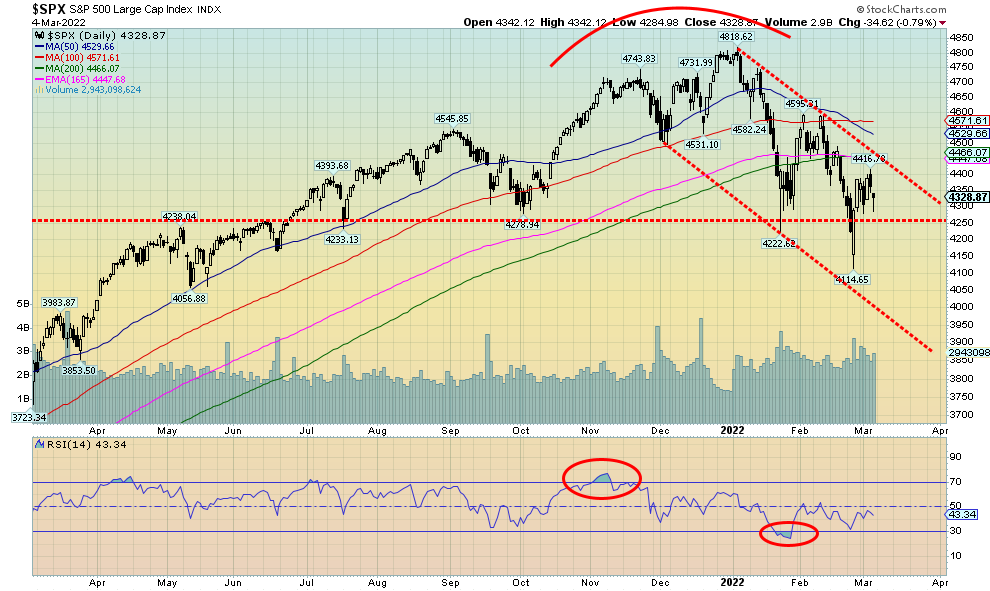
We see little to suggest we are at or near a bottom. The NYSE advance/decline line is falling in line with the S&P 500. The McClellan Summation Index (RASI) is in bear territory. The percentage of stocks trading above their 200-day MA is at 45%. A good low could be around 5–15%. Only 35.5% of stocks are above their 50-day MA. The S&P 500 Bullish Percent Index is at 41.6%. A good low could see it around 5–25%. Hard to believe but the CBOE put/call ratio is at 0.67, well below the 0.80 plus we need to see if we want to suggest a bottom. So far, it has barely poked its head over 0.80 and only briefly. Buying the dip and the belief that this will soon clear up appears to keep many on the buy side. The VIX Volatility Index is rising but below recent highs. However, the VIX has broken out and suggests that it should move higher. The VIX is currently at 32, if it went over 40, it would break out again. The March 2020 high was 82.7. The VIX moves inversely to the S&P 500.
We believe we are now in the early stages of the next wave to the downside. As to potential targets, that is not clear just yet but a break to new lows under 4,115 could suggest a decline to 3,800. At that point the S&P 500 would be down 21% from its all-time officially in bear territory. At this point the S&P 500 is down just over 10% from its all-time officially in correction territory.
The war in Ukraine is weighing on markets especially in the eurozone. But we wonder if the market grasps the potentially negative impact of sanctions and how sharply rising prices because of supply shortages and disruptions could disrupt the markets. The Fed is widely expected to hike 25 bp at the FOMC March 14–15. There are few signs yet that the economy is slowing, but negative signs are creeping in. Only above 4,600 could we call this bear move over and the expectation would be that the stock markets could rise from there. Otherwise, the trend is now down with no sign yet of a bottom.
Source: www.stockcharts.com
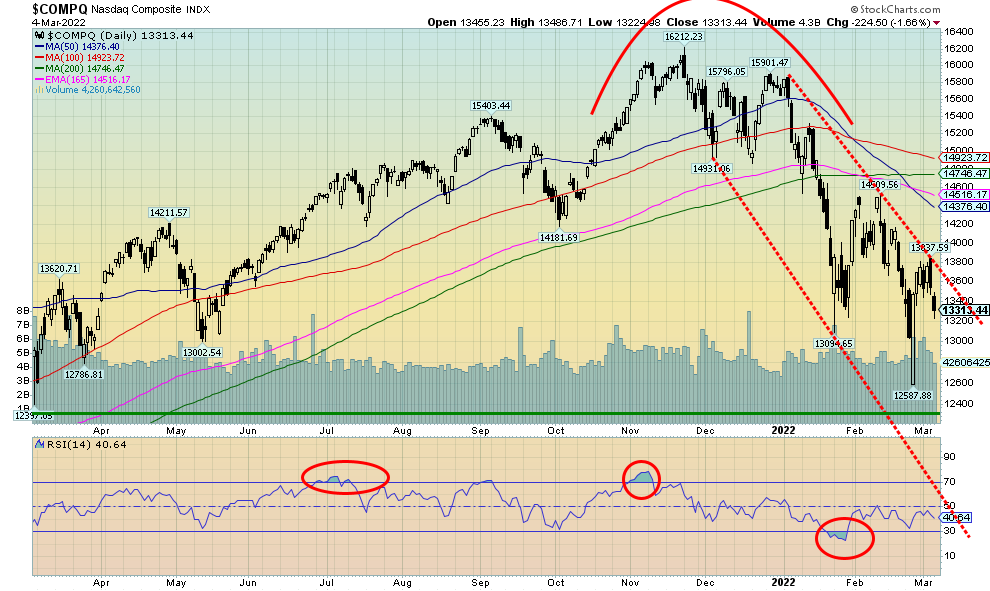
Tech stocks continue to get hit and that translates into the ongoing fall of the NASDAQ. This past week the NASDAQ led the way down, losing 2.8%. The NASDAQ is now down 14.9% on the year and off almost 18% from its high. At the recent low the NASDAQ was down 22.4% from its all-time high in bear territory. The NASDAQ continues to hold its bear channel, bouncing off its high this past week before starting what looks like the next wave to the downside. We don’t even want to contemplate where the bottom of the channel is. The NASDAQ advance/decline line is falling in line with its decline. The AD line has taken out lows seen in 2018 and 2020 and is staring at the lows of 2016. Only 19% of NASDAQ stocks are above their 200-day MA and 22.8% are above their 50-day MA. The NASDAQ Bullish Percent Index is at 34.3%, still well above lows seen in March 2020. Resistance is now seen at 13,800 and only above that level could we start to consider that a low is confirmed. Under 13,000 new lows are probable.
Source: www.stockcharts.com
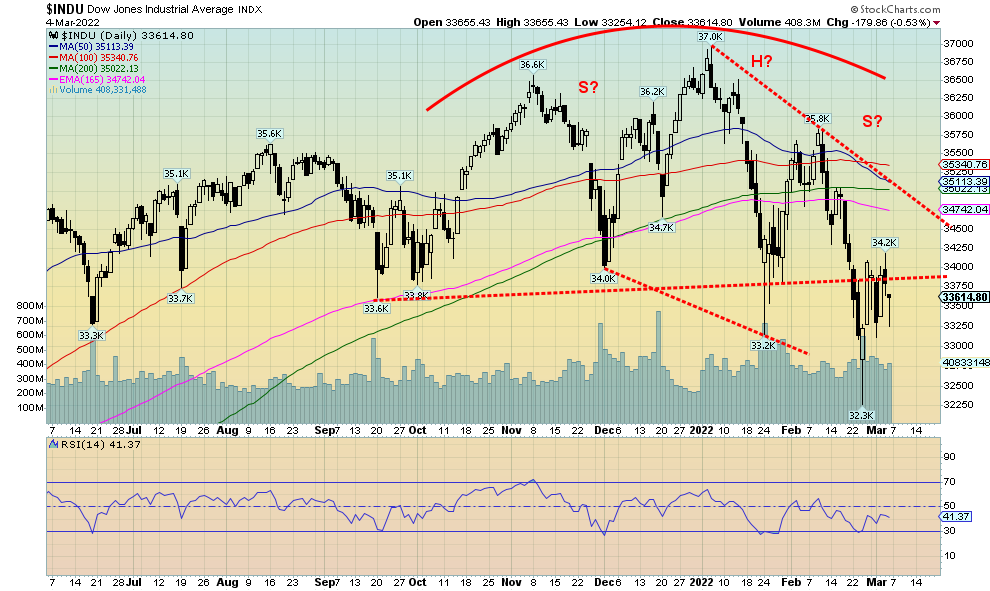
We had noted earlier the possible awkward-looking head and shoulders top of the DJI. It is interesting that following a breakdown under our neckline, the bounce-back basically only took it back to that line. Are we now starting a new leg to the downside? Friday’s action keeps giving hope to the bulls who continue to buy every dip, it seems. However, as far as we are concerned, that the DJI has closed under 34,000 suggests to us we are going lower. As long as the DJI remains under 34,500 resistance, the odds continue to favour the downside. Over 50% of the DJI components are trading below their 40-week MA (280-days), putting them officially in a bear market. The DJI is down about 10% from its all-time high seen the first week of January. As can be seen, it is trading below all of its major daily MAs. Only above 35,500 do we stand a chance of regrouping and heading higher.
o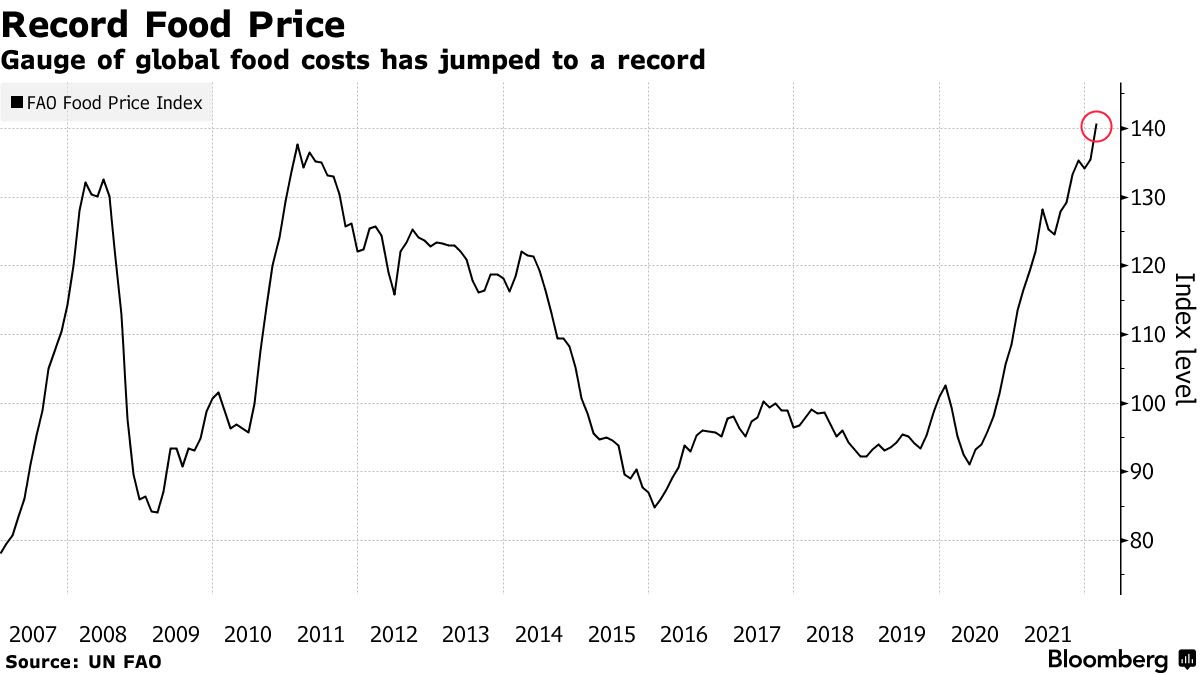
Source: www.bloomberg.com, www.fao.org
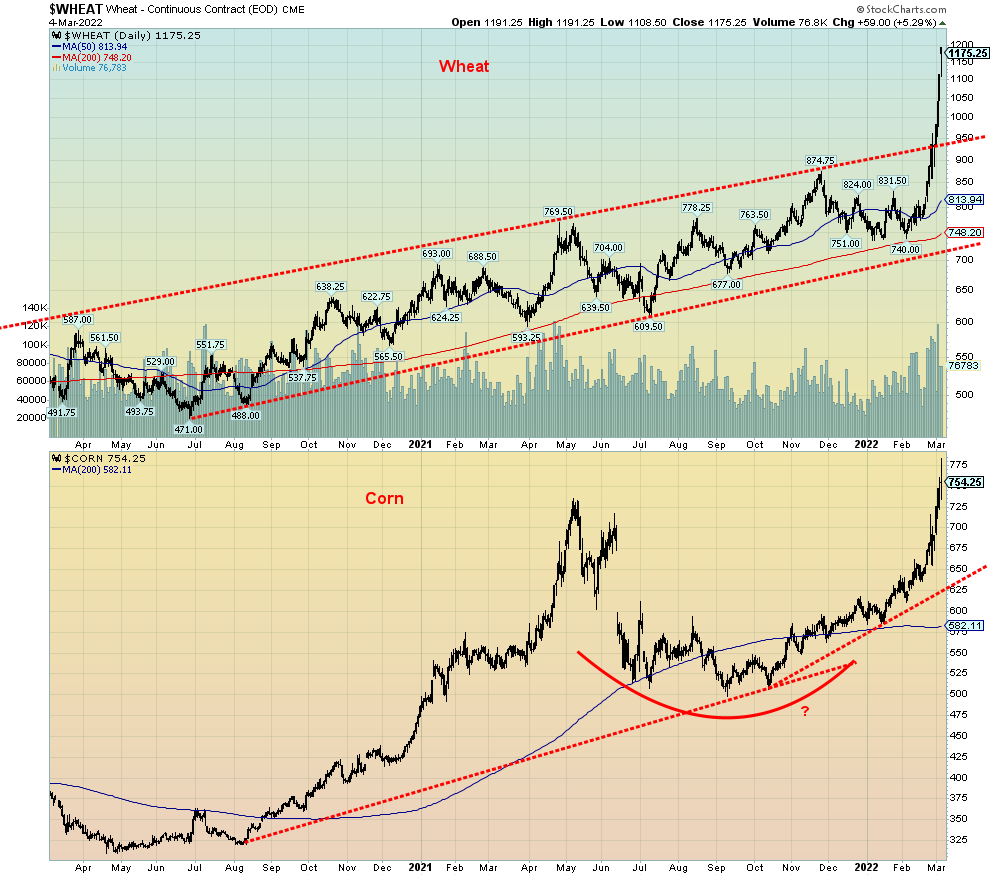
Food prices are soaring. The UN’s food price index jumped 4% in February. So, if you are wondering why you are paying more in the grocery store, this chart and the one below tell it all. Corn and wheat prices have soared to new highs. No, they are not all-time highs just yet but they are getting close. Wheat’s high was $1,349.50 in 2008 and corn’s was at $849 in 2012. From a low at 740.0 earlier just this year wheat is up 59%. Corn has jumped 47% since mid-October 2021. As to the UN index above it has hit an all-time high. Much of the rise is due to the spike in vegetable oils, a product used in at least half of supermarket goods. The sharp rise in food prices could exacerbate a global hunger crisis. Ukraine and Russia produce roughly 30% of all of the wheat plus many other food stuffs. A ban on fertilizers, of which again, Russia is a major producer could make things even worse. Russia contributes to 23% of ammonia production, 14% of urea, and 21% of potash production. But the ban is not a blanket ban. Because of the ban on Russian ships the products can’t get to market anyway. Russia has said that shipments will resume when they lift the shipping ban preventing these products from getting to market. We are reminded that sharply rising food prices back in 2011 sparked the Arab-Spring revolts. A big part of Russian/Ukraine wheat shipments go to the Middle East and Africa. Unintended consequences.
Source: www.stockcharts.com
Source: www.stockcharts.com
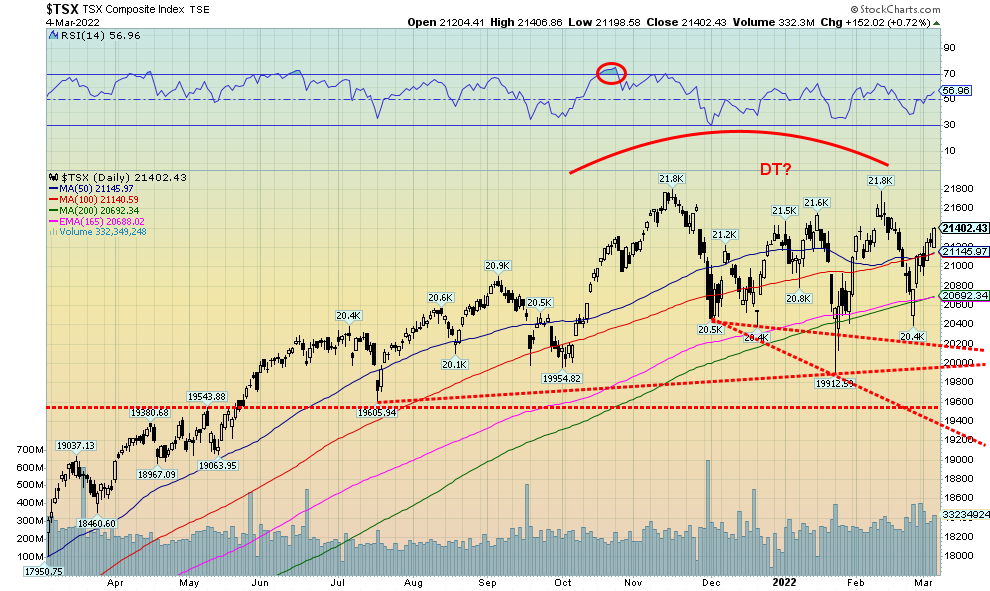
The commodity-based TSX Composite is the star. Rather than follow the U.S. indices to the downside, the TSX Composite bucked the trend and rose 1.4% this past week. The small cap TSX Venture Exchange (CDNX) was also up 1.3% but has been sluggish. The prime catalyst was the commodity-dominated sub-indices. Leading the way were Golds (TGD) up 8.6%, Metals & Mining (TGM) up 8.4%, and Materials (TMT) up 8.1%. Energy (TEN) helped as well, up 6.6%. All four sub-indices hit fresh 52-week highs. A surprise was Telecommunications (TTS), jumping 3.7% also to new 52-week highs which was also an all-time high. BCE Corp. is considered a safe haven and pays a healthy dividend of 4.9%. Five of the TSX sub-indices fell on the week led by Health Care (THC), down 8.0%. Consumer Discretionary (TCD) was also a big loser, down 6.9% on fears of plummeting consumer confidence and an economic slowdown. Information Technology (TKK) continued its losing ways, down 5.2%.
Despite all the good news, the TSX Composite continues to trace out what appears as a topping pattern with still some potential of it being a double top. Triple tops are rare. It is, however, an awkward-looking top. If we can firmly exceed 21,800, then the odds favour higher. Danger is under 20,700 and we break down under 20,200. Long-term support is visible near 19,600.
U.S. 10-year Treasury Bond/Canadian 10-year Government Bond (CGB)
Source: www.tradingeconomics.com, www.home.treasury.gov, www.bankofcanada.ca
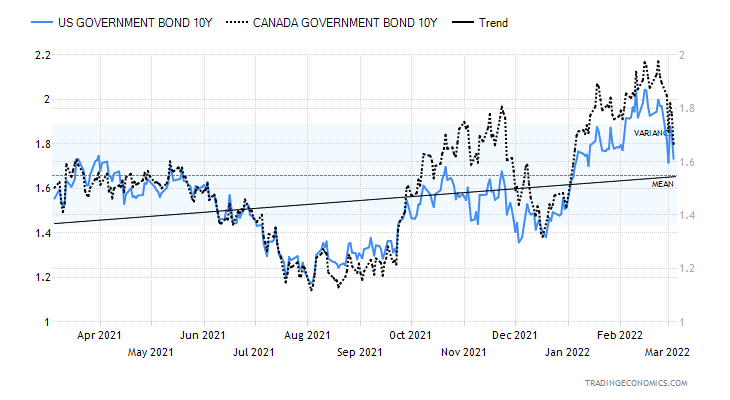
Gold and U.S. treasuries have become safe havens. Both gold and U.S. treasuries rallied this past week. U.S. bond prices rose (yields fell as they moved inversely to prices). The 10-year U.S. treasury note hit a high of 1.88% this past week, then fell to close at 1.73%. The Canadian 10-year Government of Canada bond (CGB) also fell to 1.66%. They were down 8% and 12.2% respectively. We are also seeing the yield curve flatten even more as the 2–10 spread fell to 0.24% from 0.38% the previous week. In Canada, the 2–10 spread dropped to 0.28% from 0.35%. The yield curve is flattening rapidly. It could soon invert and every time over the past 50 years the yield curve went negative a recession soon followed. What you are seeing is the buying of long U.S. treasuries as a safe haven but the selling of short-term securities over fear of rising interest rates. The FOMC meets on March 14–15 and the wide expectation is that the Fed will hike 25 bp. Even Jerome Powell supported that assumption in a speech this week. The hike is probably coming despite the background noise of the Ukraine invasion and its potential threat to the world economy. This past week the Bank of Canada (BofC) did hike interest rates 25 bp as expected. The strong U.S. job numbers release on Friday also support the notion of a rate hike. While we are seeing signs of a potential recession (inflation above 5%, narrowing yield curve, sharply rising oil prices), a recession is most likely still months away as economic numbers continue to be growth supportive. The unknown is what the ultimate financial impact of the Russian invasion will be. The 10-year has support down to 1.68% and then down to 1.54%. Below 1.50% yields could fall further. The high so far is 2.05%. The real line in the sand is at 1.40% as below that level we could fall back to 1.20% and even 1.00%.
Source: www.stockcharts.com
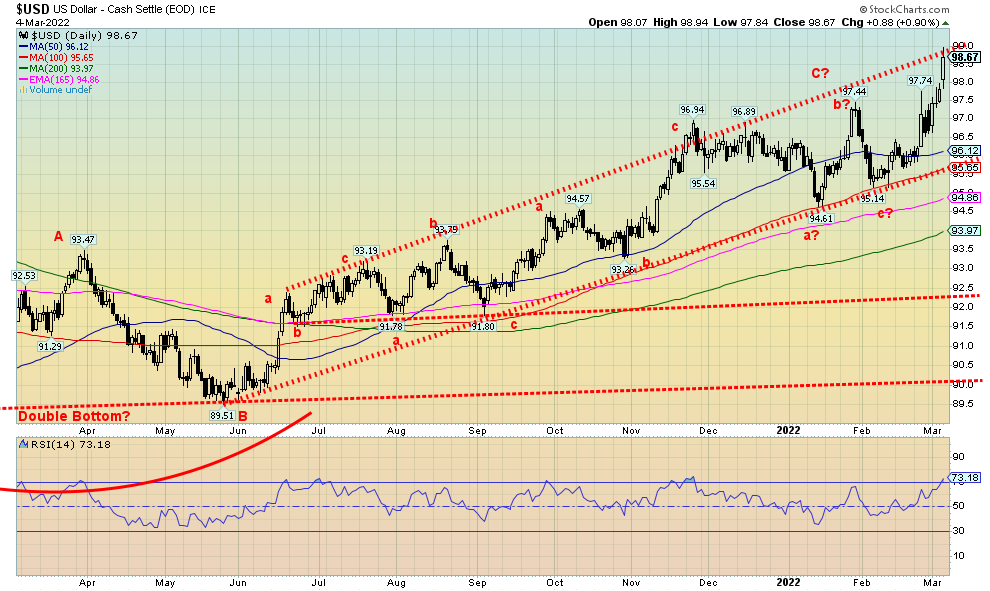
The U.S. dollar is a safe haven. This past week the US$ Index hit fresh 52-week highs and also hit the top of our channel, closing at 98.67 up 2.1% on the week. The euro hit fresh 52-week lows, falling almost 3.0%. The Swiss franc, however, has caught some safe haven status as it rose about 1.0%. Ditto for the Japanese yen, up 0.6% on the week. But the pound sterling fell 1.3% while the Canadian dollar dropped a small 0.2%. The euro is falling as funds flee the zone out of fear of the war in Ukraine and the fear of contagion on eurozone banks if Russia were to default on its debt and because of sanctions blocking payments through SWIFT. As well, it is no surprise that there are many Russian entities that have dollar-denominated debt. Now they can’t access SWIFT so they can’t make their payments. These losses then ultimately end up on the books of eurozone banks and even some U.S. banks. With Russia unable to pay, Western banks scramble to cover their positions which could result in them dumping assets. It is not something that happens overnight. Ultimately, it could take weeks.
With the US$ Index that makes all U.S. dollar-denominated debt held by foreigners risky. Their earnings are in their home currency but they pay U.S. dollars for their debt. As their currency falls they need more of their currency to purchase U.S. dollars. And that in turn could lead to financial stress in other countries as well. The world is interconnected financially. Take out a major cog even like Russia and things could soon fall apart.
We are at the top of a channel so we could pull back from here. But a top doesn’t start to present itself until we at least fall back under 97.50. Under 96.00 it would be over.
Source: www.stockcharts.com
In times of geopolitical and financial turmoil, investors turn to gold. Gold has been money for upwards of 3,000 years.
Lydia, Croesus 565–546 BC Gold Stater 8.08 gr.
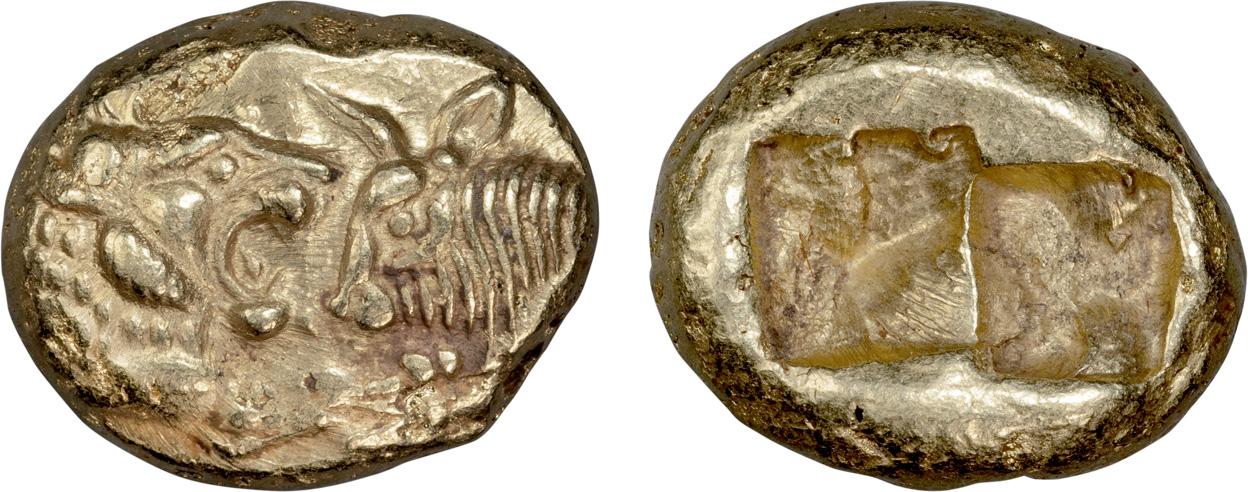
Source: www.hjbltd.com
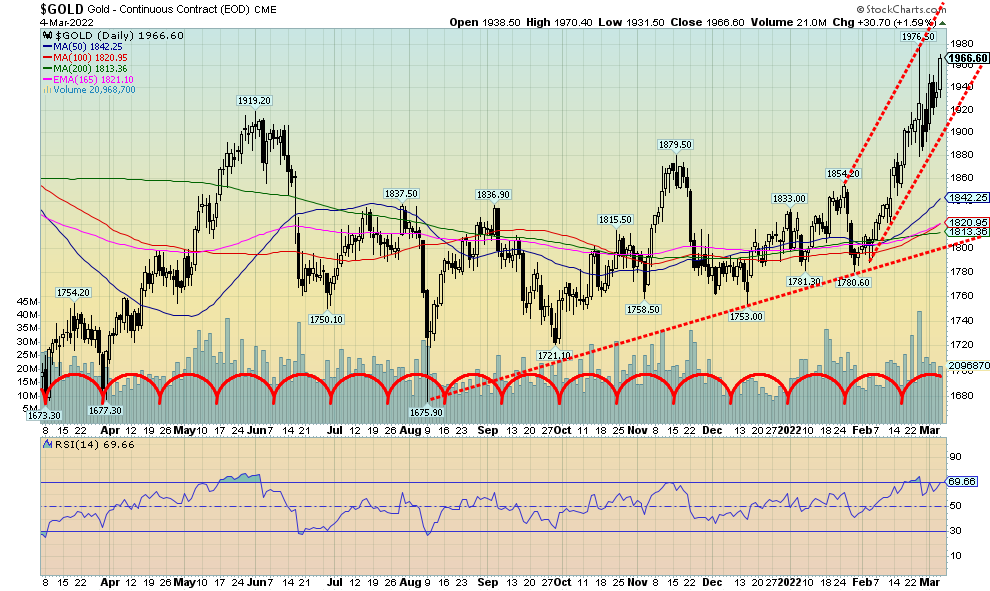
Gold prices rose to a 52-week high close this past week, although they fell just short of the 52-week high seen on February 24 at $1,976.50. It was fourth consecutive weekly rise. In closing over $1,950/$1960 resistance, the odds have increased considerably that we could soon see $2,000 and challenge the August 2020 high of $2,089. Above $1,990/$2,000, the odds increase sharply that we’ll see new all-time highs. We continue to have targets up to $2,200/$2,400 based on the huge cup and handle that formed from 2011 to 2022. We are now breaking out of the handle.
But gold wasn’t the only one of the metals leaping to new highs this past week up 4.2%. Copper and palladium both soared to new all-time highs. Palladium prices were up 26.1% on the week and briefly went over $3,000. Copper jumped 10.0% on the week. As well, silver was up 7.4% and platinum gained 6.4%. Russia is the world’s largest palladium producer, providing 40% of global supply. Palladium is needed by the West and the West’s sources are not large. Russia also holds the world’s largest reserves of palladium with over 50%. One company, Norilsk Nickel, produces 41% of the world’s total. Yes, it is a Russian company. A huge company that also produces nickel, cobalt, rhodium, silver, gold, and more.
If there is a concern about the gold price it is that Russia winds up having to tap into its gold reserves to raise funds. Given that sanctions have frozen upwards of 50% of its foreign reserves in other central banks, only their gold reserves, held in Russia, and yuan bonds, held with PBOC are currently available. As we noted earlier, not allowing Russia access to its funds in the global central banks now puts the holding of reserves with central banks in question. While it is not the first—Afghanistan, Iran, and Venezuela are others—it does raise a lot of questions of safety and could ultimately question the U.S. dollar as the world’s reserve currency. One would be better off holding gold where you store it with yourself and is nobody’s liability.
Gold has been rising despite a rising US$ Index that hit 52-week highs this past week. Normally, as the US$ Index trades higher, gold trades lower. Not this time as it appears that both gold and the U.S. dollar via U.S. Treasuries are safe havens. Still, some maintain a bearish stance towards gold. We have noted the divergence between gold and silver where gold has been making new highs but silver has not. But gold now appears poised to embark on a potential runaway move. Silver has to follow and also has to make new highs or our bearish concerns will begin to take stronger hold. We also note some concerns over the falling commercial COT.
Next resistance is up to $2,000/$2,020 with some at $1,980. The high so far is $1,976.50. Support is seen at $1,920 and under $1,900 we could fall swiftly. Under $1,880 the rally could be confirmed over. As we go higher, keep raising stops particularly for the gold stocks. At the end of the day gold stocks are not gold and they do have liability. They are, however, leveraged to the gold price.
Source: www.stockcharts.com
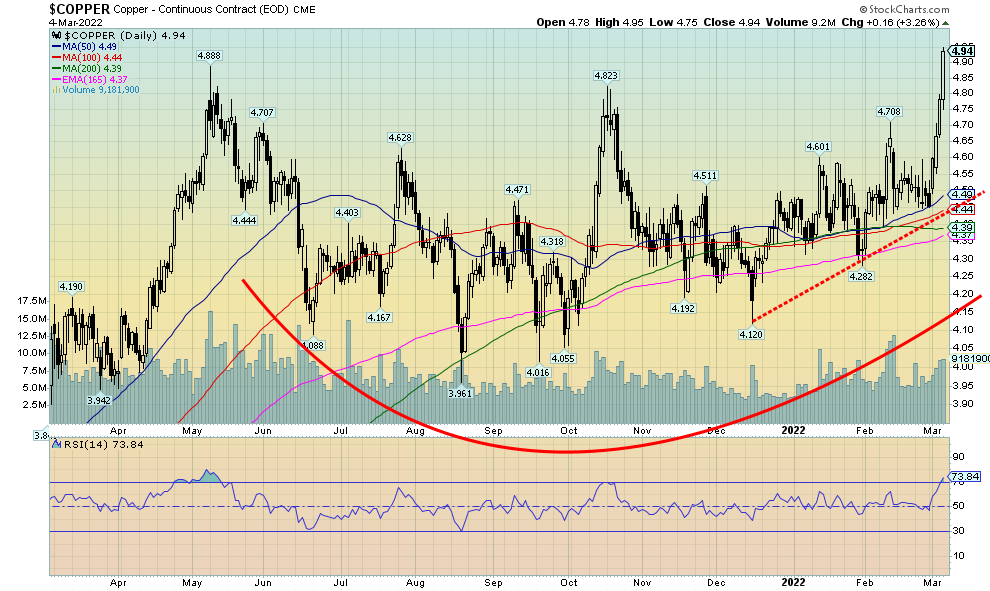
We thought we shouldn’t ignore copper prices as they hit 52-week highs this past week with a gain of 10.0%. Russia produced 820 thousand metric tonnes in 2021, the world’s eighth largest producer. Russia has 61 million metric tonnes in reserves, the world’s fourth largest. Copper, as with many other commodities is being caught up in the Russian invasion of Ukraine as supply shortages develop and supply chain disruptions deepen. Copper, along with many other commodities, soared this past week as supply chains faced disruptions, with banks and shipowners refusing payment or shunning bookings. All of this is exacerbating shortages and feeding sharply rising inflation. It is the worst crisis since the 1973/1974 Arab oil embargo. And, given what is going on, it could get worse, a lot worse. Not only did copper hit 52-week highs this past week, but it was an all-time high. And copper appears to be breaking out of a long period of consolidation. Arguably, we could suggest that copper has targets up to $5.80. We are a bit overbought with the RSI at about 74—but overbought is just a state of mind and it could stay overbought longer than shorts can stay solvent. Support is down to $4.70, then down to $4.40. Below $4.40 the rally is officially over.
Source: www.cotpricecharts.com
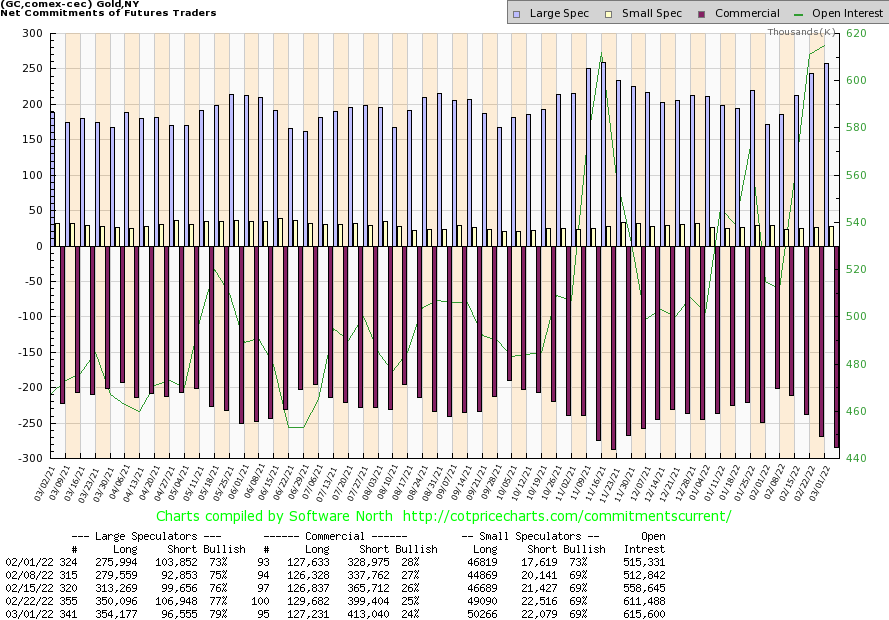
The gold commercial COT (bullion companies and bullion banks) fell to 24% this past week from 25% the previous week. The large speculators COT (hedge funds, managed futures, etc.) rose to 79% from 77%. Commercials long open interest fell over 2,000 contracts while short open interest rose almost 14,000 contracts. For large speculators it was the opposite as long open interest rose over 4,000 contracts while short open interest fell over 10,000 contracts. Overall open interest rose over 4,000 contracts as gold enjoyed an up week. While the fall for the commercial COT is of concern, it doesn’t mean the rally is over—just yet. Commercials have a history of selling into rallies so this is not unusual or a surprise. What’s key will be how it plays out in the coming weeks. The COT continues to be worth monitoring. At 24% it sends a note of caution given the sharp rally that appears to be underway.
Source: www.stockcharts.com
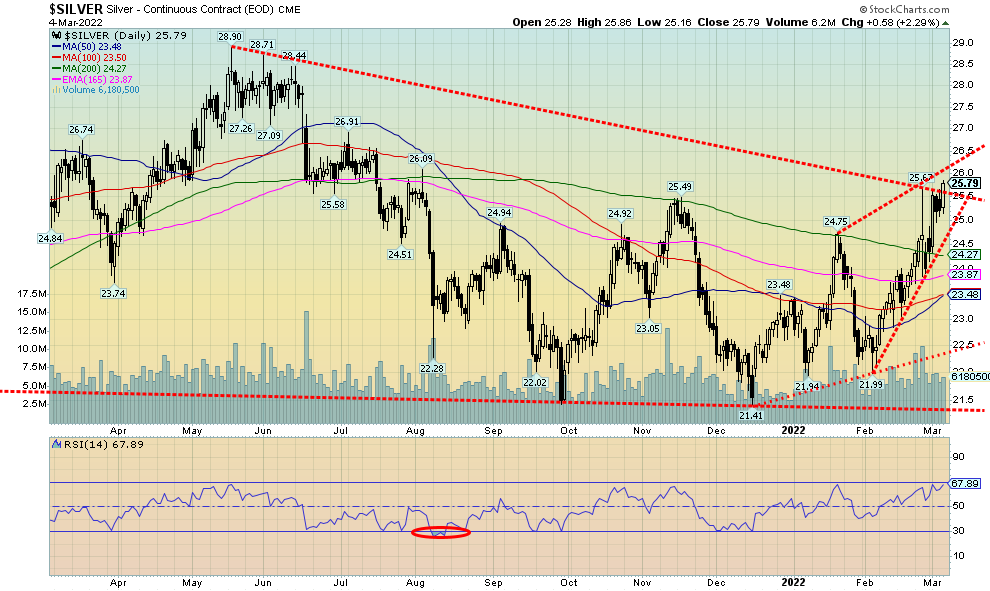
Silver prices are finally starting to move higher and appear to have broken out of resistance at $25.50 with a high this week of $25.86 and a close at $25.79. If that’s correct, then we could finally get a move in silver. We have continued to be bothered by the fact that gold has been making new highs while silver has not. A divergence. Arguably, we could also say that silver could be starting to form an ascending wedge which is bearish. A sudden breakout over $26.50 could end the wedge pattern. As to targets, we could project up to $31 or even higher to $33. That’s as high as we can calculate for the moment. There is resistance along the way at $26.50/$27 then up to $29. Above $29 silver looks higher. Russia is a silver producer, producing some 42.5 million ounces in 2020, the sixth highest in the world. Russia has silver reserves of 45,000 metric tonnes, the fourth highest in the world. (The world’s largest producer is Mexico while Peru holds the world’s largest reserves.) Silver is a key industrial component. The gold/silver ratio is currently at 76.26 still high. It starts to break down under 72, the but reality is the ratio needs to get down to around 50 to start to make silver meaningful vs. gold. In 2011, at the last peak for prices of gold and silver, the gold/silver ratio fell to 31.50.
Silver’s support is now at $25. A breakdown under that level could suggest that the rally is over. We are not yet overbought so there is room to move higher.
Source: www.stockcharts.com
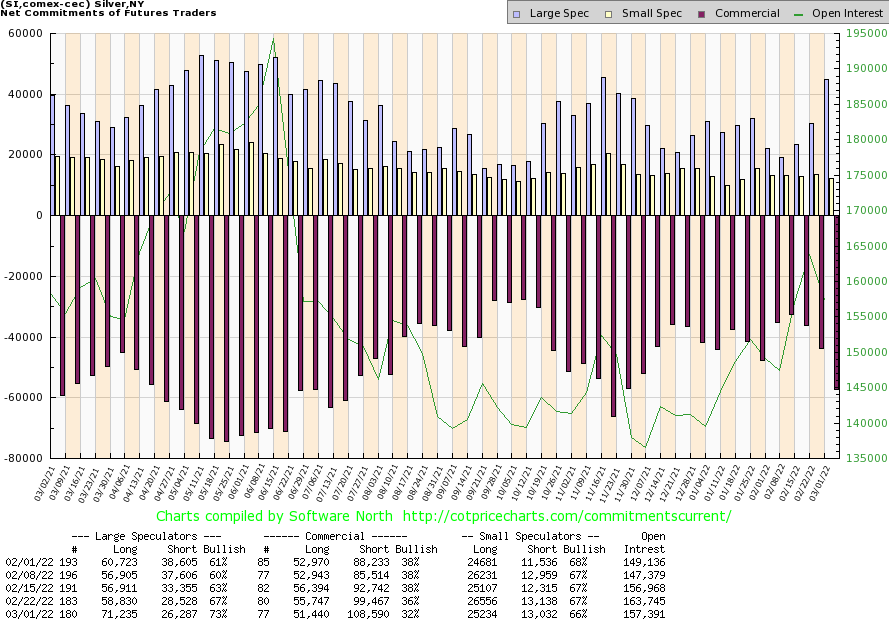
As with the gold commercial COT, the silver commercial COT slipped this past week to 32% from 36% a dramatic drop. Long open interest fell just over 4,000 contracts while short open interest jumped around 9,000 contracts. The large speculators COT jumped to 73% from 67% as they added almost 13,000 longs while cutting their shorts by just over 2,000 contracts. On the week, open interest fell over 6,000 contracts on an up week. That’s not exhibiting a lot of strength so this will need to be monitored. It doesn’t necessarily mean the market is about to turn down but it could be a signal to be careful with this rally.
Source: www.stockcharts.com
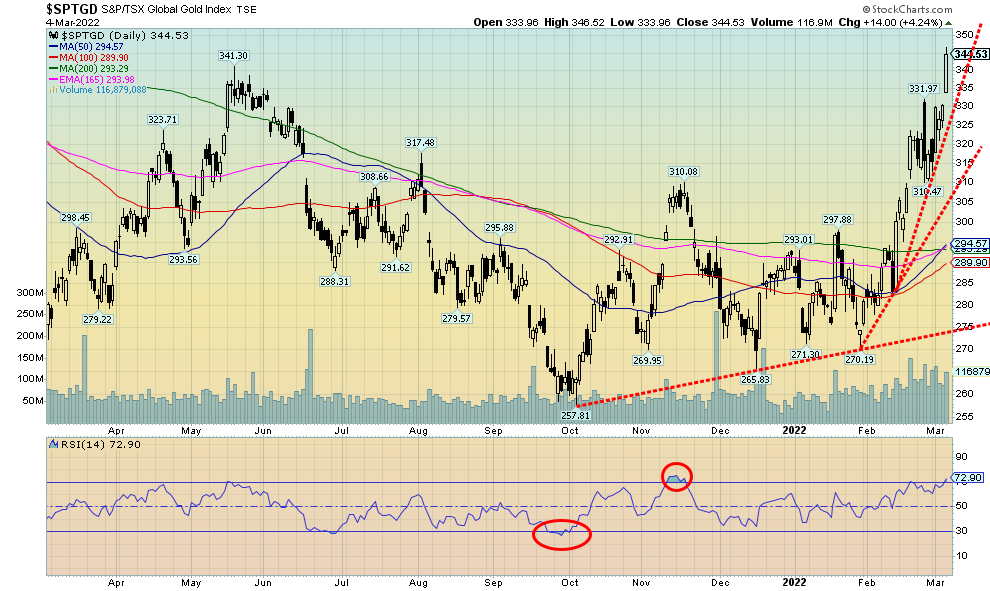
With gold prices, gold stocks have caught a bid. This past week the gold stock indices jumped to fresh 52-week highs. That’s something we haven’t seen for some time. The TSX Gold Index (TGD) hit fresh 52-week highs but the Gold Bugs Index (HUI) fell short. Both were up 8.6% this past week. Gold stocks in 2021 were miserable but not in 2022 as the TGD is up 17.9% and the HUI up 17.7% so far. With the leap to new highs, the probability now is that there is more to come. The TGD has a target up to 380 while the HUI’s target is 370. That’s another 10% move for the TGD. The all-time high for the TGD was at 455 back in 2011. That’s an additional 32% move from current levels. The TGD gapped higher on Friday (low 333.96 vs. high of Feb 24 at 331.97). Given that this appears to be in the middle of an up move, this could be a runaway or measuring gap. If that’s correct, then we are only about half-way through the move. That points to a potential target at 385, close to our other target at 380. What’s key is that, first, we don’t close that gap. Second, if it does go back through the gap, we’d need to hold above 310. Below 310 the rally is probably over. With an RSI at 72 the market is overbought but we have seen moves in the past where the RSI remained at or above 70 for upwards of a month as the market moved relentlessly higher. The gold stocks market is small so it does not take a huge shift of funds to move the market quickly.
Source: www.stockcharts.com
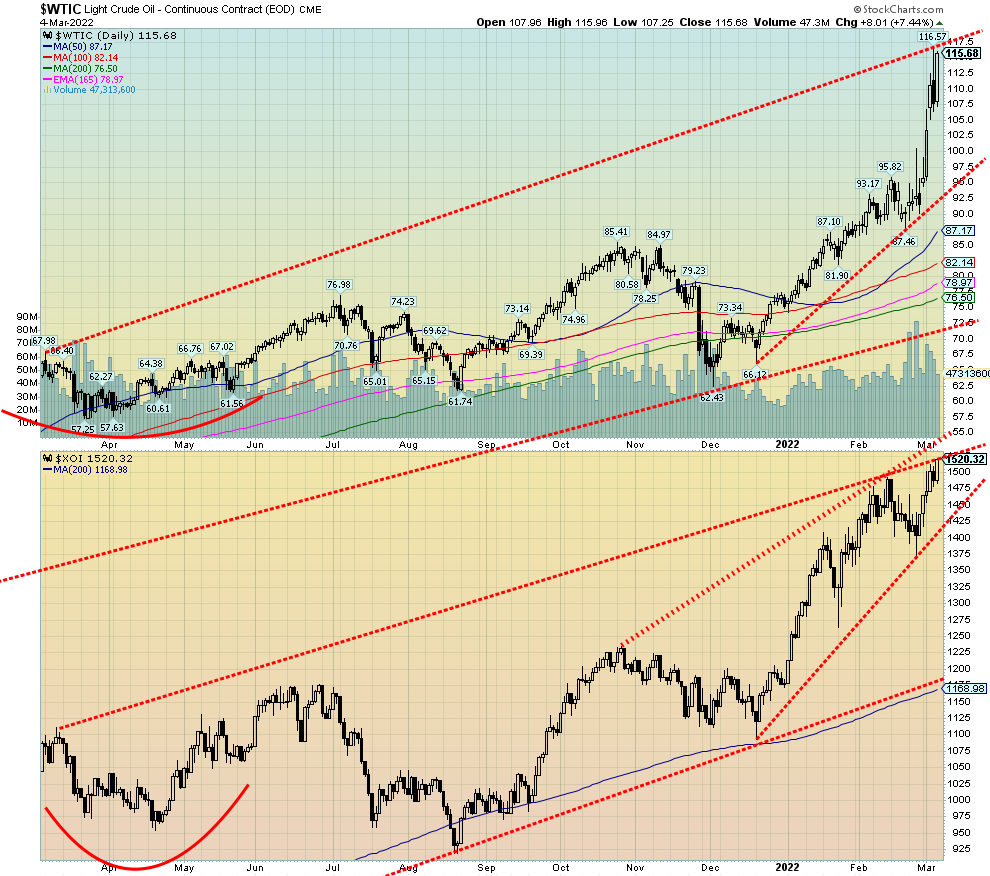
Higher and higher. Brent crude came close to $120 this past week while WTI oil hit $116.50. It was a dramatic week as the global oil market has been thrown into chaos by the Russian invasion of Ukraine. While no sanctions have been placed on Russian oil, there are estimates that upwards of 70% of Russian oil exports can’t be touched because Russian ships carrying oil can’t dock and with some Russian banks being blocked from SWIFT payments can’t be made. Russian oil is being boycotted in tenders because no one is bidding and refiners are shunning Russian crude even as they scramble to find alternative sources that really don’t exist. WTI oil rose 26.3% this past week while Brent crude jumped 24.2%. Natural gas (NG) was not immune to the chaos as it too jumped up 12.3% on the week. The energy stocks enjoyed another banner week with the ARCA
Oil & Gas Index (XOI) jumping 5.9% and the TSX Energy Index (TEN) up 6.6%. Everybody was hitting fresh 52-week highs, except for NG. NG still has a way to go to reach the $6.47 high seen back in October 2021.
So how high could WTI oil go? And it is not just oil prices that are rising as the cost of insurance and freight rates are also leaping. Talk of $150 oil is now not uncommon. Of course, all this could change tomorrow if there were ceasefires but it would not change the move to sanctions nor blockage of SWIFT and refusal to allow Russian ships to dock. And no one is counting on OPEC to bring down the price as they have made it clear they are not going to up their production just to keep the West happy. Releasing oil from strategic reserves is merely a distraction. The announcement this week was for the release of 60,000,000 barrels. 60 million? About two-thirds of a day’s worth of global consumption or three days of U.S. consumption? And the release comes at a time when strategic reserves are low. U.S. strategic reserves are already at levels last seen in 1999. Others such as China have been trying to build strategic reserves so that just adds to the demand.
The U.S. relies on Russia for some of its daily oil consumption. There have been calls to ban it. That would feed back into further price increases as there is no immediate other source. Calls are out to open the Keystone Pipeline or start drilling again. The trouble is, all of those take time and both Keystone and drilling in environmentally sensitive areas have faced stiff opposition from First Nations, environmentalists, and others, including in the courts. The U.S. has been importing roughly 90,000 bpd from Russia. Add in crude oil products and the U.S. was actually importing 405,000 bpd from Russia. Banning these would send crude prices even higher. In the EU we are hearing of blackouts. The EU gets some 30% of its oil from Russia and almost 40% of its gas. For some countries they are getting upwards of 100% of their needs from Russia.
Now that we have surpassed one of our targets of $108 for WTI oil, our next target level is $123 and $128. Being overbought is merely a state of mind because in a runaway move, which this is becoming, there is no such thing as a pause. We just keep climbing higher. The good news is that WTI oil is in backwardation. What that means is the highest price is spot crude. As you move further out along the futures curve, WTI oil prices fall. April 2022 futures closed Friday at $115.68. One year later the April 2023 futures closed at $90.65.
We could argue that both WTI oil and the XOI have reached the top of channels. However, these channels keep getting pushed higher. The result is, they are not that meaningful. What has to be a concern is that in a fast-moving market like this inevitably some large player is caught the wrong way. There are many traders out there who don’t believe this is sustainable or that the market is overbought, so a drop is coming. But in a runaway, all of those reasons are merely sputtering. Then we could be hearing of a large hedge fund blowing up when the margin calls come in.
WTI oil doesn’t break down until under $95. A pullback anywhere in between may just be a pause before the next assault at higher prices. Unlike 2008 when WTI started in January at a low of $85.42, it took six months to reach the high of $147.27 rising in a steady choppy manner. By December 2008 WTI had fallen to $35. This one instead has started to go straight up. This is a runaway market and it is difficult to predict where or when or how it will stop.
|
|

|
Technical Scoop March 7, 2022 From David Chapman, Chief Strategist dchapman@enrichedinvesting.com For Technical Scoop enquiries: 416-523-5454 For Enriched InvestingTM strategy enquiries and for Canadian Conservative Growth Strategy enquiries: 416-203-3028 |
Copyright David Chapman, 2022
|
GLOSSARY
Trends
Daily – Short-term trend (For swing traders) Weekly – Intermediate-term trend (For long-term trend followers) Monthly – Long-term secular trend (For long-term trend followers) Up – The trend is up. Down – The trend is down Neutral – Indicators are mostly neutral. A trend change might be in the offing. Weak – The trend is still up or down but it is weakening. It is also a sign that the trend might change. Topping – Indicators are suggesting that while the trend remains up there are considerable signs that suggest that the market is topping. Bottoming – Indicators are suggesting that while the trend is down there are considerable signs that suggest that the market is bottoming. |
Disclaimer
David Chapman is not a registered advisory service and is not an exempt market dealer (EMD) nor a licensed financial advisor. He does not and cannot give individualised market advice. David Chapman has worked in the financial industry for over 40 years including large financial corporations, banks, and investment dealers. The information in this newsletter is intended only for informational and educational purposes. It should not be construed as an offer, a solicitation of an offer or sale of any security. Every effort is made to provide accurate and complete information. However, we cannot guarantee that there will be no errors. We make no claims, promises or guarantees about the accuracy, completeness, or adequacy of the contents of this commentary and expressly disclaim liability for errors and omissions in the contents of this commentary. David Chapman will always use his best efforts to ensure the accuracy and timeliness of all information. The reader assumes all risk when trading in securities and David Chapman advises consulting a licensed professional financial advisor or portfolio manager such as Enriched Investing Incorporated before proceeding with any trade or idea presented in this newsletter. David Chapman may own shares in companies mentioned in this newsletter. Before making an investment, prospective investors should review each security’s offering documents which summarize the objectives, fees, expenses and associated risks. David Chapman shares his ideas and opinions for informational and educational purposes only and expects the reader to perform due diligence before considering a position in any security. That includes consulting with your own licensed professional financial advisor such as Enriched Investing Incorporated. Performance is not guaranteed, values change frequently, and past performance may not be repeated.
About the author


Website: https://www.enrichedinvesting.com
Disclaimer: David Chapman is not a registered advisory service and is not an exempt market dealer (EMD) nor a licensed financial advisor. We do not and cannot give individualised market advice. David Chapman has worked in the financial industry for over 40 years including large financial corporations, banks, and investment dealers. The information in this newsletter is intended only for informational and educational purposes. It should not be considered a solicitation of an offer or sale of any security. The reader assumes all risk when trading in securities and David Chapman advises consulting a licensed professional financial advisor before proceeding with any trade or idea presented in this newsletter. David Chapman may own shares in companies mentioned in this newsletter. We share our ideas and opinions for informational and educational purposes only and expect the reader to perform due diligence before considering a position in any security. That includes consulting with your own licensed professional financial advisor.