
“Tomorrow, is the first blank page of a 365-page book. Write a good one.”
—Brad Paisley, American country singer, songwriter; b. 1972
“For last year’s words belong to last year’s language
And next year’s words await another voice.”
—T.S. Eliot, American-British poet, essayist, publisher, playwright, literary critic, editor. Considered one of the 20th century’s greatest poets and a central figure in English-language Modernist poetry; 1888–1965
“Cheers to a new year and another chance for us to get it right.”
—Oprah Winfrey, American talk show host, television producer, actress, author, philanthropist; b. 1954
Goodbye 2020. Hello 2021. Or should we say good riddance 2020. Hope for better things in 2021. If you are a stock market investor, 2020 was a great year. Okay, there was that rather nasty hiccup in March, but since then markets have soared over 65%, finishing the year nicely in the green. Everybody soared— stocks, bonds, real estate, commodities, precious metals, cryptocurrencies. Ok, energy still ended the year in the red. But the star of the year in 2020 up 296% - Bitcoin. All hail Wall Street.
But for everyone else (Main Street) 2020 was a most unpleasant year, led by the COVID-19 pandemic. Globally, over 84 million official cases, 1.8 million dead and in the U.S. over 20 million cases, over 350,000 dead. On the surface that doesn’t seem much—roughly 1% of the world’s population, although over 6% of the U.S. population. But then the disease is quite contagious and can be quite deadly. Some estimates, however, have suggested that as many as 500 million may have been infected but were never diagnosed and/or it was mild and never reported.
Governments everywhere took unprecedented steps to limit the spread, resulting in lockdowns, bans on travel, and closure of businesses, with many going bankrupt, particularly those in the hospitality and retail sectors. As a result, unemployment soared and along with rising unemployment there was rising homelessness, food lines, domestic disputes and divorces, and mental health issues. There was also deepening polarization of society, driven primarily by huge wealth and income inequality, social unrest and protests, and deep divisions over the U.S. election where the incumbent president has still not conceded. As one pundit described it all, it was the equivalent of a live-action Sacha Baron Cohen movie, but then maybe he does exaggerate. It was also said that democracy was on the retreat in over 80 countries around the world as many governments used the pandemic as an excuse to clamp down on freedoms.
So, what will 2021 bring? The great hope is that the vaccine(s), which came out in record time, will work and put the world back together again so everyone can return to work. As well, governments everywhere will continue to pump out support payments to those negatively impacted by the pandemic. And central banks will continue with ultra-record-low interest rates and QE providing billions (trillions?) in liquidity to global markets everywhere. It is estimated that the global central banks have provided over $9 trillion in liquidity. The result is that stock markets and just about everything else have soared and they could continue to soar into 2021, regardless of signs of overvaluation, high sentiment, and indicators at extremes.
As to everyone getting back to work, well, that might take a lot more time. But many, particularly those in high-end jobs where working from home is easy, will continue to benefit, both by being employed and working from home. Great for at-home tech and furniture solutions, good for less traffic on the road, good for e-commerce, but bad for public transit, empty commercial towers, and empty retail stores dependent on foot traffic. As to the essential workers in consumer staples, tourism, and health care, who are also generally less well paid, they will continue to be overwhelmed and do have to report to work every day. The vaccines will be great, but they are not the panacea everyone thinks they are due to a slow roll-out, different companies with different medicines all claiming to be upwards of 90% effective, a fight over who should get it first, and potential side-effects.
So, what will all this bring us in 2021? Some believe it will be a lot better and the U.S. economy will soar upwards of 5%. After all, 100 years ago, following an even more devastating pandemic and the horrors of World War I that together killed over 70 million, the American economy soared in the 1920s. While the U.S. lost about 800,000 due to the war and pandemic, they entered the 1920s largely unscathed as the world’s leading economy. They were also unencumbered by debt as the federal debt/GDP was only about 10% and they were an exporter to the world.
Today, the U.S. is laden with a federal debt/GDP ratio of about 130%, they run multi-trillion-dollar budget deficits (estimated at upwards of $4.4 trillion for 2020) and they are no longer an exporter, as they carry an annual trade deficit approaching $900 billion. Spend now, worry about the deficit later. But spending has hit every G7 country and more as the world goes deeper in debt. The world is expected to contract by 5.2% in 2020. Per capita incomes have shrunk, not only in developed economies but also in emerging economies. A quick tally of GDP projections for 2020 in The Economist shows only three economies expected to grow in 2020: China, Taiwan, and Egypt.
While Egypt may have been a surprise, China and Taiwan were not. China is expected to grow roughly 1.8% in 2020 while Taiwan is expected to grow by 2.4% according to The Economist. So, what did they do right? Both economies are quite centralized. They locked down quickly. The lockdown was strictly enforced, particularly in China. They already had effective centralized response systems put in place following SARS. They have had low incidence in nursing homes. They also had continual temperature checking and a very effective and efficient contact-tracing system—in other words, everything that the EU and North America did not have. They were effectively, if militarily, managed. The West’s management was haphazard, slow to react, with many claiming, including senior political leaders, that it was all a hoax, or “don’t worry, it will be all over by supper”. China and Taiwan, particularly China, would also be less tolerant of objections and orders would be followed. In the West, protests and social unrest broke out over the wearing of masks and the closing of businesses.
China is the growing economic giant. It is estimated that China will surpass the U.S. sometime in the next decade as the world’s largest economy. Our chart below shows how quickly China is narrowing the gap. Grant you, that is GDP and not GDP per capita where the U.S. would still be ahead because China has a population estimated at 1.4 billion vs. the U.S. at 330 million. China has never been stronger. China anchors RCEP (Regional Comprehensive Economic Partnership), a free-trade zone that encompasses 2.2 billion people and one third of all economic activity on the planet. Two countries from North America are members: Canada and Mexico. The U.S. wasn’t even invited into the group. The EU and China have just signed a comprehensive trade deal over the objections of the U.S.
China is also actively leading the Belt & Road Initiative (BRI), a global infrastructure development strategy encompassing 70 countries, designed to improve regional integration, trade, and economic growth. It has met considerable resistance from the U.S. amid accusations that China is using it to control countries by burying them with debt. However, that is not much different than the criticism the U.S. had faced in the past over its control of the IMF and the World Bank. Confessions of an Economic Hit Man (John Perkins, 2004) was a reality for many a developing country. Given China’s economic clout and that the U.S. and China are locked in disputes, incoming president Biden will find it difficult to track a different path than his predecessor. But that won’t stop the growth and clout of China.
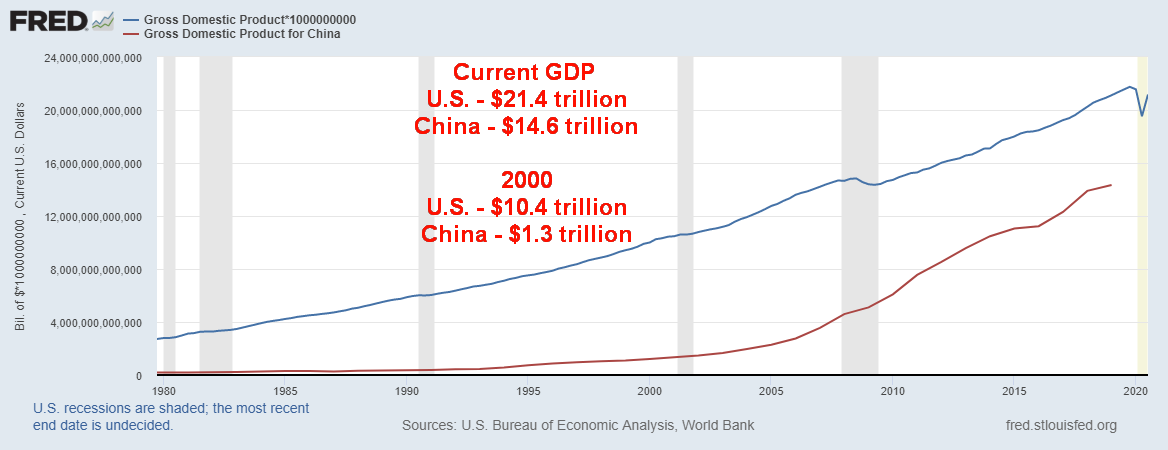
Source: www.stlouisfed.org
The driver of the markets has been the ultra-record-low interest rates that are here to stay, until at least 2023. That and massive amounts of liquidity through debt and QE. Our chart and table below show the growth of the U.S. Federal debt, M2 money supply, and the Federal Reserve’s balance sheet. Other countries in the EU and Canada have had the same experience. Left out on the chart is the increase in overall debt that includes debt not only of the Federal government but also states (provinces), municipalities, corporations (financial and non-financial), and consumer (primarily mortgages).
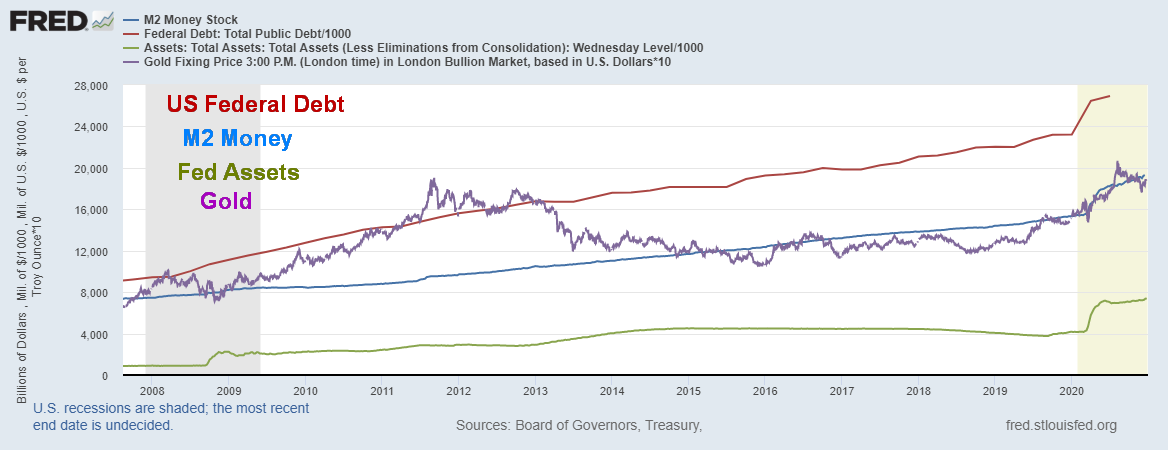
Source: www.stlouisfed.org
|
|
% Gain Since 2007 |
% Gain Since Mid-March 2020 |
|
US Federal Debt |
199% |
18.6% |
|
M2 Money |
159% |
19.5% |
|
Fed Assets |
731% |
58.6% |
|
Gold |
125% |
25.4% |
|
S&P 500 |
300% |
61.9% |
|
U.S. All Debt * |
56% |
5.8% |
Source: www.stlouisfed.org
Note: * All Debt includes Federal, states, municipalities, corporate (financial and non-financial) and consumer
All debt has increased at a slower rate than the U.S. federal debt. However, that is nothing to be complacent about as the biggest risk is not in the sovereign debt of the U.S. but in the corporate debt that is at record levels. Consumer debt is also high, and it is particularly high and a concern in Canada.
But the correlation between the rise of debt, M2 and the Fed’s (central banks) balance sheet, and the rise in the stock market is undeniable. With so much cash floating around it has to go somewhere and the place of choice is risk assets in the stock market or possibly gold. Given ultra-record-low interest rates, the bond market is not exactly appealing. This has nothing to do with an improving economy, and everything to do with too much money in too few hands fueling the rise in the stock market. The question on our mind is, could this fuel a blow-off move in both the stock markets and gold? There is evidence that it is clearly possible, but not guaranteed.
Our long-term chart of the NASDAQ shows the steady rise since 1980. The first phase in 1980–2000 culminated in the dot.com bubble. We placed a band around the rise at both the top and the bottom. Note the line roughly in the middle. For years the NASDAQ stayed below that line; that is, until 1995 when it crossed over. That was the beginning of the blow-off. But the real blow-off did not get underway until after the 1998 Russia/Long Term Capital Management (LTCM) crash. What followed at the time was an unprecedented drop in interest rates coupled with the injection of massive amounts of liquidity from the central bank. That fueled the rocket ship rise into 2000.
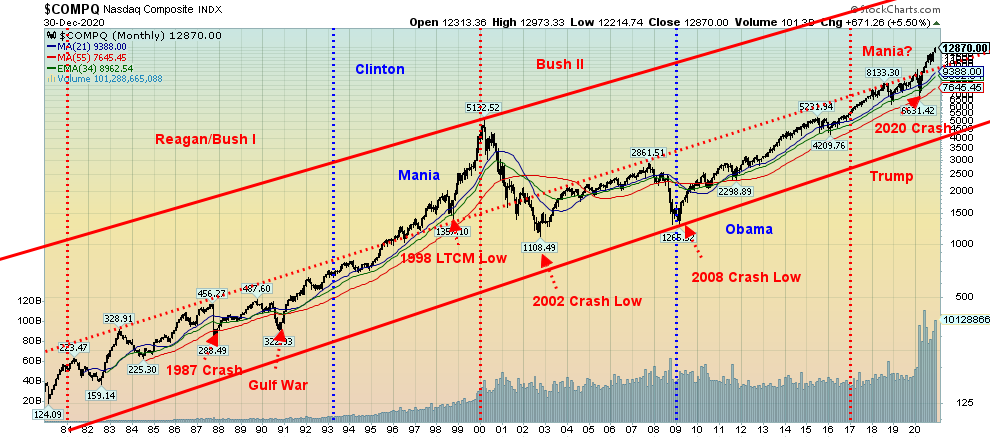
Source: www.stockcharts.com
Following the 2000–2002 dot.com crash, an event that nearly equaled the collapse of the Dow Jones Industrials (DJI) in 1929–1932 (DJI down 89% vs. NASDAQ down 78%), the NASDAQ has once again spent years trading below that middle line—that is, until now. Following the March 2020 crash and another unprecedented drop in interest rates, coupled with the injection of massive amounts of liquidity from the central banks, the stock markets shot right back up. Could we be once again be on the cusp of a mania such as we saw 1998–2000? Only this time it is more likely to happen in a more contracted period of time. If that’s correct, then strap on your seat belt. The best may be yet to come.
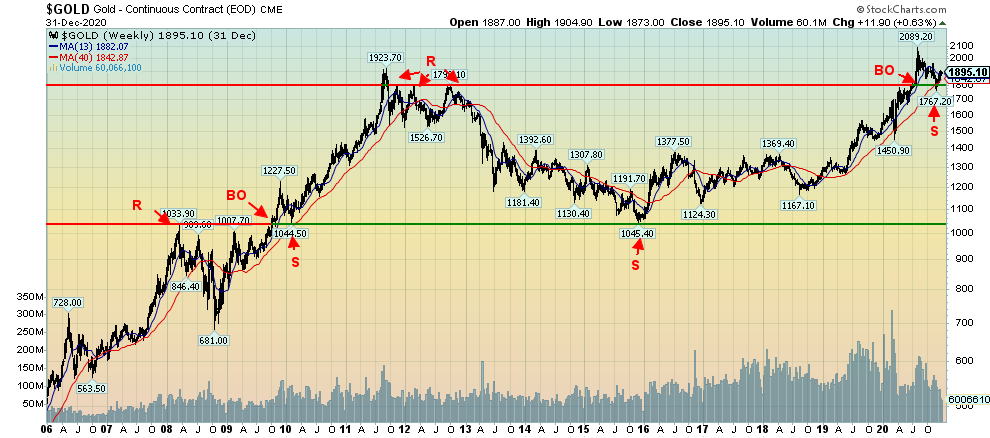
Source: www.stockcharts.com, www.gold-eagle.com/article/gold-price-2021-forecast-continuation-advance-ahead
Note: BO – Breakout, S – Support, R - Resistance
In 1998–2000, gold did not join the party. In fact, from October 1998 the low of the Russia/LTCM crash to August 1999, gold fell almost 14%. After a swift rebound into October 1999 gold began to decline again, making a double bottom with the 1999 low in April 2001. That was an historical cycle low. After that gold embarked on a 10-year bull market from 2001–2011 with interruptions along the way in 2004, 2006, and 2008. Our focus here is on what happened following the 2008 cycle low.
Gold broke out over the 2008 high in October 2009. Following a short-term spike high into November 2009, gold swiftly corrected back down. This was a test of the breakout. The low was seen in February 2010 at $1,044. That held the 2008 high of $1,034. Following that, gold swiftly rose to its peak in September 2011 at $1,924. The corrective pullback was swift. After finding a low at $1,535 gold spent the next year caught seemingly in a trading range between roughly $1,525 at the bottom and $1,800 on the top. On three occasions gold tested up near $1,800, only to fall back once again. The third time proved deadly and gold collapsed in April 2013. The final bottom did not come in until December 2015 at $1,045.
The December 2015 low was interesting in that it held the $1,044 pullback low seen in 2010 and held above the 2008 high. Coincidence? Following the important December 2015 low gold spent the next three years trying to form a bottom, never again breaking below the December 2015 low. Then gold started to rise again, finally breaking out over a cap near $1,370 in June 2019. In June 2020 gold broke out over $1,800 the resistance from 2012 and swiftly moved to a spike high at $2,089 in August 2020. Since then, gold has been in a corrective pattern, pulling back to test that breakout line near $1,800. The low thus far has been $1,767. Our question is, is this pullback similar to what we saw in 2009–2010 that set up the runaway move to $1,924 in September 2011? As long as that $1,767 holds and we begin to see new highs over $2,089, then a runaway move could develop for gold. A comparable move to what we saw in 2010–2011 could see gold rise to $3,200/$3,300.
The long bottom that formed between 2012 and 2019 had suggested a move to at least $2,000. We exceeded that with the high at $2,089. The next target could be $2,400. We have noted that gold appears to be trying to find its current 31.3-month cycle low. Once that low is in (and it may already be in), then we begin our third and final 31.3-month cycle of the larger 7.83-year cycle (from the December 2015 low the first 31.3-month cycle bottomed in August 2018). As cycles analyst Ray Merriman has pointed out (www.mmacycles.com), this final phase could be either very bullish or very bearish. Or even both.
Given once again the huge injections of liquidity into the financial system, the odds favour the bullish scenario. And, like the stock market, gold could also see a runaway blow-off move. We’ll know better once gold exceeds $1,950 and especially once it’s over $2,000. And key, of course, is that the low at $1,767 holds. For the S&P 500 that point is at 3,200.
There are two important events this coming week. First, the Georgia election on January 5 where the Democrats need to win both seats to at least set up a tie in the U.S. Senate. Lose one and the Republicans maintain control. The second is January 6 when the full congress meets to confirm the Electoral College vote of December 14 and confirm Joe Biden as the 46th president of the U.S. There are numerous challenges to that, given that the current president has not yet conceded and has been claiming fraud in the election. A number of Republican senators have said they will challenge Biden’s election in support of president Trump and force a voice count in congress. The lower house of representatives has a Democrats majority but the senate has the Republicans still with a majority. The vote needs 60 senators to approve the election of Biden. There are 48 Democrats. That says that 12 Republicans need to support the vote.
It is going to be an interesting week. Irrespective of the massive amounts of liquidity to come from the Fed and other central banks suggests to us that the odds favour the potential blow-off to come. But if the blow-off doesn’t happen, be aware of the breakdown levels. If the blow-off happens, what about the hangover that will be sure to follow? No matter what, things look darker going into 2022.

MARKETS AND TRENDS
|
|
|
|
% Gains (Losses) Trends |
|||||
|
|
Close Dec 31/19 |
Close Dec 31/20 |
Week |
YTD |
Daily (Short Term) |
Weekly (Intermediate) |
Monthly (Long Term) |
|
|
Stock Market Indices |
|
|
|
|
|
|
|
|
|
S&P 500 |
3,230.78 |
3,756.07 (new highs) |
1.4% |
16.3% |
up |
up |
up |
|
|
Dow Jones Industrials |
28,645.26 |
30,606.48 (new highs) |
1.4% |
7.3% |
up |
up |
up |
|
|
Dow Jones Transports |
10,936.70 |
12,506.93 |
(0.1)% |
14.7% |
up |
up |
up |
|
|
NASDAQ |
9,006.62 |
12,888.28 (new highs) |
0.7% |
43.6% |
up |
up |
up |
|
|
S&P/TSX Composite |
17,063.53 |
17,433.36 |
(1.1)% |
2.2 |
up |
up |
up |
|
|
S&P/TSX Venture (CDNX) |
577.54 |
875.36 (new highs) |
3.5% |
51.6% |
up |
up |
up |
|
|
S&P 600 |
1,021.18 |
1,118.93 (new highs) |
(0.2)% |
9.6% |
up |
up |
up |
|
|
MSCI World Index |
2,033.60 |
2,140.71 (new highs) |
1.2% |
5.3% |
up |
up |
up |
|
|
NYSE Bitcoin Index |
7,255.46 |
28,775.36 (new highs) |
24.0% |
296.6% |
up |
up |
up |
|
|
|
|
|
|
|
|
|
|
|
|
Gold Mining Stock Indices |
|
|
|
|
|
|
|
|
|
Gold Bugs Index (HUI) |
241.94 |
299.64 |
(0.5)% |
23.9% |
neutral |
neutral |
up |
|
|
TSX Gold Index (TGD) |
261.30 |
315.29 |
(1.7)% |
20.7% |
down (weak) |
down |
up |
|
|
|
|
|
|
|
|
|
|
|
|
Fixed Income Yields/Spreads |
|
|
|
|
|
|
|
|
|
U.S. 10-Year Treasury yield |
1.92 |
0.91 |
(2.2)% |
(52.6)% |
|
|
|
|
|
Cdn. 10-Year Bond yield |
1.70 |
0.68 |
(5.6)% |
(60.0)% |
|
|
|
|
|
Recession Watch Spreads |
|
|
|
|
|
|
|
|
|
U.S. 2-year 10-year Treasury spread |
0.34 |
0.79 |
(2.5)5 |
132.4% |
|
|
|
|
|
Cdn 2-year 10-year CGB spread |
0 |
0.48 |
(4.0)% |
4,800.0% |
|
|
|
|
|
|
|
|
|
|
|
|
|
|
|
Currencies |
|
|
|
|
|
|
|
|
|
US$ Index |
96.06 |
89.89 (new lows) |
(0.4)% |
(6.4)% |
down |
down |
down |
|
|
Canadian $ |
0.7710 |
0.7830 |
0.3% |
1.7% |
up |
up |
up |
|
|
Euro |
112.12 |
122.39 (new highs) |
0.5% |
9.1% |
up |
up |
up |
|
|
Swiss Franc |
103.44 |
113.14 (new highs) |
0.9% |
9.4% |
up |
up |
up |
|
|
British Pound |
132.59 |
136.72 (new highs) |
1.0% |
3.2% |
up |
up |
up |
|
|
Japanese Yen |
92.02 |
96.87 |
0.4% |
5.3% |
up |
up |
up |
|
|
|
|
|
|
|
|
|
|
|
|
Precious Metals |
|
|
|
|
|
|
|
|
|
Gold |
1,523.10 |
1,895.10 |
0.6% |
24.4% |
up |
up (weak) |
up |
|
|
Silver |
17.92 |
26.41 |
1.9% |
47.4% |
up |
up |
up |
|
|
Platinum |
977.80 |
1,079.20 |
4.9% |
10.4% |
up |
up |
up |
|
|
|
|
|
|
|
|
|
|
|
|
Base Metals |
|
|
|
|
|
|
|
|
|
Palladium |
1,909.30 |
2,453.80 |
4.6% |
25.9% |
up |
up |
up |
|
|
Copper |
2.797 |
3.52 |
(1.1)% |
25.9% |
up |
up |
up |
|
|
|
|
|
|
|
|
|
|
|
|
Energy |
|
|
|
|
|
|
|
|
|
WTI Oil |
61.06 |
48.52 |
0.6% |
(20.5)% |
up |
up |
down (weak) |
|
|
Natural Gas |
2.19 |
2.54 |
1.2% |
16.0% |
down |
up (weak) |
neutral |
|
Source: www.stockcharts.com, David Chapman
Note: For an explanation of the trends, see the glossary at the end of this article.
New highs/lows refer to new 52-week highs/lows.
Copyright David Chapman, 2021
|
GLOSSARY Trends Daily – Short-term trend (For swing traders) Weekly – Intermediate-term trend (For long-term trend followers) Monthly – Long-term secular trend (For long-term trend followers) Up – The trend is up. Down – The trend is down Neutral – Indicators are mostly neutral. A trend change might be in the offing. Weak – The trend is still up or down but it is weakening. It is also a sign that the trend might change. Topping – Indicators are suggesting that while the trend remains up there are considerable signs that suggest that the market is topping. Bottoming – Indicators are suggesting that while the trend is down there are considerable signs that suggest that the market is bottoming.
|
|
Charts and commentary by David Chapman Chief Strategist, Enriched Investing Inc. Phone: 416-523-5454 Email: david@davidchapman.com dchapman@enrichedinvesting.com Twitter: @Davcha12 January 4, 2021 |
David Chapman is not a registered advisory service and is not an exempt market dealer (EMD) nor a licensed financial advisor. We do not and cannot give individualised market advice. David Chapman has worked in the financial industry for over 40 years including large financial corporations, banks, and investment dealers. The information in this newsletter is intended only for informational and educational purposes. It should not be considered a solicitation of an offer or sale of any security. The reader assumes all risk when trading in securities and David Chapman advises consulting a licensed professional financial advisor before proceeding with any trade or idea presented in this newsletter. David Chapman may own shares in companies mentioned in this newsletter. We share our ideas and opinions for informational and educational purposes only and expect the reader to perform due diligence before considering a position in any security. That includes consulting with your own licensed professional financial advisor.
About the author


Website: https://www.enrichedinvesting.com
Disclaimer: David Chapman is not a registered advisory service and is not an exempt market dealer (EMD) nor a licensed financial advisor. We do not and cannot give individualised market advice. David Chapman has worked in the financial industry for over 40 years including large financial corporations, banks, and investment dealers. The information in this newsletter is intended only for informational and educational purposes. It should not be considered a solicitation of an offer or sale of any security. The reader assumes all risk when trading in securities and David Chapman advises consulting a licensed professional financial advisor before proceeding with any trade or idea presented in this newsletter. David Chapman may own shares in companies mentioned in this newsletter. We share our ideas and opinions for informational and educational purposes only and expect the reader to perform due diligence before considering a position in any security. That includes consulting with your own licensed professional financial advisor.