
We leave next weekend for a 3-week 5 city tour of Mexico. As a result this is the last full Scoop until the weekend of March 9. We will endeavour to provide short-updates as we can. As it turns out, on March 8 the February job numbers are out. This week we cover off points to watch for the stock markets, the US$ Index, bonds, gold and oil. Of particularly interest are breakdown points for rising markets and breakout points for bottoming markets.
The rise of the Magnificent Seven continues particularly Meta which had a big up week. Both the S&P 500 and the DJI made new all-time highs again along with a few other indices. However, once again the DJT and mid-cap and small-cap stocks did not keep up a potential significant divergence. We wonder if we are partying like 1999 when the dot com bubble was underway led by Cisco and others. This time it is Nvidia along with other FAANGs. That year the markets topped in January and March. Does history repeat or just rhyme? All bubbles eventually pop. How much life does this one have left?
The big events this past week were the Fed that as expected left interest rates unchanged but Fed Chair Powell continued to muse about inflation. Rates could stay higher for longer as most economists have pared back thoughts of rate cuts in March. Then came Friday's job numbers which were gangbusters and previous months jobs were revised upward. But are they as strong as they look on the surface? The job numbers are our chart of the week. The markets don't care as stocks rallied.
The happenings in the Mid-East seem to be largely ignored by the markets as the stock market rose, the US$ Index rose, bond yields popped higher but oil in particular tanked while gold held together even as the other precious metals led by silver faltered. Both gold and oil continue to trace out potential bottoms. One thing we recall from the dot.com bubble is that while everyone was focused on the high tech stocks both gold and oil were tracing out major bottoms. Kinross Gold Corporation, a diversified gold producer, may be one of these stock types to watch as, held in the Enriched Capital Conservative Growth Strategy,* it pays a dividend, tracks at the lower end of cost guidance, and has increased production and strong cash flow. From 2000 to 2011 gold rose 445% while oil was up 288%. The S&P 500 lost 14% after being down as much as 50% in early 2009.
Traveling in central Mexico is not the same as being at the beaches of Cancun or Puerto Vallarta. After all, we find ourselves up 1,500 - 3,000 metres throughout. Have a great week.
DC
* Reference to the Enriched Capital Conservative Growth Strategy and its investments, celebrating a 5-year history of strong growth, is added by Margaret Samuel, President, CEO and Portfolio Manager of Enriched Investing Incorporated, who can be reached at 416-203-3028 or msamuel@enrichedinvesting.com
“The investor is bombarded with staggering amounts of information, staggering amounts of stimuli that are designed to get the investor to buy and sell and trade, to do exactly the wrong thing, to create excessive profits for these intermediaries that aren’t acting in the investor’s best interests.”
—David Swenson, American investor, endowment fund manager, philanthropist, Chief Investment Officer, Yale University 1985–2021; 1954–2021
“Over the very long run, it is the economics of investing—enterprise—that has determined total return; the evanescent emotions of investing—speculation—so important over the short run, have ultimately proven to be virtually meaningless.”
—John Bogle, American investor, business magnate, philanthropist, founder and CEO of the Vanguard Group, credited with popularizing the index fund; 1929–2019
“It is foolhardy to shut our eyes and buy just any stock because of prospects for a substantial rise in the general averages. Though in a bear market nearly every stock goes down, in a bull market not all stocks advance.”
—Fred C. Kelly, American humourist, newspaperman, columnist, wrote humour column for The Plain Dealer, author of How to Lose Your Money Prudently (1933); 1882–1959
The IMF believes we’ll have a soft landing, although risks remain. Economist David Rosenberg believes the soft landing is just the calm before the storm. Economist Ed Yardeni says it has been “Party Like It’s 1999.” The U.S. economy has been beating the world. And, despite a prognosis that Canada would fall into a recession, they surprised everyone, with preliminary numbers showing that GDP grew through Q4.
So, are we really partying like it was 1999? Is the Magnificent Seven bubble the same as the dot.com/high-tech bubble of the late 1990s? The Magnificent Seven make up some 29% of the S&P 500. It certainly has a look and feel to it that is similar. We show both Cisco Systems (CSCO) and Nvidia (NVDA) below. Cisco was a darling during the late 1990s bubble, just like Nvidia has been today. We have deliberately shown both stocks in linear mode rather than log mode to show the dramatic rise for each one of them. Linear mode just looks at numbers as a constant, just pure numbers, while log scale looks at the numbers as percentage gains; i.e. a move from $2 to $4 is the same percentage as a move from $50 to $100.
Cisco started its dramatic rise out of the 1998 LTCM crisis. From that low in October 1998 to the bubble peak in March 2000, a period of 17 months, Cisco gained almost 800%. From its low in October 2022, a period of 15 months so far, Nvidia has gained just under 600%. Could it be that Nvidia has further to go before it tops? It is clearly possible. A comparable move for Nvidia today would take it to $865. Bubbles never make any sense.
But eventually they burst and then there are only tears. After the peak, Cisco fell 90% into October 2002—a period of some 31 months. So, what is Nvidia’s fate?
Cisco Systems 1990–2002
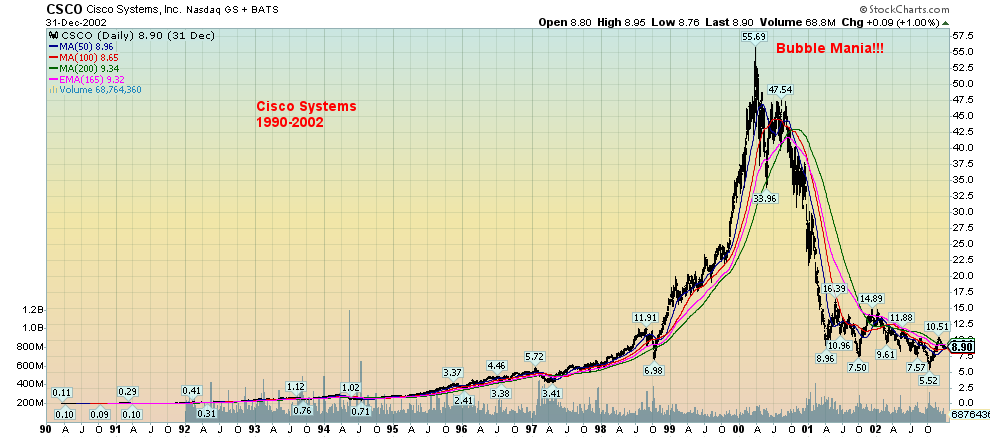
Source: www.stockcharts.com
Nvidia 2009–2024
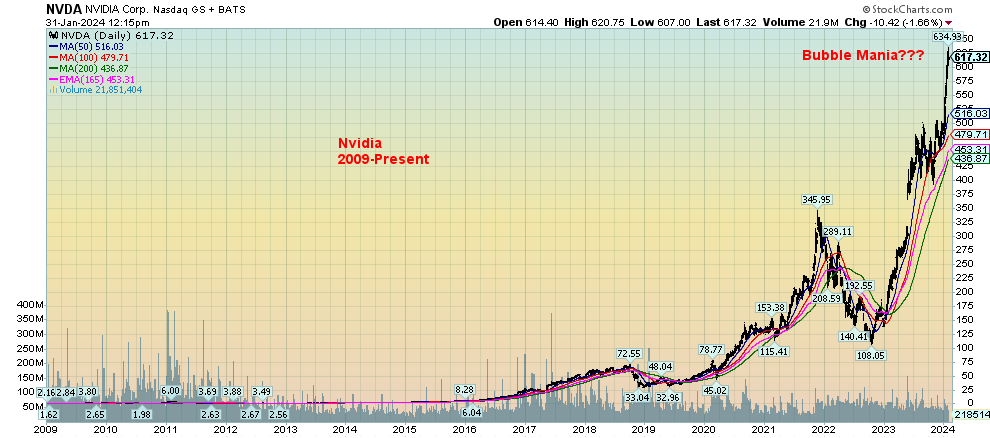
Source: www.stockcharts.com
Speaking of bubbles, is the Tesla bubble over? EV sales are falling, complaints are rising, the company is facing criminal and civil investigations, and recalls are rising. The Tesla mania appears to be over. From the pandemic low in March 2020, Tesla soared over 1,700% to that bubble top in November 2021. The first drop shaved Tesla by over 75% (our A wave). The rebound (our B wave) saw Tesla leap almost 300%. Now we appear to be starting the C wave down. Will it meet Cisco’s fate? A 90% drop takes us down to around $40.00. Ouch! That high of $414.50 now seems but a distant memory.
Is the Tesla Mania Over? Tesla 2010–2024
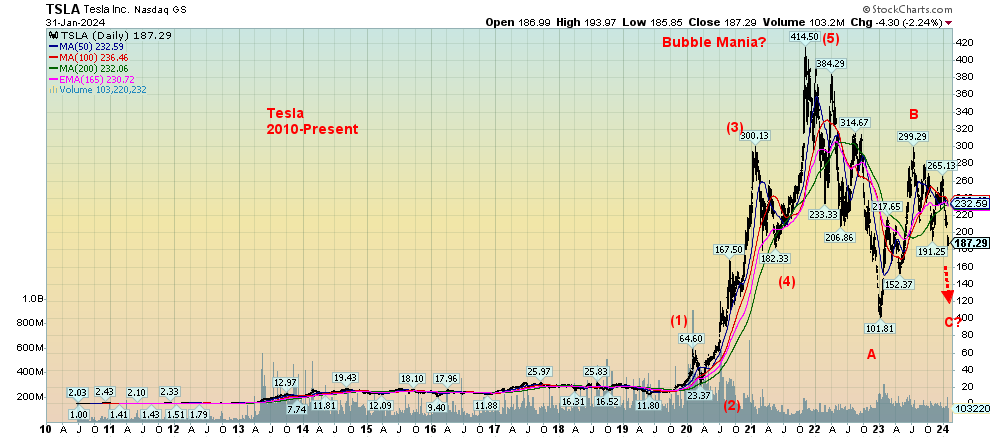
Source: www.stockcharts.com
The Fed, as expected, at its January 31, 2024 meeting left rates unchanged. However, Fed Chair Jerome Powell dampened the market by effectively nixing thoughts of a March rate cut. Next hint? Maybe by May/June as some are now expecting? But then came the January job numbers that surprised everyone (see chart of the week). The BOE also left rates unchanged, continuing the trend of central banks no longer hiking rates. The focus will now turn to economic numbers over the next few months to see if there is any growing weakness in the economy that might encourage the Fed to cut.
There was a lot of speculation that Canada was sliding into a recession, based on a few numbers and a month or two of negative growth. But Canada surprised with the release of their latest GDP numbers that showed 0.2% growth in November vs. an expected 0.1%, and a surprising 0.3% preliminary growth in December when they expected 0%. This now puts Canada on target for Q4 growth. Canada is now expected to grow 1.1% in 2023. That’s not great, but when the expectations were lower it’s a win. Outside of Germany, the G7 countries are all expected to grow in 2023. And as to 2024? The IMF is expecting all of the G7 countries to grow. The U.S. leads the pack in both 2023 and 2024 as the U.S. economy remains far more resilient than many would believe. Optimism reigns.
The proverbial soft landing? Maybe we should say, what soft landing? While growth projections are not overwhelming, they are at least positive. And that is against a background of still-rising global debt, rising debt/equity for consumers and rising debt/GDP for countries, problems in particular in the real estate market, both for consumers and commercials, the massive debt bubble that still has not brought us a major debt collapse, the ongoing risk of an escalation in the wars, particularly in the Middle East, and the unknown of any economic impact from extreme weather events. And, lest we forget, some blow-up related to the 2024 U.S. election in a deeply divided America remains a real possibility.
Even the real estate collapse in China led by the now bankrupt Evergrande has not spread globally, at least not yet. Nonetheless, the risk of an unknown event (also known as a Black Swan event) remains, whether it is unexpected turn in the Middle East wars or the collapse of an institution(s) that threatens the entire financial system as we saw first at the LTCM/Russia collapse of 1998 and again with the sub-prime/Lehman Brothers collapse of 2008.
Below is a chart from the IMF (www.imf.org) showing their estimate of 2023 growth and projected 2024 growth. The soft landing is in sight. But will it happen?
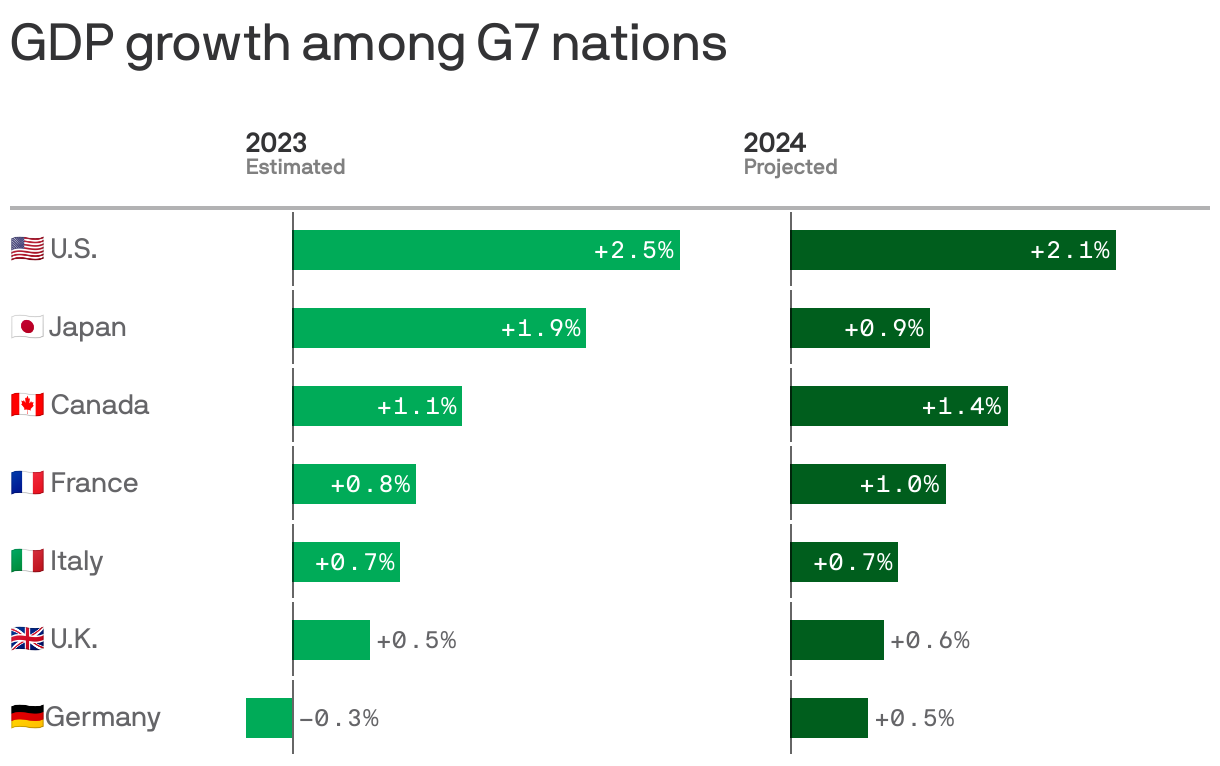
Source: www.imf.org, www.axios.com
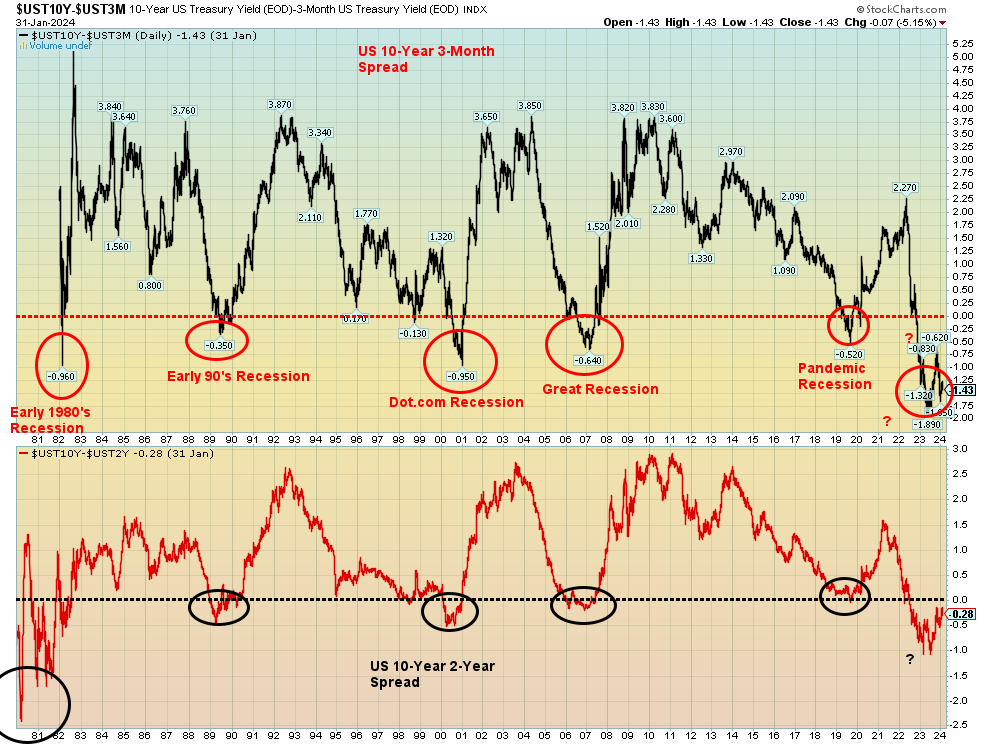
We have constantly noted the negative 2-year–10-year spread as well as the 3-month–10-year spread as harbingers for a recession. Whenever these spreads had turned negative over the past forty-plus years, a recession has followed. So far, they have been 100% accurate. We have been largely negative on these spreads
since August/September 2022. Yet the charts also suggest that a recession doesn’t get underway until the spreads come back to at least zero. That can sometimes take a year or more. We are now past a year and we note that the 2–10 spread at negative 28 bp is the best it has been since October 2022. The 3m–10 spread remains quite negative at 143 bp. We may be getting closer but, as they say, we are not there yet.
3-month–10-year, 2-year–10-year Spreads 1981–2024
Source: www.stockcharts.com
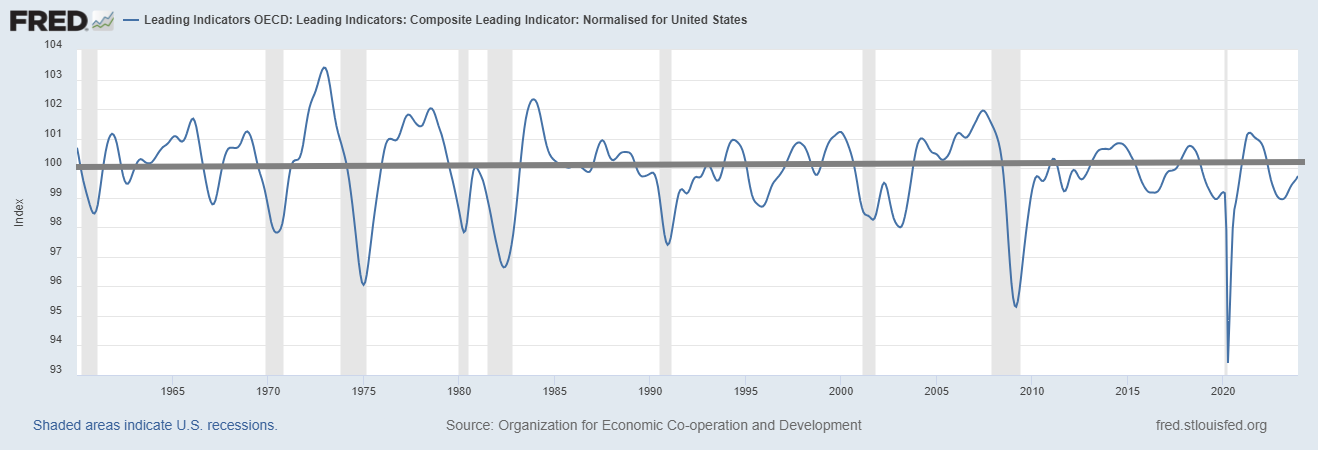
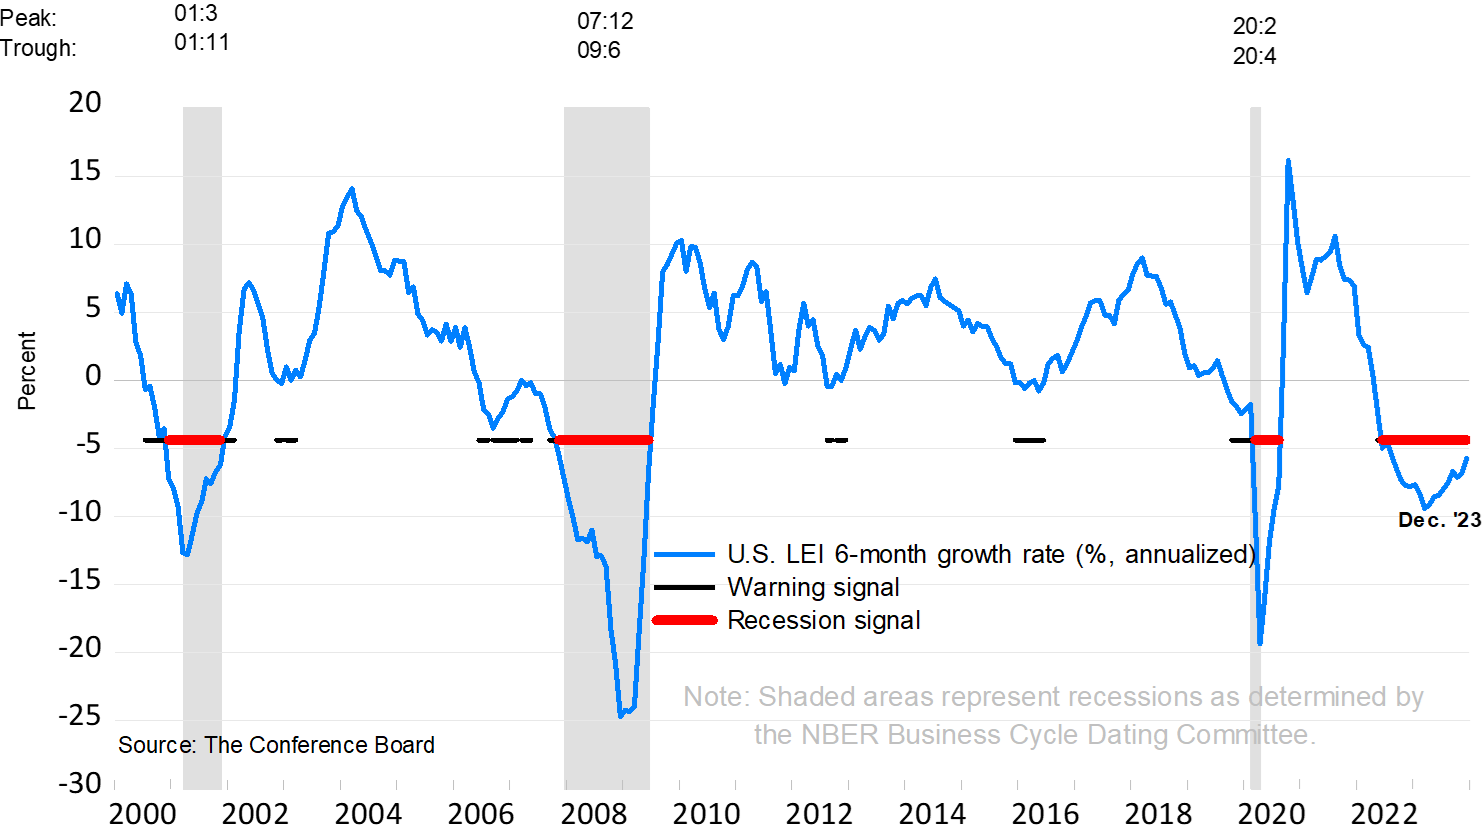
While there are any number of indicators one can follow—inflation, housing, consumer, business, markets, money supply, etc.—one indicator that has also been good at predicting a recession is leading economic indicators. Our first chart below shows the OECD U.S. Composite Leading Indicators. Generally speaking, the odds of a recession increase once the LEI drops below 100. The most recent reading was 99.7, although it had fallen at one time in February 2023 to 99.0. Possibly better is the Conference Board’s leading economic
indicators. Its components include payroll employment, personal income less transfer payments, manufacturing and trade sales, and industrial production. The Conference Board continues to signal recession. That a recession has not happened yet (defined as two consecutive quarters of negative growth) does not mean it won’t happen. The question is when, not if.
OECD Leading Indicators Composite for the U.S. 1960–2023
Source: www.stlouisfed.org
Conference Board’s Leading Economic Indicators 2000–2023
Source: www.conference-board.org
We can’t ignore cycles (relating to the stock market) because the cycles have been remarkably accurate (with occasional wiggles) over a long period of time. The key one is the 18-year cycle (range 15–21 years) which is a component of the long-term 72-year cycle (range 60–84 years) which breaks down into two 36-year cycles (range 30–42 years), then four 18-year cycles (Merriman – www.mmacycles.com). Merriman also cites a potential 90-year cycle, but again that falls on the 18-year cycle. As well, there have been few observations of the 90-year cycle with one noted in 1843, followed by 1932 Great Depression low (89 years). That suggests the next 90-year cycle low is in play with a range of +/- 15 years. In this case that would be 2007–2037. But we know that 2009 was a 72-year cycle low, given it was 77 years from the 1932 low. The 1974 low was 42 years from 1932 while 2009 was 35 years from 1974. Thus, we know we are in the up phase of the current 72-year cycle with the next 18-year cycle low due 2024 to 2030.
As everyone knows, there have been important lows in between. The 18-year cycle breaks down into three 6-year cycles, range 5–7 years, (or two 9-year cycles, but usually it is 6). From the 1974 low we observed important lows in 1982, 1987, 1994 (shallow), 2000 or 2002, 2009, 2015/2016, and 2022. We have also observed a 4-year cycle (range 3–5 years). Again from 1974 we saw lows in 1978, 1982, 1987, 1990, 1994, 1998, 2002, 2007 (or do we say 2009, we prefer 2007), 2011, 2015, and 2020. We next had a low in 2022, but it fell on a 6-year cycle. There was a low in October 2023 but it wasn’t deep. So that leaves 2024 or 2025 open for the next 4-year cycle low and 2027–2029 for the next 6-year cycle low. The latter would coincide with an 18-year cycle low. If that’s correct, it suggests to us that the stock market could correct downwards of 50% from any high.
Kondratieff Wave Cycles
First cycle (1784–1844) – 60 years
Second cycle (1844–1896) – 52 years
Third cycle (1896–1949) – 53 years
Fourth cycle (1949–2009) – 60 years
Fifth cycle 2009-?
Kondratieff Wave 1784–2023
|
Spring (Expansion) Stocks |
Summer (Recession) Commodities |
Autumn (Plateau) Stocks |
Winter (Depression) Commodities |
|
1784–1800 (American Revolution) |
1800–1816 (War of 1812) |
1816–1835 (Era of Good Feelings) |
1835–1844 (Indian Wars) |
|
1845–1858 (Mexican-American War) |
1859–1864 (Civil War) |
1864–1874 (Reconstruction) |
1875–1896 (Indian Wars) |
|
1896–1907 (Spanish-American War) |
1907–1920 (WWI) |
1920–1929 (Roaring 20s) |
1929–1949 (WWII) |
|
1949–1966 (Korean War) |
1966–1982 (Vietnam War) |
1982–2000 (The New Economy) |
2000–2009 (War on Terror) |
|
2009–2022 (Pandemic) |
2022–? (Russia/Ukraine, Middle East Wars) |
|
|
We can’t ignore the old Kondratieff Wave cycle, named after the Russian economist Nicholas Kondratieff (1892–1938) who was prompted by Joseph Stalin to examine business and stock market cycles in Western economies. Kondratieff did (also spelled Kondratiev) and concluded it also occurs in Communist economies. Stalin wasn’t pleased with that and banished Kondratieff to Siberia where he died in 1938. We note that few seem to follow that cycle any longer, or at least none that we can find, but we always found it quite interesting and believe the cycle is alive and well. We believe the period 2009 to 2022 was the spring of a new long-term Kondratieff wave. The last winter was 2009–2009 that featured the dot.com collapse of 2000–2002 and the sub-prime/financial crisis of 2007–2009 where stock markets lost over 50%. The period was also highlighted by the war on terror, and the invasions of Afghanistan and Iraq. If the spring of the Kondratieff wave was completed with the top in 2022, we have now entered the summer of the Kondratieff wave. The last summer was the period 1966–1982, which also saw stock markets correct at least 50%. But the period also saw big swings up and down in the stock market.
As a result, we have a number of cycles lining up over the next several years (6-year, 18-year, 90-year? Kondratieff) that suggest at least a 50% correction in the stock markets at some point, plus wars (Russia/Ukraine, Middle East under way). Debt is too high and a debt crisis of some magnitude is also expected to occur. But gold has historically done well in the summer of the Kondratieff wave as well as the winter of the Kondratieff wave. However, stock markets do not do well, regardless of recent all-time highs for a few indices.
If all of this is correct, then our expectation is that the soft landing will actually turn into a hard landing at some point. The cycles are pointed that way. That and the current complacency of a soft landing. We note that as we entered 2022 markets were giddy with excitement that we were headed even higher. 2022 was a disastrous year. At the end of the 2022 everyone was bearish. 2023 was good up year. As we enter 2024 everyone is giddy again on sharply rising stock markets led by the Magnificent Seven. Now you can’t find a bear unless you are talking about gold and oil. What will 2024 bring?
Chart of the Week
U.S. Job Numbers
Employed Persons, Unemployed Persons – 2014–2024
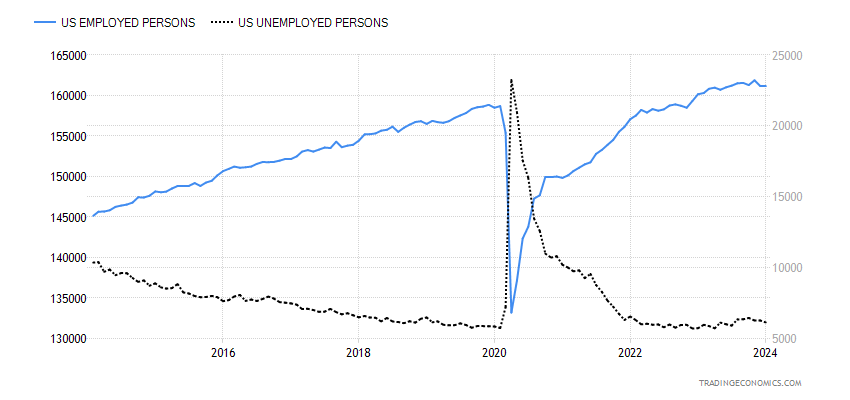
Source: www.tradingeconomics.com, www.bls.gov
Recession? What recession? We suppose we could say we’re shocked. But that would probably be an overstatement. Still, the January job numbers came in at a whopping 353,000. That was well above the consensus of 180,000. Worse or better, depending on how one looks at it, the December numbers were revised upwards to 333,000 from 216,000. Altogether, the November/December job numbers were revised upwards by 126,000. Normally we see revisions being cut, not rising. Recession in the U.S.? Rate cuts coming? Fuhgeddaboudit.
But the nonfarm payrolls come from what is known as the establishment survey. In other words, business is polled. All these recent announcements of layoffs we can only guess haven’t hit yet. The Bureau of Labour Statistics (BLS) reported that gains were largely seen in professional and business services, health care, retail trade, and social assistance, while employment declined in the mining, quarrying, and oil and gas extraction
industry.
But the establishment survey is only a part of the picture and focuses on business. The household survey, in our opinion, is more important to look at. That’s where they actually talk to households to try and get a truer picture of employment. The labour force actually fell 175,000. The labour force participation rate was,
however, steady at 62.5% while the employment population ratio rose to 60.2% from 60.1%. Looking at other
numbers, we discover that the employment level fell by 31,000 to 161,152 and full-time employment fell by 63,000 to 133,133. Part-time employment on the other hand surged by 96,000 to 27,890. More high-paying
jobs go while part-time, low-paying jobs rise. That suggests that the job gains in January were primarily part-time. The number reported as unemployed (which makes up U3) fell 144,000 to 6,124,000. Strangely, the population level fell 451,000. At 267.5 million, that includes everyone 16 years of age and over that could in theory work. However, it excludes the prison population, those in mental institutions, and those in homes for the aged. It also excludes those in active-duty positions in the armed forces. Why, we are not sure. And why it fell when the population is growing is also a mystery.
The unemployment rate (U3) was unchanged at 3.7% but the U6 unemployment rate (which is all persons marginally attached to the labour force, plus total employed part time for economic reasons, as a percentage of the civilian labour force, plus all persons marginally attached to the labour force) rose to 7.2% from 7.1%. Seems people can’t find full-time work, which is not surprising when part-time rose while full-time fell. The Shadow Stats (www.shadowstat.com) unemployment number was 25.7% vs. 25.6% in January. The SS number is U6 plus those defined out of the labour force in 1994.
The number not in the labour force actually fell to 101,133,000, a drop of 217,000. But a reminder 58.5 million are retirees, some of who might actually be still working. Disabled totals 8.5 million. Interesting numbers reported at (www.usdebtclock.org) show that 43.5 million live in poverty, 41.3 million are on food stamps, while 27.2 million have no health insurance. No worries—there are 23.3 million millionaires in the U.S. and there are listed 756 billionaires. Meanwhile, it is reported that there are 611,234 homeless in the U.S. That’s probably understated—plus, add in immigrants, legal or otherwise.
It was reported that people are working less as the hours worked fell to 34.1 from 34.3. That’s actually a big drop. The last time it was this low was during COVID. It suggests that more people are being used less. That drop, according to economist David Rosenberg, suggests that instead of 353,000 new jobs in January the real number is a drop of 535,000 jobs. Since the BLS numbers are adjusted for seasonals the adjusted gain for January but others are reporting that the unadjusted job growth was actually a drop of 2.635 million. That’s quite a swing. Nonetheless, the BLS numbers are adjusted in order to smooth out the ups and downs.
The average hourly earnings rose by 0.6% and year-over-year they were up 4.5% vs. the most recent inflation rate at 3.4%. The Fed isn’t going to like that. The percentage of multiple job holders fell to 5.1% from 5.3% while the average number of weeks unemployed fell to 20.8 weeks vs. 22.3 weeks. Those unemployed 27 weeks or longer rose by 129,000.
Nonetheless, the market tends to stop looking at anything except the headline number, which was gangbusters. It is certainly well above the 100,000 jobs needed each month to keep up with population growth. Predictably the US$ Index rose, bond yields rose, gold fell, and the stock market pared gains. Talk of March rate cuts has probably disappeared. Next up is June, and now that is not looking like a sure thing any longer.
Canada reports its employment numbers this coming week.
Markets & Trends
|
|
|
|
% Gains (Losses) Trends |
|
||||
|
|
Close Dec 31/23 |
Close Feb 2, 2024 |
Week |
YTD |
Daily (Short Term) |
Weekly (Intermediate) |
Monthly (Long Term) |
|
|
Stock Market Indices |
|
|
|
|
|
|
|
|
|
S&P 500 |
4,769.83 |
4,958.61 (new highs)* |
1.4% |
4.0% |
up |
up |
up |
|
|
Dow Jones Industrials |
37,689.54 |
38,654.52 (new highs)* |
1.4% |
2.6% |
up |
up |
up |
|
|
Dow Jones Transport |
15,898.85 |
15,799.59 |
(0.6)% |
(0.6)% |
up |
up |
up |
|
|
NASDAQ |
15,011.35 |
15,628.95 |
1.1% |
4.1% |
up |
up |
up |
|
|
S&P/TSX Composite |
20,958.54 |
21,085.29 |
(0.2)% |
0.6% |
up |
up |
up |
|
|
S&P/TSX Venture (CDNX) |
552.90 |
556.95 |
1.1% |
0.7% |
up |
down (weak) |
down |
|
|
S&P 600 (small) |
1,318.26 |
1,273.63 |
(1.3)% |
(3.4)% |
up |
up |
up (weak) |
|
|
MSCI World |
2,260.96 |
2,249.36 |
0.9% |
(0.5)% |
up |
up |
up (weak) |
|
|
Bitcoin |
41,987.29 |
43,022.89 |
2.4% |
2.5% |
up |
up |
up |
|
|
|
|
|
|
|
|
|
|
|
|
Gold Mining Stock Indices |
|
|
|
|
|
|
|
|
|
Gold Bugs Index (HUI) |
243.31 |
219.20 |
0.3% |
(9.9)% |
down |
down |
down |
|
|
TSX Gold Index (TGD) |
284.56 |
262.11 |
0.5% |
(7.9)% |
down |
down |
down |
|
|
|
|
|
|
|
|
|
|
|
|
% |
|
|
|
|
|
|
|
|
|
U.S. 10-Year Treasury Bond yield |
3.87% |
4.02% |
(2.9)% |
3.9% |
|
|
|
|
|
Cdn. 10-Year Bond CGB yield |
3.11% |
3.38% |
(4.0)% |
8.7% |
|
|
|
|
|
Recession Watch Spreads |
|
|
|
|
|
|
|
|
|
U.S. 2-year 10-year Treasury spread |
(0.38)% |
(0.35)% |
(59.1)% |
7.9% |
|
|
|
|
|
Cdn 2-year 10-year CGB spread |
(0.78)% |
(0.68)% |
(25.9)% |
12.8% |
|
|
|
|
|
|
|
|
|
|
|
|
|
|
|
Currencies |
|
|
|
|
|
|
|
|
|
US$ Index |
101.03 |
103.92 |
0.4% |
2.9% |
up |
neutral |
up (weak) |
|
|
Canadian $ |
75.60 |
74.30 |
(0.2)% |
(1.7)% |
neutral |
neutral |
down |
|
|
Euro |
110.36 |
107.92 |
(0.6)% |
(2.2)% |
down |
neutral |
down (weak) |
|
|
Swiss Franc |
118.84 |
115.42 |
(0.3)% |
(2.9)% |
neutral |
up |
up |
|
|
British Pound |
127.31 |
126.39 |
(0.5)% |
(0.7)% |
neutral |
up (weak) |
neutral |
|
|
Japanese Yen |
70.91 |
67.42 |
(0.2)% |
(4.9)% |
down |
down |
down |
|
|
|
|
|
|
|
|
|
|
|
|
|
|
|
|
|
|
|
|
|
|
Precious Metals |
|
|
|
|
|
|
|
|
|
Gold |
2,071.80 |
2,053.70 |
1.8% |
(0.9)% |
up |
up |
up |
|
|
Silver |
24.09 |
22.80 |
(0.3)% |
(5.4)% |
down |
down |
neutral |
|
|
Platinum |
1,023.20 |
901.60 |
(2.1)% |
(11.9)% |
down |
down |
down |
|
|
|
|
|
|
|
|
|
|
|
|
Base Metals |
|
|
|
|
|
|
|
|
|
Palladium |
1,140.20 |
949.00 |
(1.3)% |
(16.8)% |
down |
down |
down |
|
|
Copper |
3.89 |
3.82 |
(0.8)% |
(1.8)% |
neutral |
up (weak) |
down (weak) |
|
|
|
|
|
|
|
|
|
|
|
|
Energy |
|
|
|
|
|
|
|
|
|
WTI Oil |
71.70 |
72.28 |
(7.4)% |
0.7% |
neutral |
down (weak) |
neutral |
|
|
Nat Gas |
2.56 |
2.08 |
(4.2)% |
(18.9)% |
down |
down |
down |
|
Source: www.stockcharts.com
Note: For an explanation of the trends, see the glossary at the end of this article.
New highs/lows refer to new 52-week highs/lows and, in some cases, all-time highs.
- * New All-Time Highs
Source: www.stockcharts.com
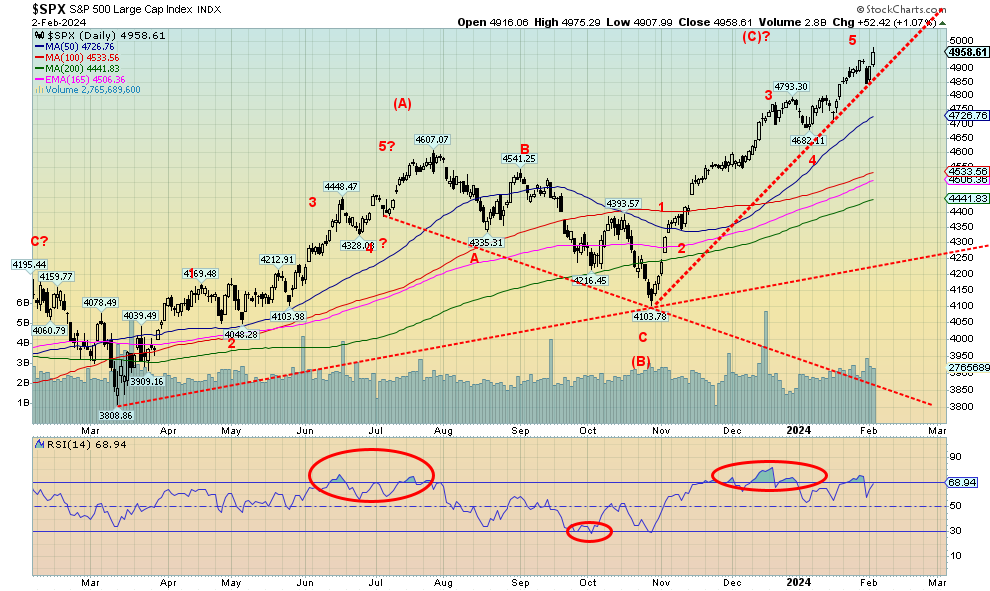
Once again, new all-time highs were reached for the S&P 500 and the Dow Jones Industrials (DJI). They weren’t alone as the NY FANG Index and the NASDAQ 100 joined them. The NASDAQ was just short. So was the S&P 500 Equal Weight Index. Making new all-time highs were the S&P 100 (OEX), the Russell 1000 and 2000, and the Wilshire 5000. Many others weren’t even close, an ongoing divergence. The Dow Jones Transportation (DJT) continues it significant divergence with the DJI.
On the week, the S&P 500 rose 1.4%, the DJI was up 1.4%, the DJT lost 0.6%, and the NASDAQ rose 1.1%. The S&P 400 (Mid) was up 0.1% but the S&P 600 (Small) fell 1.3%. The S&P 500 Equal Weight rose 0.4% while the previously mentioned NY FANG Index was up 4.2%. The Magnificent Seven continue to rule. Bitcoin rebounded, up 2.4%, but remains well off the recent high.
In Canada, the TSX Composite lost a small 0.2% after making new highs while the TSX Venture Exchange (CDNX) was up 1.1%. In the EU, the London FTSE was down 0.3%, the EuroNext made new highs but closed down 0.3%, the Paris CAC 40 also made new highs but lost 0.5%, while the German DAX fell 0.3%. In Asia, China’s Shanghai Index (SSEC) lost a big 6.2% as woes continued there, thanks to the bankruptcy of Evergrande, the Tokyo Nikkei Dow (TKN) gained 0.7%, but Hong Kong’s Hang Seng (HSI) lost 2.6%. The MSCI World Index made new highs, up 0.9%.
We are getting the sense that this rise is not over. Yes, it appears that we could be spiking. Yes, February is usually a weak month. But we are reminded of 2000 when the DJI topped in January and, after an initial pullback into February, the markets soared again into March where the S&P 500 and the NASDAQ made all-time highs but the DJI did not and the DJT wasn’t even close. Sound familiar? That’s in line with our earlier comments of partying like it’s 1999. Then the dot.com bubble. Today, the Magnificent Seven and AI.
The first sign of trouble is a break back under 4,800. That would take out the earlier January 2022 high. Under 4,680 it’s all over as that would take out a significant weekly low. In the interim, the trend is up despite all the overbought signals. The one thing we wouldn’t be doing here is buying further. The market is frothy and that is becoming dangerous. But frothiness can continue longer than the shorts can remain solvent. Once the shorts are out and the last buyer buys, the market tops.
Source: www.stockcharts.com
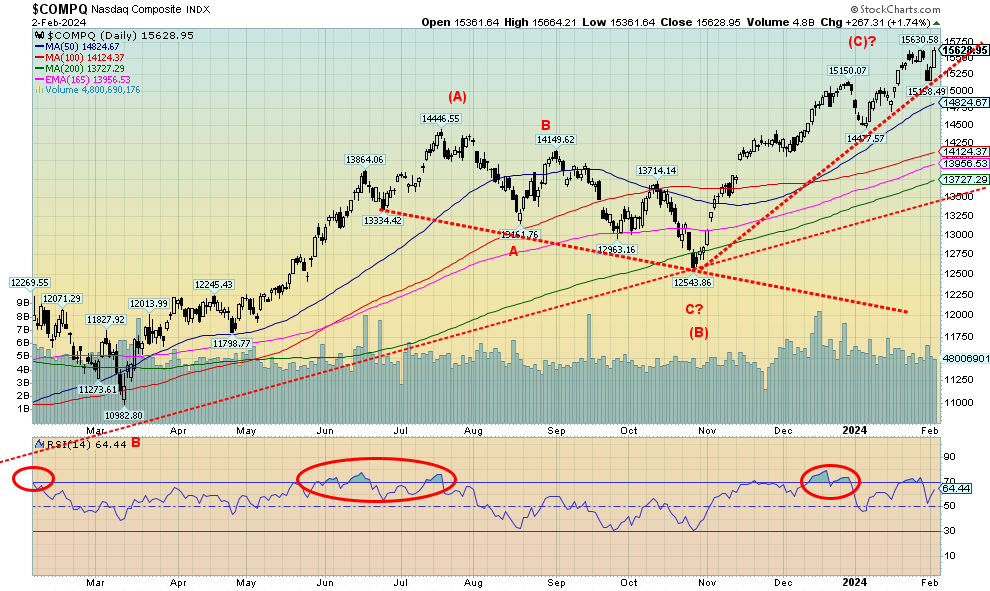
The NASDAQ soars, thanks to the Magnificent Seven. But it didn’t make new all-time highs with the SPX and DJI. That could be a divergence, but it’s inconclusive until we get a sell signal. A sell signal does not come until 14,500. Warnings appear under 15,250. The big rise was led by the 20.5% leap for Meta (Facebook) to new all-time highs. Joining Meta to new all-time highs were Amazon, up 8.0%, Microsoft, up 1.8%, and who else but Nvidia, up 8.4%. Snowflake made new 52-week highs, up 8.0%. Surprisingly, Berkshire Hathaway also made new all-time highs, up 1.2%, but it’s not a FAANG. Tesla is and recovered, up 2.5% this past week. What would the NASDAQ do without the FAANGs? The trend is up and is still not broken.
Source: www.stockcharts.com
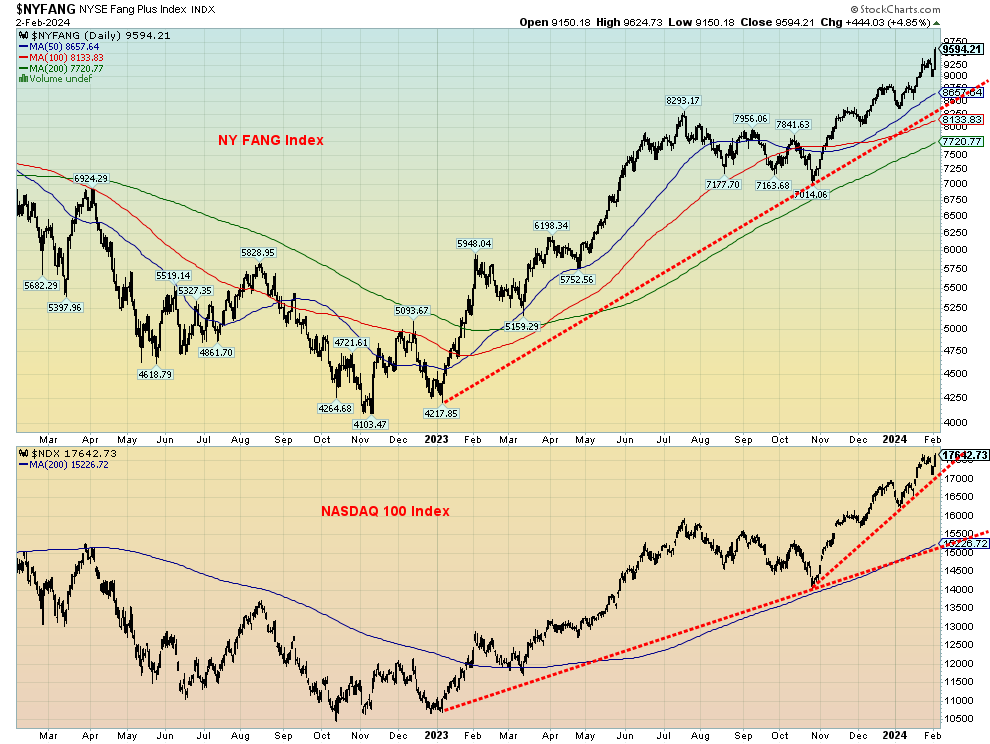
Up, up, and away for the NY FANG Index and the NASDAQ 100 Index, both driven by the Magnificent Seven. Both are now starting to exhibit a bubble but, as we noted earlier, this could well continue into March until something breaks the magic. March 2024 is 24 years from March 2000 and the major NASDAQ top for the dot.com bubble. Nonetheless, both are overbought so it is hard buying up at these lofty levels. Buyer beware.
Source: www.stockcharts.com
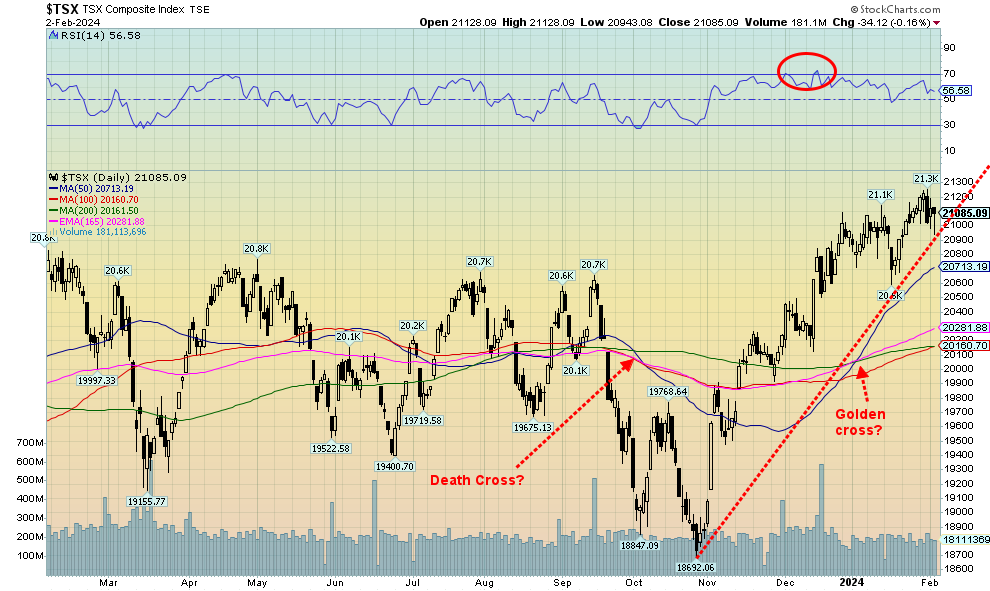
The TSX Composite didn’t join the new highs this past week, losing 0.2%. We should say new all-time highs as the TSX did make 52-week highs but reversed and closed lower. A slight negative going into this coming week. The TSX Venture Exchange (CDNX) bucked the trend and rose 1.1%. But it’s been so moribund we wonder if it’s alive. Indeed, there was a question about the junior mining market that has been pretty miserable for some time now. An article in The Northern Miner from Ross Beaty (https://www.northernminer.com/news/video-ross-beaty-on-whats-next-for-junior-miners-as-investors-shun-the-space/1003863492/?utm_source=feedotter&utm_medium=email&utm_campaign=FO-02-02-2024&utm_content=httpswwwnorthernminercomnewsvideorossbeatyonwhatsnextforjuniorminersasinvestorsshunthespace1003863492&TNMweekly) argues that we could see a reversion in 2024. As it notes, gold and even copper prices are high, but the mining stocks act like they are in a depression, even as many still raise funds and report good results. But no one seems to care. The last time we saw that in the late 90s and early 2000s, it was a bottom and the start of a 10-year bull market. Although we haven’t seen any gold mining companies suddenly become an AI company. That would signal a bottom for sure. Back then we saw some gold mining companies suddenly become dot.com companies. They might have regretted that move.
On the week, nine of the 14 sub-indices were down, including the two largest: Financials TFS fell 1.0% while Energy TEN was off 4.1%. Telecommunications TTS was the only other big loser, off 2.1%. Industrials TIN soared to new highs, up 2.8%, while Information Technology TTK jumped 2.5%. Consumer Discretionary TCD was up 1.7%.
The TSX is rising, but this week’s new high followed by a reversal doesn’t bode well. We may have completed five waves up. The breakdown is under 20,900. New highs keep things alive. Under 20,500 a top is confirmed. Watch these levels over the next few weeks.
U.S. 10-year Treasury Bond/Canadian 10-year Government Bond (CGB)
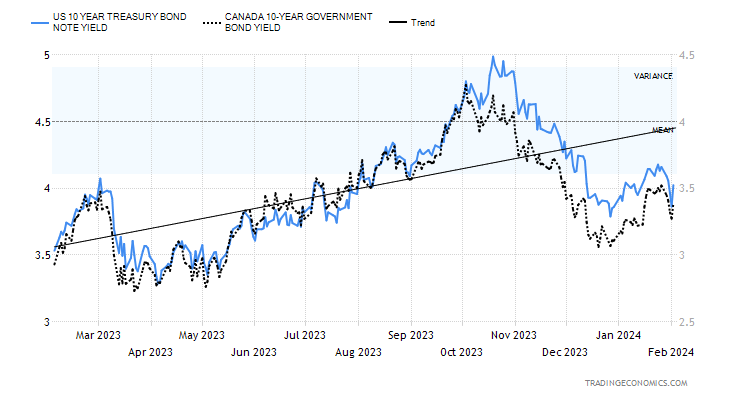
Source: www.tradingeconomics.com, www.home.treasury.gov, www.bankofcanada.ca
The Fed spoke. The job numbers came out. The Fed left rates unchanged as expected but remained more hawkish than many wanted. As a result, the odds of a March rate cut evaporated and now the focus has switched to May or June. That helped steady bond rates, but then Friday’s job numbers were higher and bond yields rose. That’s the bad news. The good news is that despite the jump on Friday, the U.S. 10-year treasury note yield remains below recent highs. This past week the 10-year actually fell to 4.02% from the previous week’s 4.14%. In Canada, the 10-year Government of Canada bond (CGB) fell to 3.38% from 3.52%. The spreads, however, widened as the 2–10 U.S. spread went out to negative 35 bp from negative 22 bp and the 2–10 in Canada rose? fell? to negative 68 bp from negative 54 bp.
While the week’s focus was on the Fed and the job numbers, other numbers were mixed. The job numbers, as we noted, appear to be mostly part-time jobs, not the necessary higher paying full-time jobs. That’s actually a bit negative despite the big jump. Earlier numbers saw the Case-Shiller home prices fall 0.2% when they were expected to rise 0.2%. Year-over-year house prices were up 5.4%, but that was under the 5.9% consensus. The JOLTS job opening surprised at 9.02 million vs. the expected 8.69 million. ADP employment rose only 107,000, below the expected 125,000 and the previous 158,000. That led many to believe the nonfarm would be weaker. It wasn’t. The Chicago PMI came in at 46, below December’s 47.2 and the expected 47. The Chicago PMI has been below 50 in recession territory now for 16 of the past 17 months. Weekly jobless claims rose to 224,000 vs. 218,000 the previous week and above the 215,000 consensus. Again, another indicator pointing to weaker nonfarm on Friday. Didn’t happen. The ISM manufacturing index was better at 49.1, above the expected 47, still in recession territory. We cover the Michigan Sentiment Index next.
Interest rates rose at week’s end, but follow-through this week will tell us if this is sustained. Our thoughts remain that interest rates have most likely topped. If we do break above the last high at 4.14%, then we could start to move towards 4.50%. However, a break back under 4.00% and especially under 3.50% would confirm a top.
Canada reports its job numbers next Friday, February 9, the inflation numbers are out on February 13, and retail sales on February 15.
U.S. and Canada Consumer Confidence 1999–2024
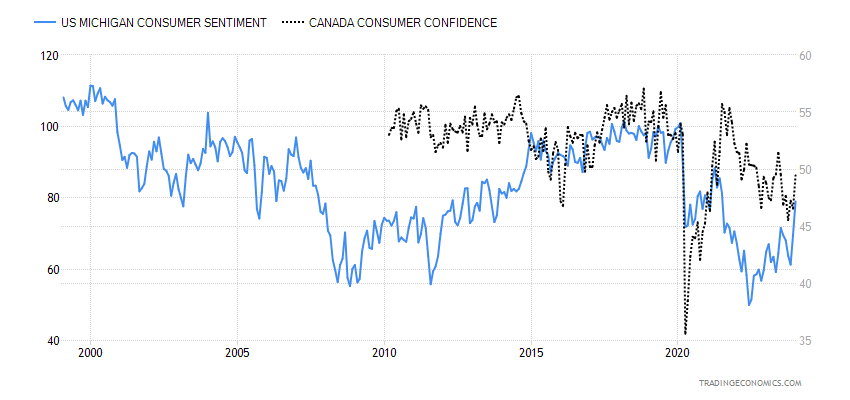
Source: www.tradingeconomics.com, www.umich.edu, www.ipsos.com
Well, you can’t say that consumers have lost their confidence. Both the Michigan Consumer Sentiment Index in the U.S. and the Consumer Confidence Index in Canada are not only pointed up, but they are at their best levels since 2021. War? That’s over there. Job losses? What job losses? Inflation? Hey, it’s coming down. But the prices at the grocery store are still high and interest rates are still too high. Nonetheless, the consumer sentiment indices are pointing to a much more robust consumer having crawled back from the lows of only a year ago. Back then, consumer sentiment was hovering around where it was during the early 1980s recession and even worse than during the financial crisis of 2008. Instead, it has been improving. Maybe things aren’t so bad after all. Heck, the stock markets are at record highs.
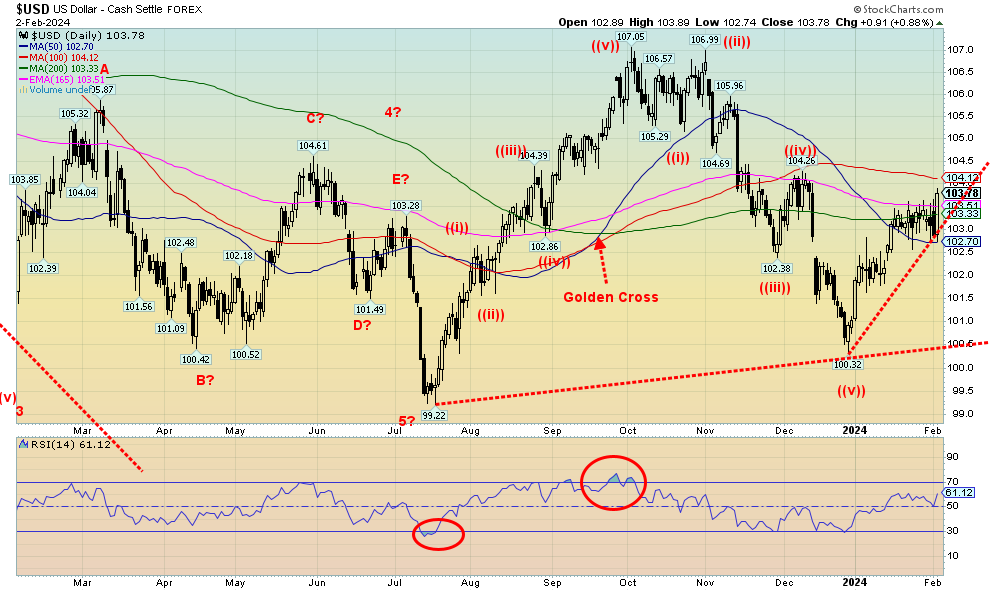
Source: www.stockcharts.com
The stronger than expected job numbers on Friday sent the US$ Index soaring up 0.9% and a gain of 0.4% on the week. The other currencies, as would be expected, fell. The euro fell 0.6%, the Swiss franc was off 0.3%, pound sterling dropped 0.5%, and the Japanese yen was down 0.2%. The Cdn$ lost as well, about 0.2%. The question now is, does the US$ index have the capability to break out over 104 and move to higher levels near 106? Gold responds positively to a falling US$ Index, not a rising one. The US$ Index has remained strong because the U.S. economy is stronger than any of the other G7 countries, its interest rates are higher, and funds continue to flow out trouble spots in the EU, China, and elsewhere in Asia. With the rise this week, the 103 level now becomes important support. A break of that level and especially under 102.70 could signal that a top is in. But a firm break above 104 sends the US$ Index higher towards 105 and 106. The US$ Index is clinging to an uptrend, but the pattern still appears to us as a corrective to the drop that occurred September to December when the index fell from 107.05 to a low of 100.32. Until we turn down and the points above break, the trend remains up.
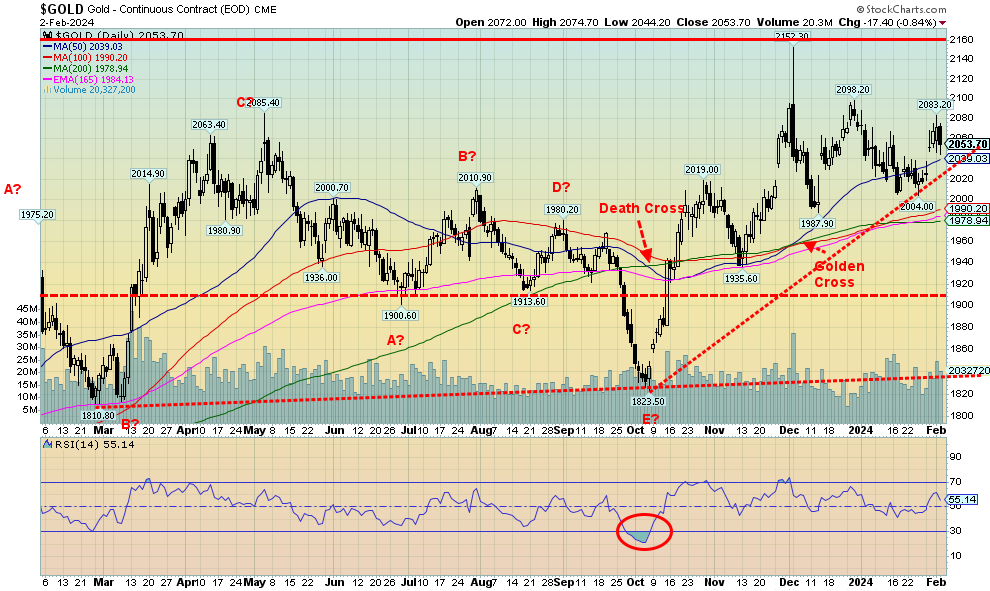
Source: www.goldchartsrus.com
A still somewhat hawkish Fed and what appear as barn buster job numbers almost wiped-out gold’s gains for the week. Gold shrugged off the Fed, but Friday’s job numbers sent gold tumbling 0.8[DC1] % and back under $2,060, a level it needs to overhaul. It also didn’t help that the US$ Index rose to its highest level in weeks. Nonetheless, we have often noted that gold needs to first regain above $2,060/$2,080, then above $2,100/$2,120 to suggest new highs above $2,152. And all the while holds preferably above $2,000/$2,020. We did get over $2,060, hitting a high of $2,083, but we failed to hold the level and on Friday fell back, closing just under $2,054. The resistance zone remains.
It was in some ways not good week for the precious metals. Yes, gold rose 1.8%, but silver fell 0.3% and platinum dropped 2.1%. The near PMs didn’t fare any better with palladium down 1.3% and copper falling 0.8%. Earlier gains for the gold stocks managed to help keep them slightly positive on the week. The Gold Bugs Index (HUI) rose 0.3% while the TSX Gold Index (TGD) was up 0.5%. If you are a gold bug, you were holding your head in despair by week’s end.
With the January Fed now behind us, the next meeting is not until March 19–20. The odds of a rate cut then have largely evaporated. After that it is the April 30–May 1 meeting and the June 11–12 meeting. Some are now pumping the May 1 meeting for a rate cut, but if one were to occur, a better chance would be June 12. At least that is what the market is hoping for.
The gold chart continues to appear positive. The Middle East wars are continuing and threatening to spread. Inflation is still present and the economy, despite the big jobs report, appears to be slowing, even as a recession still appears to be no closer. All point to decent conditions for gold. The stock market is still propelling higher, which, oddly, is also good for gold as the stock market is becoming giddy.
Our points are well defined for the next few weeks. Odds still favour that we might have seen our low in January and a rise should get underway. Now if only silver and the other metals would go with gold. Silver and the gold stocks remain cheap in comparison to gold. We’ve never seen it stay that way for such a prolonged period. It doesn’t last forever. The commercial COT for gold came in at 29%. Not exactly the level we want but an improvement from the previous week.
Gold, unfortunately, continues to take a back seat to the Magnificent Seven and even to Bitcoin and the cryptos. Gold just has not become a focus for many. The pundits on CNBC and BNN rarely talk about gold. Yet central bank buying continues and the World Gold Council expects more buying this coming year as demand outstrips supply. Gold has been money and currency for over 5,000 years and is still a store of value. Gold has no liability.
We remain bullish on gold and gold stocks going forward, but the points we note need to be taken out to send us to the next level.
Source: www.stockcharts.com
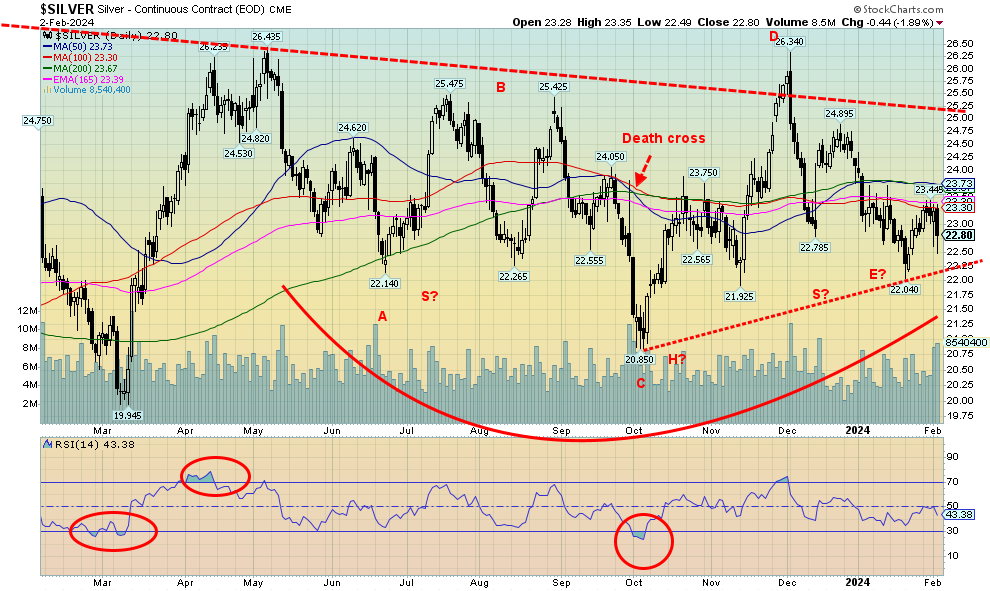
As with gold, silver dropped on Friday after the higher-than-expected jobs report. A somewhat hawkish Fed following the Fed announcement on Wednesday didn’t help. Silver actually fell on the week whereas gold rose. A divergence? Silver lost 0.3% on the week after falling 1.9% on Friday after the jobs report. As a result, silver fell back under $23. $24 remains elusive and resistance at $26/$27 seems even further away. It is that level that silver needs to overhaul if we are confirm a low, although a move over $25 would start the process. That and we hold above $22. Under $22 would not be good and could start us dropping to the October low of $20.85. Below $22 raises the odds that new lows would be seen. These levels of importance are not going to change over the next few weeks. The commercial COT was 34% this past week. Not exactly a barn buster, but at least mildly positive for silver going forward.
Source: www.stockcharts.com
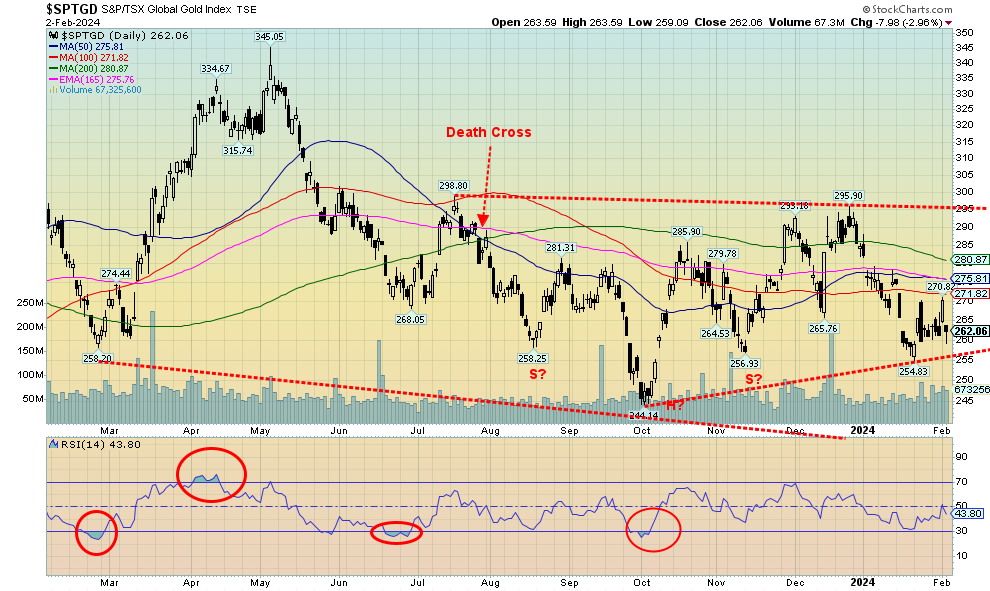
Gold gained on the week so the gold stocks managed to hang in despite Friday’s debacle. The TSX Gold Index (TGD) rose 0.5% on the week while the Gold Bugs Index (HUI) was up a more modest 0.3%. Except for Friday, the gold stocks would have looked better, but the TGD fell almost 8% on Friday, wiping out the earlier gains. Still, it left what looks like a small hammer on the charts and that pattern is more indicative of a bottom. The 100-day MA proved resilient, so the TGD has a lot of work to do. First it has to regain above 272 and, more importantly, close convincingly over 280. The final barrier is at 295. Above 300 we confirm a breakout with potential targets up to 350. First, however, 255 needs to hold, as below that level new lows below 244 become possible. A firm breakout over 300 would also confirm the yearly low most likely in. That low is just under 255. The levels are well defined for the next few weeks. Odds and seasonals still favour an up move.
Source: www.stockcharts.com
Oil can’t seem to figure out what it wants to do. A week ago, it was heading towards $80. Now it’s going the opposite way to $70. Natural gas just continues to be miserable. Middle East turmoil continues, but unsubstantiated rumours of a ceasefire between Israel and Hamas drove speculation that an end to that conflict would also end the other conflicts. Meaning the Houthis would stop bombing ships in the Gulf of Aden/Straits of Bab-El-Mandeb/Red Sea and that would also end the attacks on U.S. bases in Syria and Iraq. And even Jordan on the border of Iraq/Syria/Jordan. The U.S. responded to that attack that killed three U.S. servicemen, but the odds of that ending attacks are slim to none. The U.S. has vowed no attack on Iran, which many in the U.S. are calling for. Except an attack on Iran would escalate the conflicts and potentially threaten the shutdown or at least slowing of the Straits of Hormuz where 30% of the world’s oil flows through. Many say it doesn’t matter as North America produces lots of oil and the U.S. is the world’s largest producer. Nonetheless, a seizure in the Straits of Hormuz would impact global oil prices, regardless of how much is produced in North America by the U.S. and Canada.
On the week, WTI oil fell 7.4% while Brent crude dropped 6.8% and back below $80. Natural gas (NG) fell again, losing 4.2%, although EU NG bounced back, up 4.3%. The energy indices were in the red with the ARCA Oil & Gas Index (XOI) off 0.5% while the TSX Energy Index (TEN) dropped 4.1%.
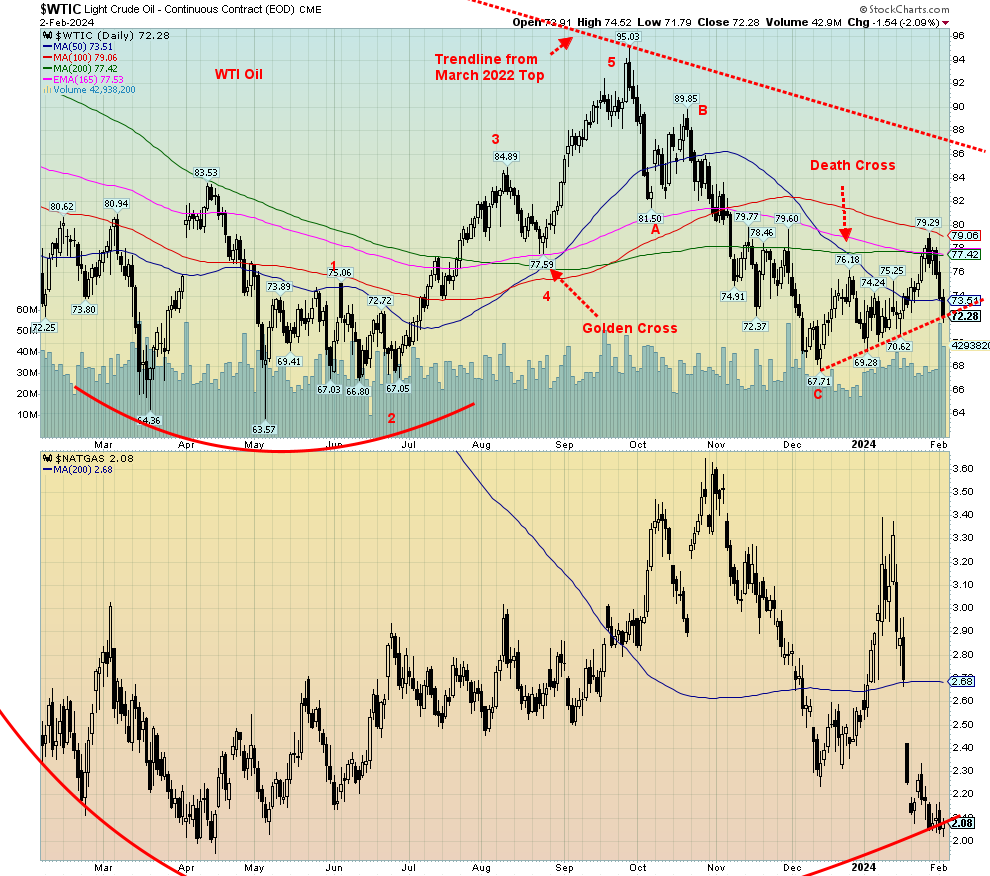
WTI, at least for the moment, is clinging to an uptrend line, but a drop through $72 would send it tumbling towards $70. Under $70.40 new lows become possible. We’ve fallen below the 50-day MA, not a good sign. WTI needs to regain back above $75 to begin to suggest a low. Nonetheless, if the trend line holds, it confirms the uptrend. Focus then moves back to $80, an area that needs to be overhauled to suggest the low is in. NG looks terrible, but it has become extremely oversold so odds suggest that it doesn’t have much, if any, further to fall. NG needs to fill that gap and regain back above $2.75, preferably above $3, to confirm a low.
With both oil and gas looking miserable, it is the energy stocks that have actually been outperforming. We view that as a positive divergence. Energy stocks are now expensive vis-à-vis WTI oil. And that ultimately is positive for WTI oil. And most likely NG as well. If WTI is rising, then the energy stocks will follow but at a slower pace, that’s all. We continue to believe a bottom is forming here for both oil and NG, but both need to respond higher. The catalyst for higher prices is most likely going to be helped by events in the Middle East. Warmer weather is not helping demand.
U.S. crude stocks remain low and need replenishing. However, gasoline stocks are plentiful and at the highest level in several months.
Copyright David Chapman 2024
GLOSSARY
Trends
Daily – Short-term trend (For swing traders)
Weekly – Intermediate-term trend (For long-term trend followers)
Monthly – Long-term secular trend (For long-term trend followers)
Up – The trend is up.
Down – The trend is down
Neutral – Indicators are mostly neutral. A trend change might be in the offing.
Weak – The trend is still up or down but it is weakening. It is also a sign that the trend might change.
Topping – Indicators are suggesting that while the trend remains up there are considerable signs that suggest that the market is topping.
Bottoming – Indicators are suggesting that while the trend is down there are considerable signs that suggest that the market is bottoming
Disclaimer
David Chapman is not a registered advisory service and is not an exempt market dealer (EMD) nor a licensed financial advisor. He does not and cannot give individualised market advice. David Chapman has worked in the financial industry for over 40 years including large financial corporations, banks, and investment dealers. The information in this newsletter is intended only for informational and educational purposes. It should not be construed as an offer, a solicitation of an offer or sale of any security. Every effort is made to provide accurate and complete information. However, we cannot guarantee that there will be no errors. We make no claims, promises or guarantees about the accuracy, completeness, or adequacy of the contents of this commentary and expressly disclaim liability for errors and omissions in the contents of this commentary. David Chapman will always use his best efforts to ensure the accuracy and timeliness of all information. The reader assumes all risk when trading in securities and David Chapman advises consulting a licensed professional financial advisor or portfolio manager such as Enriched Investing Incorporated before proceeding with any trade or idea presented in this newsletter. David Chapman may own shares in companies mentioned in this newsletter. Before making an investment, prospective investors should review each security’s offering documents which summarize the objectives, fees, expenses and associated risks. David Chapman shares his ideas and opinions for informational and educational purposes only and expects the reader to perform due diligence before considering a position in any security. That includes consulting with your own licensed professional financial advisor such as Enriched Investing Incorporated. Performance is not guaranteed, values change frequently, and past performance may not be repeated.
About the author


Website: https://www.enrichedinvesting.com
Disclaimer: David Chapman is not a registered advisory service and is not an exempt market dealer (EMD) nor a licensed financial advisor. We do not and cannot give individualised market advice. David Chapman has worked in the financial industry for over 40 years including large financial corporations, banks, and investment dealers. The information in this newsletter is intended only for informational and educational purposes. It should not be considered a solicitation of an offer or sale of any security. The reader assumes all risk when trading in securities and David Chapman advises consulting a licensed professional financial advisor before proceeding with any trade or idea presented in this newsletter. David Chapman may own shares in companies mentioned in this newsletter. We share our ideas and opinions for informational and educational purposes only and expect the reader to perform due diligence before considering a position in any security. That includes consulting with your own licensed professional financial advisor.