
“It is a sobering fact that the prominence of central banks in this century has coincided with a general tendency towards more inflation, not less. [I]f the overriding objective is price stability, we did better with the nineteenth-century gold standard and passive central banks, with currency boards, or even with ‘free banking.’ The truly unique power of a central bank, after all, is the power to create money, and ultimately the power to create is the power to destroy.”
—Paul Volker, American economist, 12th Chair of the Federal Reserve 1979–1987, Chair of the President’s Economic Recovery Advisory Board 2009–2011; 1927–2019
“I did not know that mankind were suffering for want of gold. I have seen a little of it. I know that it is very malleable, but not so malleable as wit. A grain of gold will gild a great surface, but not so much as a grain of wisdom. “
—Henry David Thoreau, American naturalist, essayist, poet, philosopher, author of Walden (1854), Civil Disobedience (1849); 1817–1862
"Courage taught me no matter how bad a crisis gets ... any sound investment will eventually pay off."
—Carlos Slim Helu, Mexican business magnate, investor, philanthropist, once ranked as wealthiest person in the world 2010–2013; b. 1940
Is the perfect storm brewing? A perfect storm is usually referred to in meteorological matters. It is defined as a perfect violent storm arising from a rare combination of adverse meteorological factors. But it is also defined as a particularly bad or critical state of affairs, arising from a number of negative and unpredictable factors.
We have those in spades, it seems. The energy storm has seen energy prices rise—oil, natural gas (NG), coal due to increasing demand, supply tightness, disruption in shipping, environmental concerns, and labour shortages. Coal hit a recent high of about US$269. A year ago, it was about US$55 for an increase of almost 390%. Similar, albeit smaller increases have been seen for other commodities. In Europe, NG prices went up roughly 500% from May to October, again primarily due to demand increase, supply shortages, and disruption in getting the product to market. There are labour shortages as well. After years of shutting down coal mines and firing workers, the ability to rev up new sources (or even old ones) is difficult due to a shortage of trained workers and disinterest in doing that dirty work, given its environmental challenges. Even sharply increasing wages draws little interest. Renewables are growing, but not quickly enough nor are they the total solution.
However, supply disruption goes beyond energy. Energy shortages have caused plants to close or at least curtail production, sparking shortages in almost everything, particularly for semi-conductors and more. China and India are two major manufacturers being hit particularly hard. One can’t just rev up a new plant in the U.S. overnight to replace the chips not coming from China or elsewhere. Container ships sit offshore due to a lack of longshore men. Supplies are not being delivered due to a lack of truckers. Air freight is dependent on passengers. Passenger traffic is still down 64% from 2019 levels, thus negatively impacting the transportation of supplies by air. Costs are up sharply. One breakdown in the supply results in a backup on all the supply chains going forward. For the consumer it shows up in parts and goods not available and empty shelves.
COVID continues to play a major role in preventing workers from taking jobs. Poor paying, part-time jobs with no benefits and uncertain hours are no panacea for full-time jobs with benefits. Travel restrictions due to COVID keep many temporary workers out who would normally fill low-paying dirty work. And, because of the pandemic, many have decided to do something else or they are constrained in caring for family, given uncertainty at schools and need for elderly care.
The labour market is actually tight. In the U.S., the official unemployment rate (U3) is 4.8%, translating into 7,674 thousand unemployed. There are an additional 5,969 thousand who are considered not in the labour force but want a job now. According to statistics, there are 10,934 thousand job vacancies. Except the unemployed and the openings don’t match up for many reasons. However, according to another statistic there were 15 million job quitters during the past year. All during a significant recession.
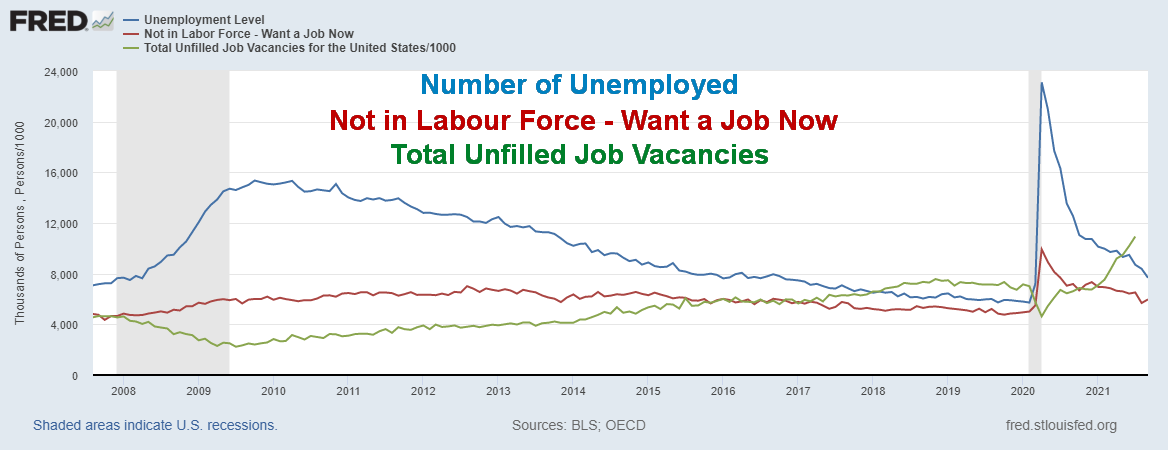
Source: www.bls.gov, www.stlouisfed.org
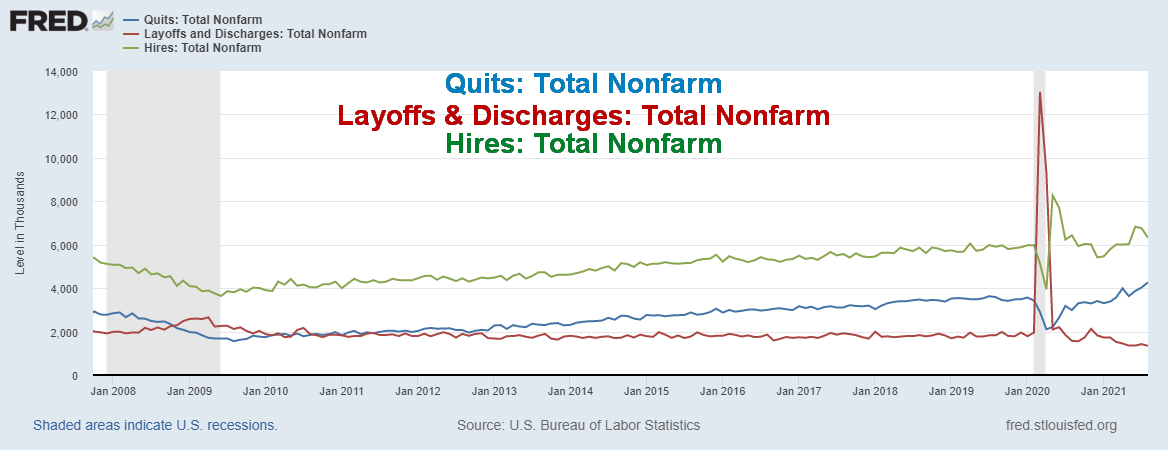
Source: www.bls.gov, www.stlouisfed.org
Notice that huge spike during the pandemic recession for layoffs and discharges. That hit 13,046 thousand at the peak and still stands at 1,343 thousand for August 2021. Does that mean many may be waiting to be called back? Quits totaled 4,270 thousand in August but hires totaled 6,322 thousand. However, the quits have been rising, a rather strange phenomenon. According to stats from the Atlanta Fed, the quits’ average wage gain is 5.4% after finding a new job.
Energy price inflation is probably the worst as it impacts just about everything, including food. But energy is only a part of it. The inability of the world to cut emissions is leading to a perfect storm of, well, storms: hurricanes, fires, rising sea levels, abnormally high precipitation in some areas, drought in others, and more. Given the steady rise in the earth’s temperatures, the peak of the climate storms has probably not yet arrived. As the temperatures rise, instability in countries grows, the number of climate refugees rises, and the costs just keep on going higher.
CPI, Core CPI, 10-Year US Treasury, Corporate BBB Yield 2007–2021
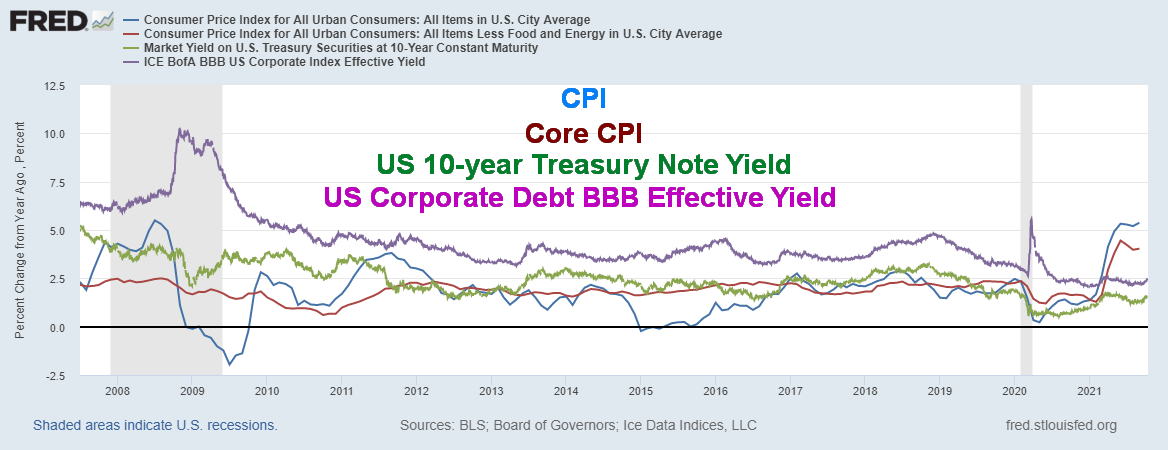
Source: www.stlouisfed.org, www.bls.gov, www.theice.com
There is also growing political instability. In geopolitics, the conflict between primarily the U.S. and China/Russia is more likely to deepen than it is to recede. However, domestic political instability threatens to make things worse. Numerous countries are being challenged by extreme right-wing groups leading to clashes, bombings, riots, and more. In the U.S., the lie that the 2020 election was stolen and fraudulent persists, setting the stage for a potential major clash not only at the 2022 mid-terms but the 2024 presidential election. If the fraudulent, stolen election lie persists, as it appears to be, then the outcome is foregone no matter what and a potential constitutional crisis becomes more likely, including states trying to secede. The breakup of the U.S. seems to be fantastical, improbable, but it has happened before: in 1861–1865. What would that mean to not just the U.S. but the world? The world is much different today than it was in 1861. However, the conditions that sparked the 1861–1865 secession movement, while different today, are in many other ways not dissimilar.
Our chart above shows inflation, comparing it to the yields on the 10-year U.S. treasury note and to U.S. corporate debt BBB-rated (the lowest investment grade). It is one thing seeing a negative spread for the CPI and Core CPI to the U.S. 10-year treasury note. That has happened on numerous occasions. However, it is unusual to see that BBB-rated debt is trading below the key rates of inflation. If we had compared them against the PPI the spread, the differential would be even worse. For the record, the CPI is +3.82%, while the Core CPI is +2.48. But CPI also exceeds BBB debt by +2.98% and Core CPI is +1.64% to BBB corporate debt.
Is it any surprise that, against this background, the IMF has lowered its forecasts for growth? They cited the supply chain disruptions and the deepening health situation in emerging economies. Studies have suggested that the number of COVID cases and deaths in Africa is grossly understated, as is in India. An earlier study by The Economist (“The pandemic’s true death toll” – updated October 15, 2021, original September 2, 2021) noted that the true death toll is estimated to be between 10.1 million and 19 million, averaging around 16.3 million. The official death toll is 4.9 million (www.worldometers.info/coronavirus). Africa and even India’s problems stem from weak health care systems and a lack of testing. The U.S continues to lead the world in cases and deaths, now up to 740 thousand, but excess deaths estimates put potentially the real toll to 840–970 thousand. There is no country that probably hasn’t underestimated the real death toll from COVID.
The Evergrande crisis appears to have moved off the front pages, but it hasn’t gone far. Evergrande has missed payments (most recently a $83.5 million interest payment last month) as have other developers. Chinese property developers have effectively been shut out of international bond markets. A large developer, Fantasia, went into default. This is going to bring a significant slowdown in China. And what happens in China has the potential to impact the world. Below is a picture of high-yield debt issues by Chinese developers during 2011–2021 (Billions of U.S. dollars).
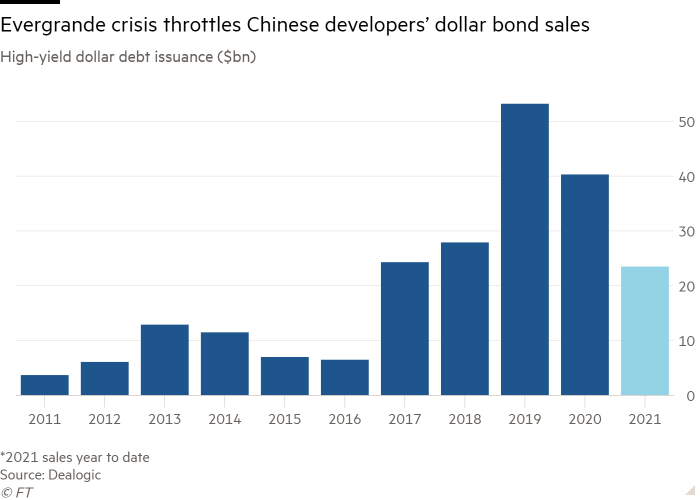
Source: www.ft.com, www.dealogic.com
Given that an estimated $77 billion of Chinese developer debt is up for renewal by next year, the odds of significant defaults are rising. Evergrande currently has problems with at least $148 billion of its bonds out of $300 billion, all denominated in U.S. dollars. It is concerning that China officialdom has not been overly active nor has PBOC (the central bank) in resolving these problems. However, many expect that they will eventually have to play their hand to stem a potentially disorderly (and possibly catastrophic) default. Many developers’ bonds are trading for 25 cents on the dollar or less and yields are soaring. Our chart of Bloomberg’s Chinese junk bond yields shows how sharply they have jumped recently. Even investment quality Chinese bonds have suffered with prices falling up to 20%.
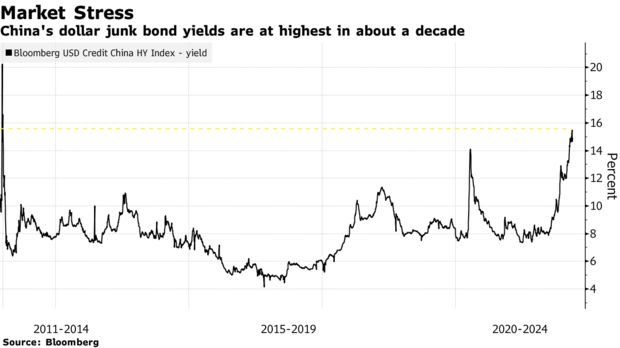
Source: www.bloomberg.com
Default remains on the agenda for the U.S. as the recent deals to extend spending and the debt limit are only good until early December (December 3 is being bandied about). The result is that the bitter fight will continue and once again the U.S. could be brought to the brink of default and a government shutdown. While many remain hopeful that a deal will prevent what could be catastrophic, the bitter partisanship fits with the divide and the fight for power by any means that is the U.S. today. This is something being recognized by a lot of people and it is a growing danger.
The perfect storm? Things are not shaping up too well for 2022 and beyond.
MARKETS AND TRENDS
|
|
|
|
% Gains (Losses) Trends
|
|||||
|
|
Close Dec 31/20 |
Close Oct 15/21 |
Week |
YTD |
Daily (Short Term) |
Weekly (Intermediate) |
Monthly (Long Term) |
|
|
Stock Market Indices |
|
|
|
|
|
|
|
|
|
S&P 500 |
3,756.07 |
4,471.37 |
1.8% |
19.0% |
up (weak) |
up |
up |
|
|
Dow Jones Industrials |
30,606.48 |
35,294.76 |
1.6% |
15.3% |
up |
up |
up |
|
|
Dow Jones Transports |
12,506.93 |
15,190.68 |
3.8% |
21.5% |
up |
up |
up |
|
|
NASDAQ |
12,888.28 |
14,897.34 |
2.2% |
15.6% |
neutral |
up |
up |
|
|
S&P/TSX Composite |
17,433.36 |
20,928.10 (new highs) |
2.5% |
20.1% |
up |
up |
up |
|
|
S&P/TSX Venture (CDNX) |
875.36 |
937.67 |
6.9% |
7.1% |
up |
down (weak) |
up |
|
|
S&P 600 |
1,118.93 |
1,363.91 |
0.4% |
21.9% |
up |
up |
up |
|
|
MSCI World Index |
2,140.71 |
2,325.26 |
1.7% |
8.6% |
neutral |
neutral |
up |
|
|
NYSE Bitcoin Index |
28,775.36 |
57,461.28 |
5.3% |
99.7% |
up |
up |
up |
|
|
|
|
|
|
|
|
|
|
|
|
Gold Mining Stock Indices |
|
|
|
|
|
|
|
|
|
Gold Bugs Index (HUI) |
299.64 |
255.50 |
6.2% |
(14.7)% |
up |
down |
neutral |
|
|
TSX Gold Index (TGD) |
315.29 |
281.81 |
4.8% |
(10.6)% |
neutral |
down |
neutral |
|
|
|
|
|
|
|
|
|
|
|
|
Fixed Income Yields/Spreads |
|
|
|
|
|
|
|
|
|
U.S. 10-Year Treasury Bond yield |
0.91 |
1.58% |
(2.5)% |
72.5% |
|
|
|
|
|
Cdn. 10-Year Bond CGB yield |
0.68 |
1.63% |
(3.1)% |
132.4% |
|
|
|
|
|
Recession Watch Spreads |
|
|
|
|
|
|
|
|
|
U.S. 2-year 10-year Treasury spread |
0.79 |
1.18% |
(8.5)% |
49.4% |
|
|
|
|
|
Cdn 2-year 10-year CGB spread |
0.48 |
0.81% |
(13.8)% |
68.8% |
|
|
|
|
|
|
|
|
|
|
|
|
|
|
|
Currencies |
|
|
|
|
|
|
|
|
|
US$ Index |
89.89 |
93.94 |
(0.2)% |
4.5% |
up |
up |
down (weak) |
|
|
Canadian $ |
0.7830 |
0..8075 |
0.6% |
3.1% |
up |
neutral |
up |
|
|
Euro |
122.39 |
116.0 |
0.2% |
(5.2)% |
down |
down |
up |
|
|
Swiss Franc |
113.14 |
108.34 |
0.4% |
(4.2)% |
neutral |
down |
up |
|
|
British Pound |
136.72 |
137.52 |
1.0% |
0.6% |
up (weak) |
down |
up |
|
|
Japanese Yen |
96.87 |
87.43 |
(1.9)% |
(9.8)% |
down |
down |
down |
|
|
|
|
|
|
|
|
|
|
|
|
Precious Metals |
|
|
|
|
|
|
|
|
|
Gold |
1,895.10 |
1,768.30 |
0.6% |
(6.7)% |
neutral |
down |
up |
|
|
Silver |
26.41 |
23.35 |
2.9% |
(11.6)% |
neutral |
down |
up |
|
|
Platinum |
1,079.20 |
1,058.90 |
3.0% |
(1.9)% |
up |
down |
up |
|
|
|
|
|
|
|
|
|
|
|
|
Base Metals |
|
|
|
|
|
|
|
|
|
Palladium |
2,453.80 |
2,076.60 |
0.2% |
(15.4)% |
neutral |
down |
neutral |
|
|
Copper |
3.52 |
4.73 |
10.6% |
34.4% |
up |
up |
up |
|
|
|
|
|
|
|
|
|
|
|
|
Energy |
|
|
|
|
|
|
|
|
|
WTI Oil |
48.52 |
82.28 (new highs) |
3.7% |
69.6% |
up |
up |
up |
|
|
Natural Gas |
2.54 |
5.41 |
(2.9)% |
113.0% |
up |
up |
up |
|
Source: www.stockcharts.com, David Chapman
Note: For an explanation of the trends, see the glossary at the end of this article.
New highs/lows refer to new 52-week highs/lows and in some cases all-time highs.
Source: www.stockcharts.com
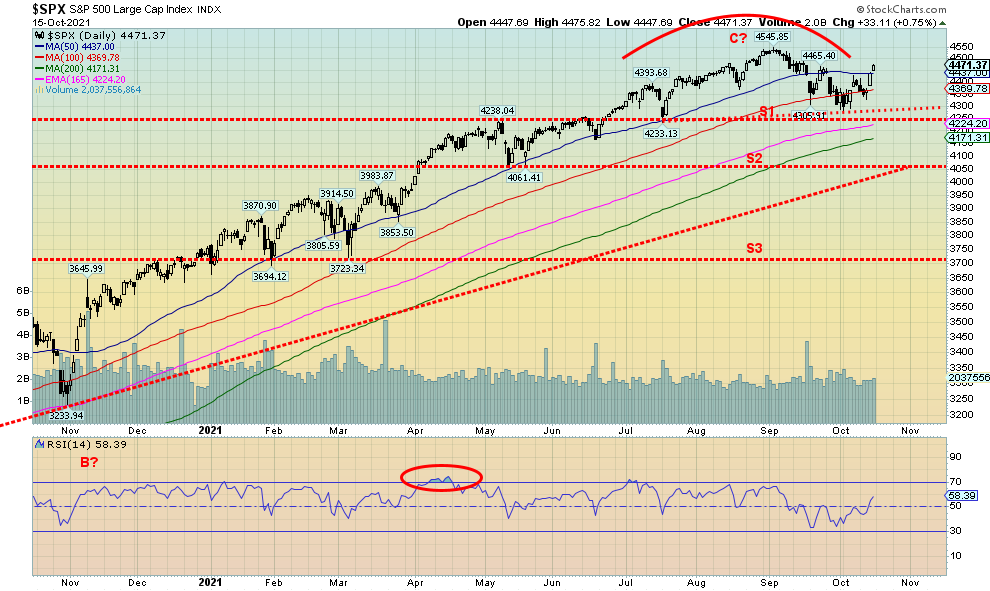
So, is this a bounce-back for the stock market or the start of yet another move to new all-time highs? In the face of rising inflation and sagging consumer confidence, the stock markets rallied this past week. Rallying on bad news supposedly exhibits strength. The S&P 500 gained 1.8%, the Dow Jones Industrials (DJI) was up 1.6%, the Dow Jones Transportations (DJT) continues a recent good run up 3.8%, while the NASDAQ gained 2.2%. Small cap stocks were the weakest as the S&P 600 gained a small 0.4%.
In Canada, the TSX Composite surprised, gaining 2.5% and making (just) new all-time highs. The small cap TSX Venture Exchange (CDNX) was strong, up 6.9% and is now positive on the year again up 7.1%. In the EU, the London FTSE was up 2%, the Paris CAC 40 was up 2.6%, and the German DAX gained .5%. In Asia, China’s Shanghai Index (SSEC) faltered, off 0.6% but the Tokyo Nikkei Dow (TKN) jumped again, up 3.6%. The MS World Index was up 1.7% while Bitcoin jumped 5.3%. We note Bitcoin is up even more, having cleared above $60,000 again by the weekend.
Despite the strong CPI and PPI numbers showing inflation, the U.S. 10-year treasury note actually slipped 4bp to 1.57%. Canada’s 10-year Government of Canada bond (CGB) also fell, off 5bp to 1.58%. Spreads fell sharply as well as the U.S. 2–10 spread fell to 1.18% from 1.29% and Canada’s 2–10 spread was down to 0.81% from 0.94%. Short rates rose, reflecting the rise in inflation while longer-dated bonds fell, seeing the weak economic numbers (manufacturing) and sagging consumer confidence.
Stocks were also responding positively to stronger than expected corporate earnings. On Friday, Goldman Sachs significantly beat its forecast and was the biggest gainer, up 3.8%. But then, all of the banks came in with better-than-expected results. 80% of reporting companies have surprised to the upside. The retail sales number that widely beat expectations also helped the stock markets to rise this past week. The attitude seems to be that inflation and supply chain issues haven’t dampened retail sales. Are consumers getting used to higher prices?
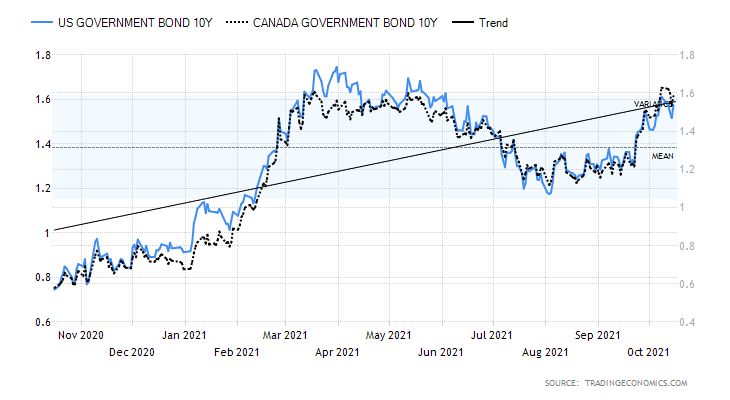
Source: www.tradingeconomics.com, www.home.treasury.gov, www.bankofcanada.ca
The NYSE advance-decline line is now headed to potentially new all-time highs. However, we note that on Friday when the DJI was up 300 points the AD line actually went negative. So, is that a negative sign for this coming week? Follow-through to the upside would be important if the indices are to once again make new all-time highs. But if this is a bear market rally as some suspect, we note that bear market rallies tend to be swift and sharp. That does characterize the action over the past week. Bull markets tend to be grinding affairs. So, a weakening AD line on Friday in the face of a sharp rally may be a warning sign. Market participants remain quite bullish with the put/call ratio falling to 0.48, the lowest level since mid-June. The S&P Bullish Percent Index (BPSPX) is at 60, well below bullish levels, while the percentage of stocks above their 200-day MA is up to about 74% but well below the peak of 95%+. The number over the 50-day MA is only 54%, well below peak levels over 90%. The VIX Volatility Index has fallen to just over 16, the lowest level since early September. The low for this current market was at 15.07 seen in early July 2021.
Energy was a strong performer this past week as oil prices continued to surge, with WTI oil now over $82 up 3.7% on the week to fresh 52-week highs. That helped push the energy indices to new 52-week highs as well with the ARCA Oil & Gas Index (XOI) up 1.5% and the TSX Energy Index (TEN) up 1.8%. Natural gas (NG) didn’t make the cut as it actually fell 2.9% this past week. On the TSX the TEN did not lead the way up this past week, helping the TSX Composite to fresh 52-week highs. The honour belonged to Metals & Mining (TGM), up 6%, while Materials (TMT) jumped 5.1% and Golds (TGD) was up 4.8%. The TSX sub-indices had no losers this past week.
Would we be surprised if the S&P 500 (and maybe a few others) made fresh all-time highs? No. Developing zig-zag patterns can see new highs despite the fact that we may have started a mini-bear. The bulls will disagree that we have even started one but the pattern for the decline from 4,537 to 4,300 did see the S&P 500 take out some previous daily lows. It was the most significant drop under 50-day MA since a year ago October. The S&P 500 lost 5% in the decline, well short of our thoughts of a decline of at least 10%. Taking out 4,485 will tell us that the odds of new highs have jumped considerably. The high this past week was 4,475. Only a return to the downside and breaking under 4,300 would suggest that we are then firmly in our next decline. We still have to deal with the debt limit struggle by December 3 and the Fed is hinting at tapering in the latter part of November. The FOMC meets November 2–3.
Source: www.stockcharts.com
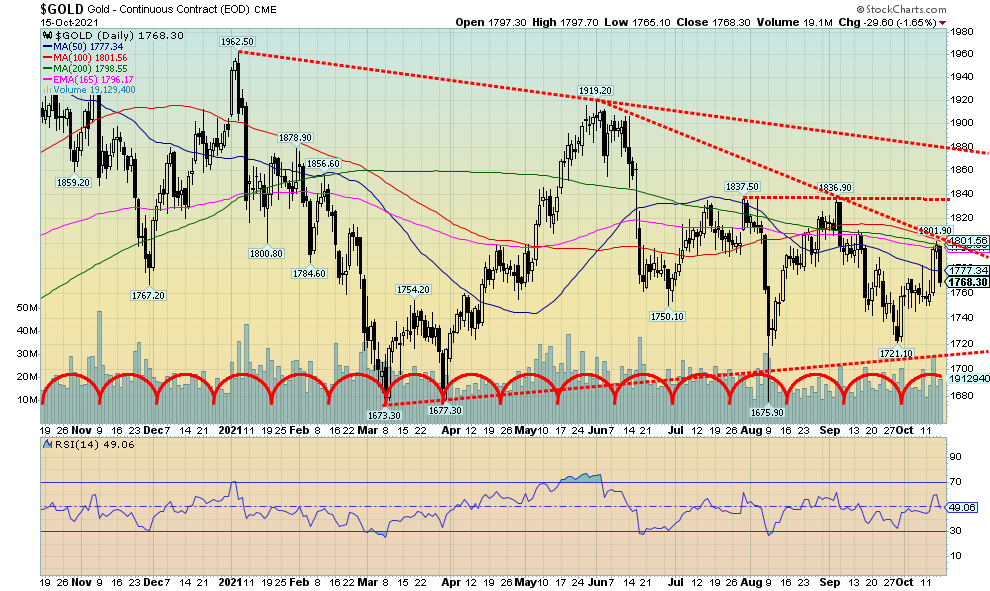
Gold was poised to put in its best week in months when better than expected retail sales numbers (+0.7% in September vs. 0.9% in August and expectations of a 0.2% decline) knocked gold for a loop on Friday. The breakout point was seen at $1,800/$1,810, although the final and more important breakout point is at $1,835/$1,850. The catalyst for gold’s leap of some $30+ on Wednesday was the CPI numbers followed by the PPI numbers on Thursday that indicated that the U.S. economy could be headed for stagflation. Despite the strong retail sales numbers, the NY Empire State Manufacturing Index came in at a disappointing 19.8 vs. an expectation of at least 27 while the Michigan Consumer Sentiment Index came in under forecast at 71.4 vs. an expected 73.1. It was the second lowest Michigan Consumer Sentiment Index seen since 2011. So, which is it? Strong economy as defined by retail sales or weakening economy defined by consumer sentiment and manufacturing?
Inflation is exceeding expectations. But the economy is, it seems, on life support. These are the conditions for stagflation. Historically, stagflation has hurt equities as we saw during the 1970s. Commodities and gold have done well under those conditions in the past. That we also have negative interest rates also helps gold because the cost to carry is negible. Demand has been strong. The only thing holding it back is the stickiness of the price. Gold’s price is determined not so much by the physical gold market but by the paper gold market; i.e., derivatives. Many believe gold is being manipulated.
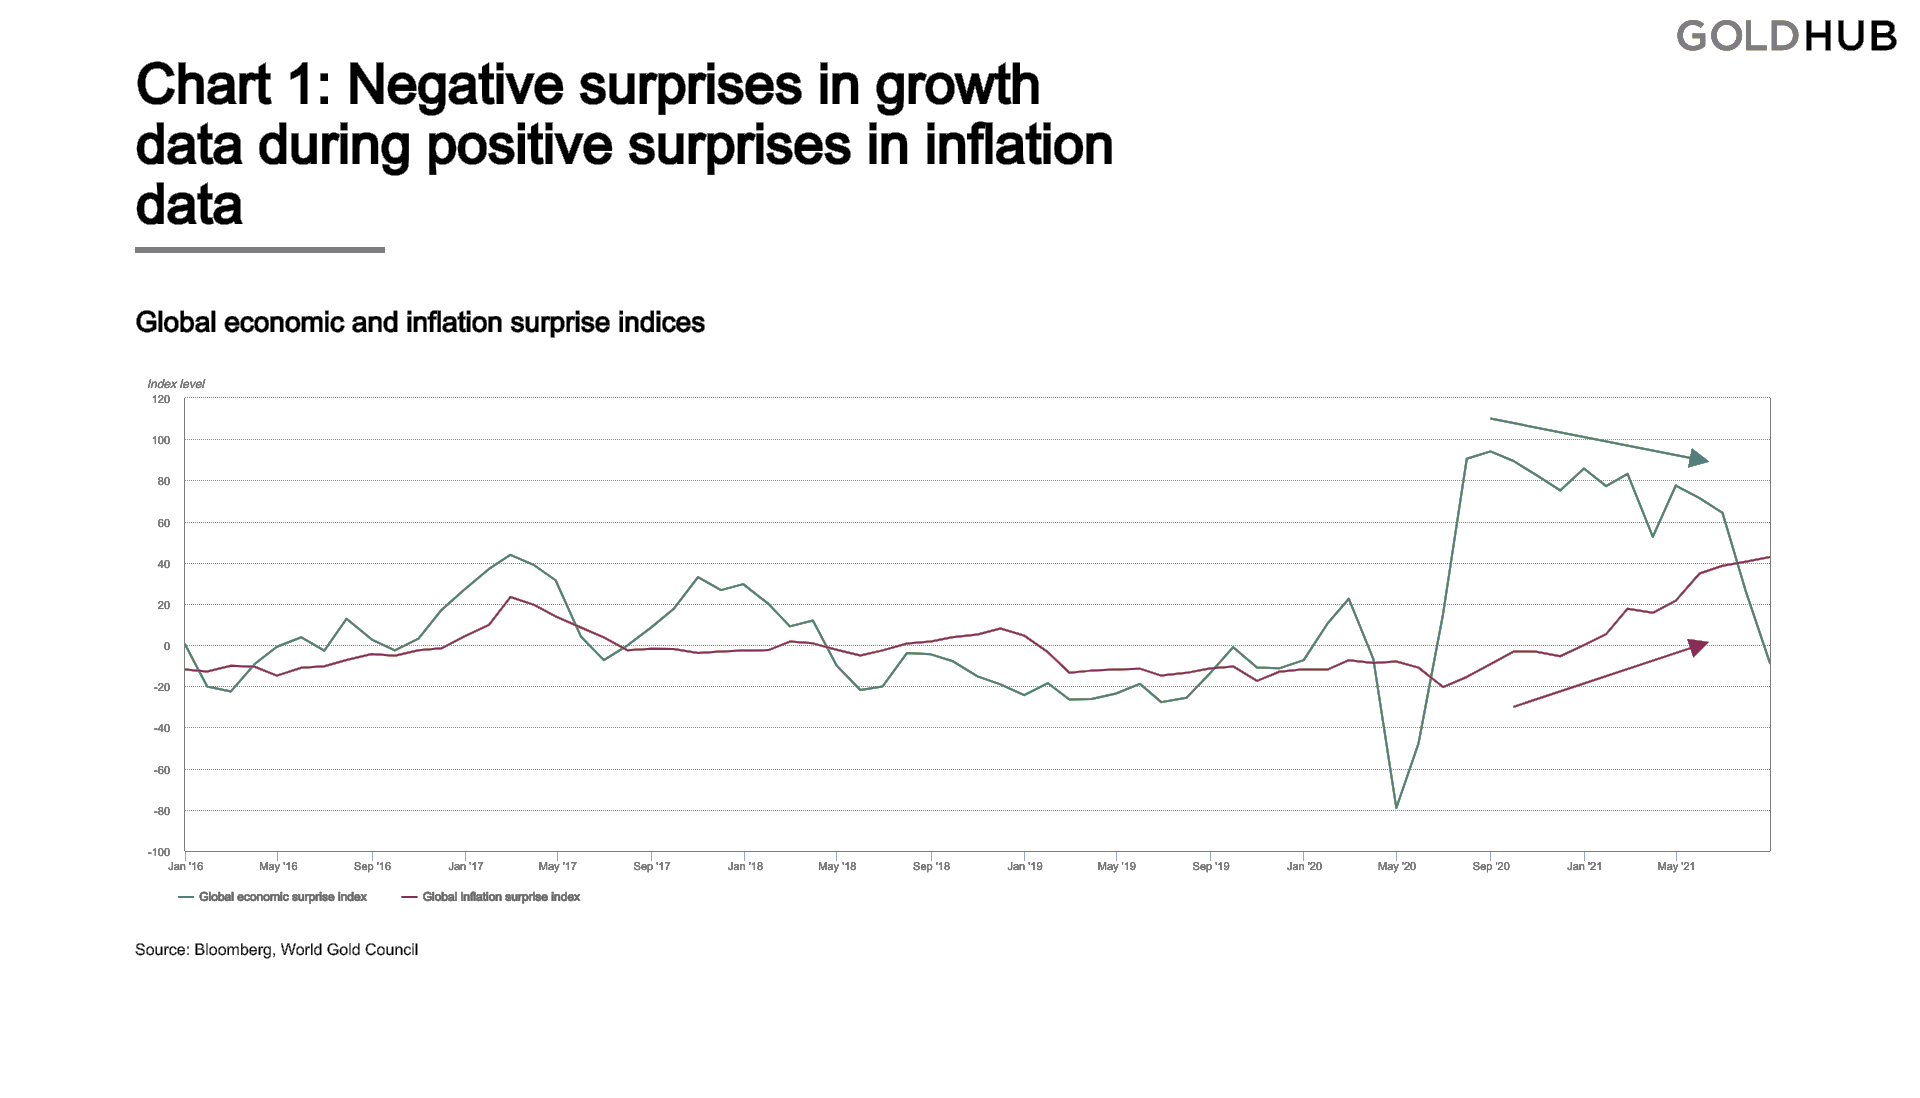
Source: www.gold.org, www.bloomberg.com
Above is an interesting chart from the World Gold Council. It tracks the global economic surprise index and the inflation surprise index. The green line (looks blue above) is the economic surprise (falling), the red line is the inflation surprise (rising). There are numerous indications that the global economy is slowing even as inflation is rising. It is all pointing to a stagflationary environment in Q3 2021 and as we head into Q4 and 2022.
Despite Friday’s setback for gold, a nascent bull market may be underway. On the week gold rose 0.6%; however, silver was up 2.9%. Even as gold sold off sharply on Friday, silver’s decline was in percentage terms considerably less. As well, the gold stocks put in a good week. The Gold Bugs Index (HUI) gained 6.2% while the TSX Gold Index (TGD) was up 4.8%. The strong performance by the gold stocks for the second week in a row may indicate that the gold stocks are leading. Other metals also rose as platinum was up 3.0% while palladium gained 0.2%. Copper also gained sharply on the week, up 10.6%.
Our second chart shows the durability and frequency of stagflation. Those periods are defined by falling consumer confidence and rising inflation. The chart shows the year-over-year changes in consumer confidence (grey line – which is volatile) vs. year-over-year core CPI (blue line – which appears to be more stable). Gold has outperformed during those periods of stagflation while the broader stock market has faltered. While past performance does not necessarily predict the future, it is something to consider. Traditionally, defensive assets are better suited and, in this case, gold is considered to be a defensive asset. Not, as Warren Buffett famously said about gold, as an asset with no utility nor, as John Maynard Keynes called gold, “a barbarous relic.” 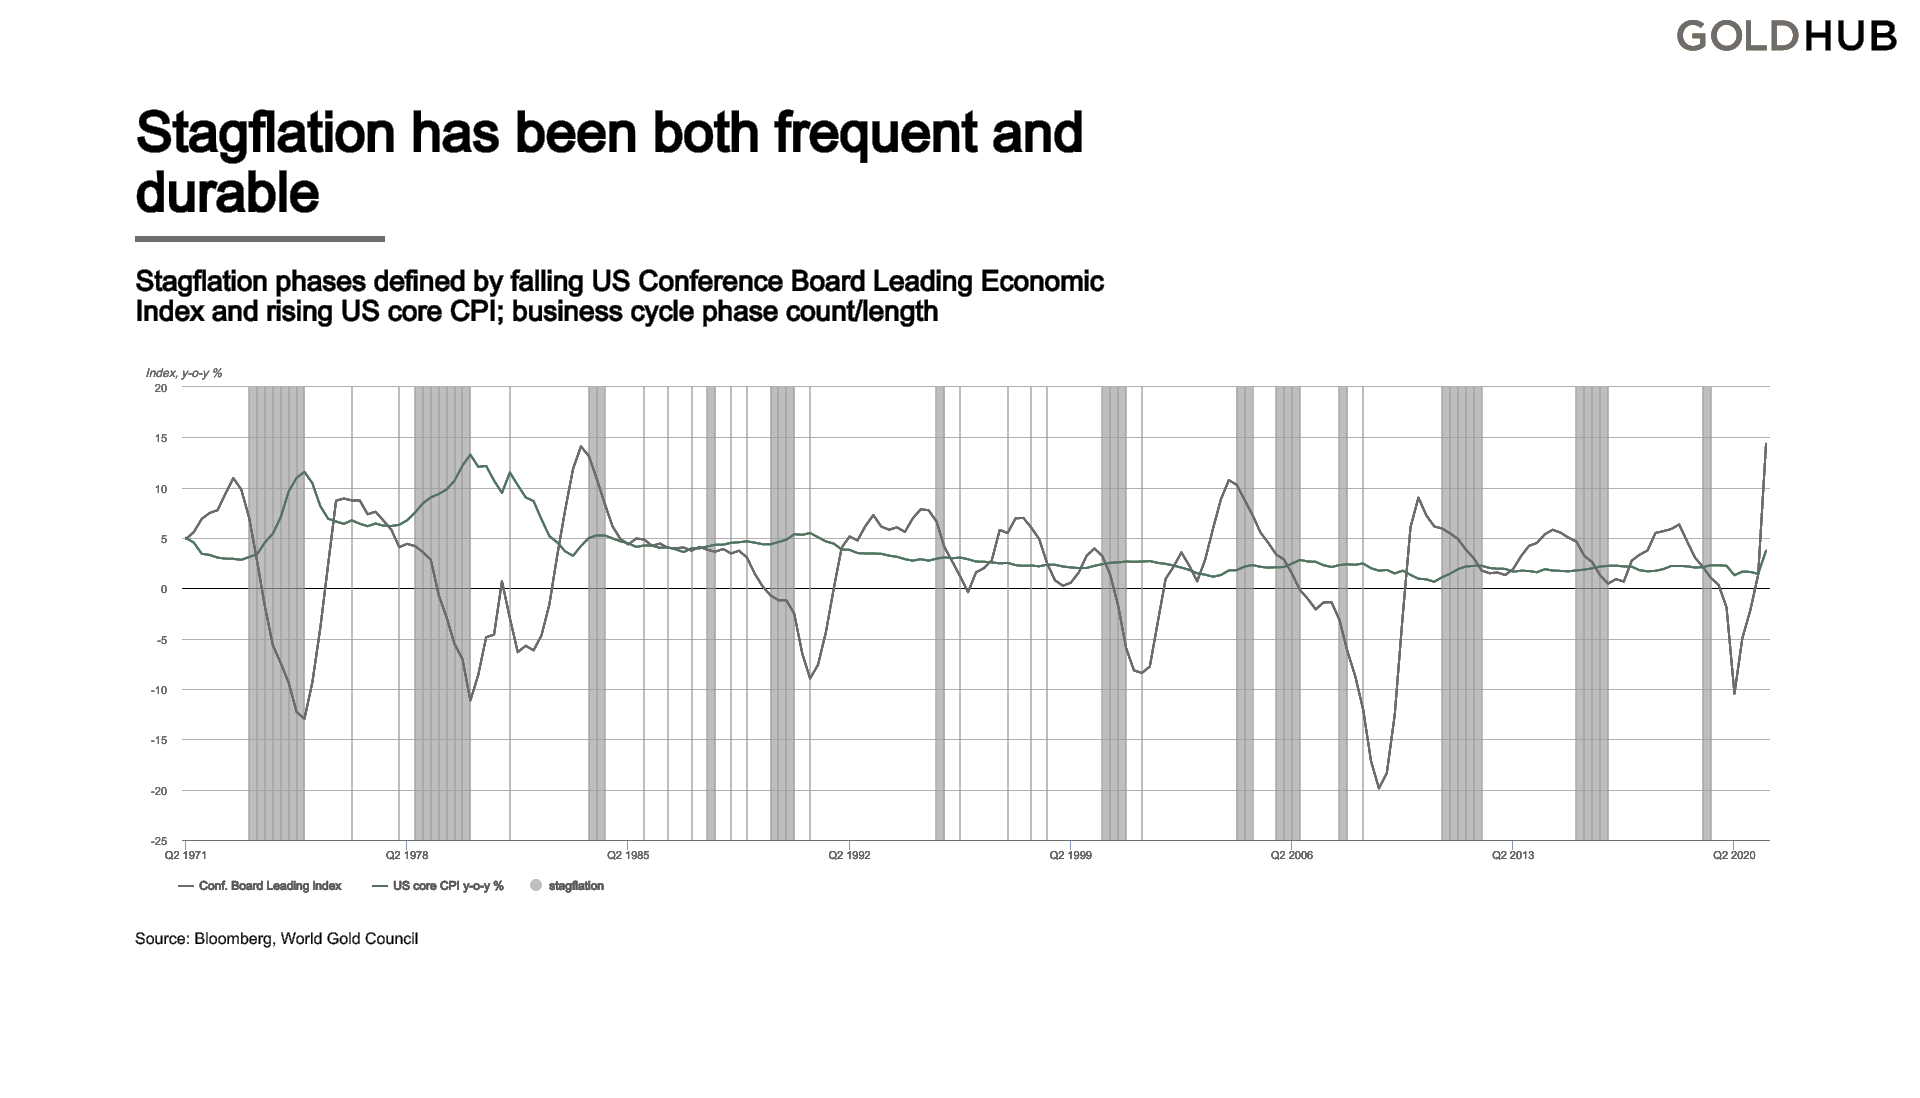
Source: www.gold.org, www.bloomberg.com
While it is a little difficult to see, the chart above depicts the consumer confidence index vs. gold. Falling U.S. Conference Board Leading Index (consumer confidence) (grey line) and rising core CPI (green line) have preceded recessions. This one actually shows the Conference Board index rising but, given the direction of the Michigan Consumer Confidence Index falling, the next reading for the Conference Board Index should see it falling.
Stagflation is good for gold. But on Friday gold was pushed back sharply, just under its potential breakout level. Is this meaningful? It will be if gold were to fall first back under $1,750 and especially back under $1,720. We don’t want to be nervous, but until the upside points are taken out technically the risk remains to the downside. For silver, we’ll feel a bit better once we successfully clear $23.60 and above $24. We would absolutely not want to see silver trade back below $22.50 and especially under $22. Then new lows are highly likely.
The US$ Index slipped this week but was not significantly down less than 0.2%. The best performer was the pound sterling, up about 1%. The oil-driven Canadian dollar gained 0.6% while the euro was up 0.2% and the Swiss franc up 0.4%. The Japanese yen continues its weakness, down 1.9%.
For gold, we are both optimistic of an upside breakthrough but cautious that the downside may not yet be finished. At least until we can successfully take out upside breakout points.
Copyright David Chapman, 2021
|
GLOSSARY Trends Daily – Short-term trend (For short-term swing traders) Weekly – Intermediate-term trend (For intermediate-term trend followers) Monthly – Long-term secular trend (For long-term trend followers) Up – The trend is up. Down – The trend is down Neutral – Indicators are mostly neutral. A trend change might be in the offing. Weak – The trend is still up or down but it is weakening. It is also a sign that the trend might change. Topping – Indicators are suggesting that while the trend remains up there are considerable signs that suggest that the market is topping. Bottoming – Indicators are suggesting that while the trend is down there are considerable signs that suggest that the market is bottoming. |
Disclaimer
David Chapman is not a registered advisory service and is not an exempt market dealer (EMD) nor a licensed financial advisor. We do not and cannot give individualised market advice. David Chapman has worked in the financial industry for over 40 years including large financial corporations, banks, and investment dealers. The information in this newsletter is intended only for informational and educational purposes. It should not be considered a solicitation of an offer or sale of any security. The reader assumes all risk when trading in securities and David Chapman advises consulting a licensed professional financial advisor before proceeding with any trade or idea presented in this newsletter. David Chapman may own shares in companies mentioned in this newsletter. We share our ideas and opinions for informational and educational purposes only and expect the reader to perform due diligence before considering a position in any security. That includes consulting with your own licensed professional financial advisor.
About the author


Website: https://www.enrichedinvesting.com
Disclaimer: David Chapman is not a registered advisory service and is not an exempt market dealer (EMD) nor a licensed financial advisor. We do not and cannot give individualised market advice. David Chapman has worked in the financial industry for over 40 years including large financial corporations, banks, and investment dealers. The information in this newsletter is intended only for informational and educational purposes. It should not be considered a solicitation of an offer or sale of any security. The reader assumes all risk when trading in securities and David Chapman advises consulting a licensed professional financial advisor before proceeding with any trade or idea presented in this newsletter. David Chapman may own shares in companies mentioned in this newsletter. We share our ideas and opinions for informational and educational purposes only and expect the reader to perform due diligence before considering a position in any security. That includes consulting with your own licensed professional financial advisor.