
“It isn’t important to buy as cheap as possible as it is to buy at the right time.”
—Jesse Livermore, stock trader, considered a pioneer of day trading, basis for the main character of Reminiscences of a Stock Operator by Edwin Lefèvre; 1877–1940
“The time to buy is when blood is running in the streets.”
—Baron Nathan Rothschild, English-German banker, 1st Baron of Rothschild, businessman, financier; 1777–1836
“Gold, unlike all other commodities, is a currency…and the major thrust in the demand for gold is not for jewelry. It’s not for anything other than an escape from what is perceived to be a fiat money system, paper money, that seems to be deteriorating.”
—Alan Greenspan, American economist, 13th Chair of the Federal Reserve 1987–2006, private advisor Greenspan Associates LLC; b. 1926
The Jackson Hole Economic Symposium is an annual event held in Jackson Hole, Wyoming since 1981. It is one of the longest standing central banking conferences in the world. It is sponsored by the Federal Reserve Bank of Kansas City. Attendees include not only top central bankers from around the world but many major economists and policy makers from governments, global corporations, and banks. It is well covered by the large contingent of journalists from major media around the world. In short, Jackson Hole is a “big deal.”
What Jackson Hole is not is a bore fest. The gathering may be small but it is significant as the meeting is often hyped and markets breathlessly await its happenings, even though in the end there is usually more smoke than fire. The views of the Grand Teton Mountains from the Jackson Lake Lodge are spectacular. All eyes were on this year’s meeting, awaiting in particular Fed Chair Jerome Powell’s August 26 speech where he was expected to confirm the ongoing Fed tightening and express some concern about the potential for a slowing economy. But overall, the brouhaha over the symposium was, as usual, overhyped. It is the numbers that dictate the “tale of the tape,” not the gathering of a bunch of central bankers.
As if on cue, Fed Chairman Jerome Powell said the U.S. economy will need tight monetary policy "for some time" before inflation is under control, which means slower growth, a weaker job market, and "some pain" for households and businesses. There is no quick cure for fast-rising prices. "Reducing inflation is likely to require a sustained period of below-trend growth.” The Fed’s fight to tame inflation is “unconditional.” Everybody thought the Fed was going to pivot to an easier stance, so the result was the markets gained over 15% since the low in June. Instead, the markets responded to Powell’s speech with the DJI falling over 1000 points. Everything was hit: stocks, gold, oil, cryptos. Is the mini-party over? Don’t fight the Fed.
Since peaking in mid-April, the Fed’s assets have fallen a small $115.7 billion or 1.3%. The Fed’s taper tantrum that got underway in January 2015 saw the Fed shed $753 billion over the next four years or 16.7%. The low came in August 2019 and following that, the Fed mysteriously began to expand its balance sheet once again.
Then along came the COVID crisis. The Feds and all central bank balance sheets exploded to
prevent the fast, steep, but short-lived recession from becoming an economic disaster and potential depression.
The massive injection of liquidity into the financial system, along with huge fiscal programs to assist the unemployed and the businesses impacted because of the pandemic, plus the lowering of interest rates to zero and even below, sparked a bubble in the stock market and housing market. It sparked wild and crazy mania speculation in Special Purpose Acquisition Companies (SPACs), non-fungible tokens (NFTs), cryptocurrencies, and meme stocks. Even cannabis stocks had their day in the sun. Most, if not all, have now crashed back to earth, with many disappearing completely. Cryptos have fallen on average 64% from their highs, SPACs are down over 50%, NFTs have collapsed some 75% in terms of sales with the NFT Index down over 70%, and meme stocks have gone through a wild ride with tens of billions of dollars being lost. The bubble has burst. The housing market is starting to crack and the stock markets are not yet finished.
Federal Reserve Balance Sheet 2008–2022
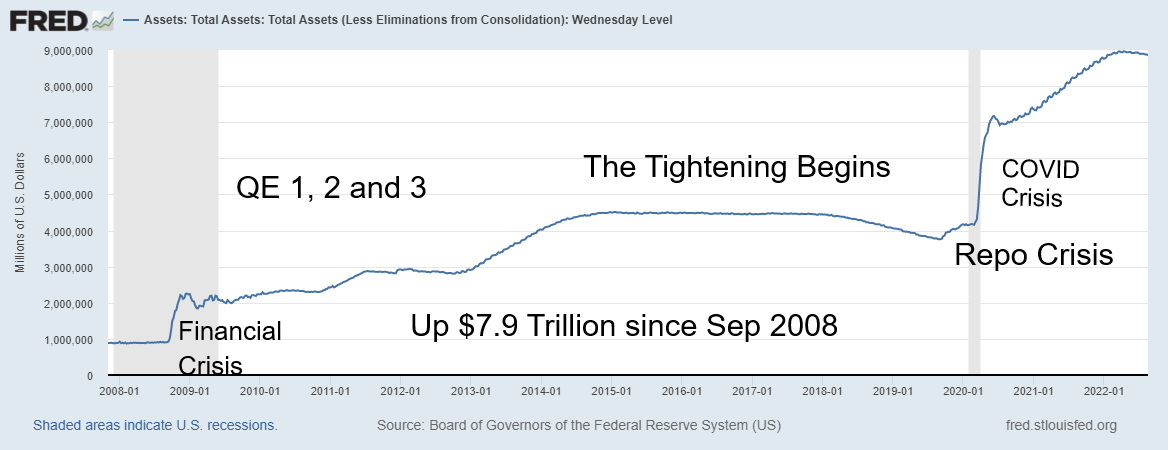
Source: www.stlouisfed.org
So, what was the Fed expecting to happen? What they are hoping for is a soft landing. What’ll they get is more likely a hard landing. Too many excesses have been built up in stock valuations, housing prices, speculative plays, and debt. The question is, can a long overdue reckoning be avoided?
Technically, we are already in a recession despite the marginally improved Q2 GDP that was revised to negative 0.6% from negative 0.9%. Combined with the negative 1.6% growth in Q1, we’ve had the technical definition of a recession with two consecutive quarters of negative growth. What we don’t have is an official recession and some economic numbers continue to come in positive. Examples are manufacturing indices and
ongoing strong profits for corporations as well as low unemployment (U3) and a large number of job openings. Gross Domestic Income (GDI), another measure of GDP, has been falling but slowly and has not as yet turned negative. Most of these indicators tend to be lagging indicators.
But reality strikes. While there is some chance that inflation has peaked, temporarily at least, only a severe slowdown would most likely help bring inflation down further. The Fed’s goal of 2.0% inflation is not going to be met for some time. The signs are there for a potentially severe recession. Since 1950, every time inflation has gone up over 5% and unemployment has fallen under 5% a recession has followed. As well, every time the yield curve turned negative, as measured by the 10-year treasury note minus the 2-year treasury note (currently negative 0.35%), a recession has followed from six months to a year later. We now have all these conditions present.
Severe bear stock markets are not unusual (bear markets where indices fall 30% or more and coinciding with a recession). Since 1929 there have been five of them or roughly one every 15 to 18 years. Not counted were the crash of ’87 when the market fell 36% and the pandemic crash of 2020 when the market was down 37%. Both were short-lived. Our focus is on ones that last at least a year and more likely longer.
The Major Bear Markets Dow Jones Industrials (DJI) Since 1929
|
Bear Market |
A Wave |
B Wave |
C Wave |
Duration (days) |
Duration since last Bear Years |
|
1929–1932 |
(47.8)% |
+48.0% |
(86.0)% |
1,039 |
5.9 |
|
1937–1938 |
(14.9)% |
+14.4% |
(47.7)% |
386 |
4.7 |
|
1973–1974 |
(20.8)% |
+18.0% |
(42.9)% |
694 |
34.8 |
|
2000–2002 |
(31.4)% |
+32.4% |
(32.6)% |
999 |
25.1 |
|
2007–2009 |
(18.1)% |
+12.9% |
(50.7)% |
517 |
5.0 |
|
Average |
(26.6)% |
+25.1% |
(52.0)% |
727 |
15.1 |
|
2022-? (so far) |
(19.7)% |
+15.6%?? |
??? |
233?? |
12.8 |
Source: www.stockcharts.com
There was a consistent pattern for each of these bear markets. They all unfolded in an ABC pattern. While on average the A wave down and B wave up waves were roughly equal, it was the C wave down that was the killer. The C wave usually measured twice the length of the A wave.
The Great Depression crash of 1929–1932 is the mother of all crashes. Following the initial 48% crash in October/November 1929, the rebound rally carried into April 1930, gaining 48%. A reminder, though, that the market would have had to gain 92% to regain its September 1929 high. Then began the biggest stock market
decline. From April 1930 to July 1932 the Dow Jones Industrials (DJI) fell 86%. The rebound rally from November 1929 to April 1930 gave hope that the worst was over—the classic sucker’s rally. Then the real carnage got underway.
The Mother of All Bears, The Great Depression – 1929–1932
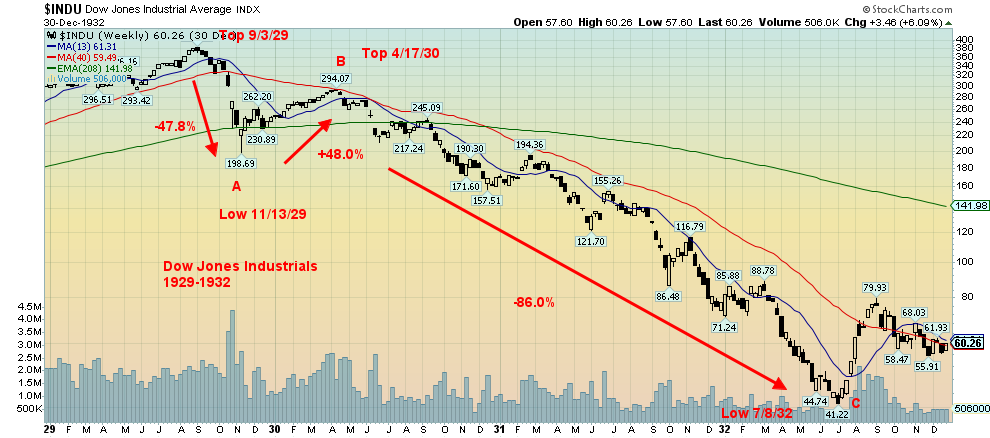
Source: www.stockcharts.com
The Recession within the Great Depression Crash – 1937–1938
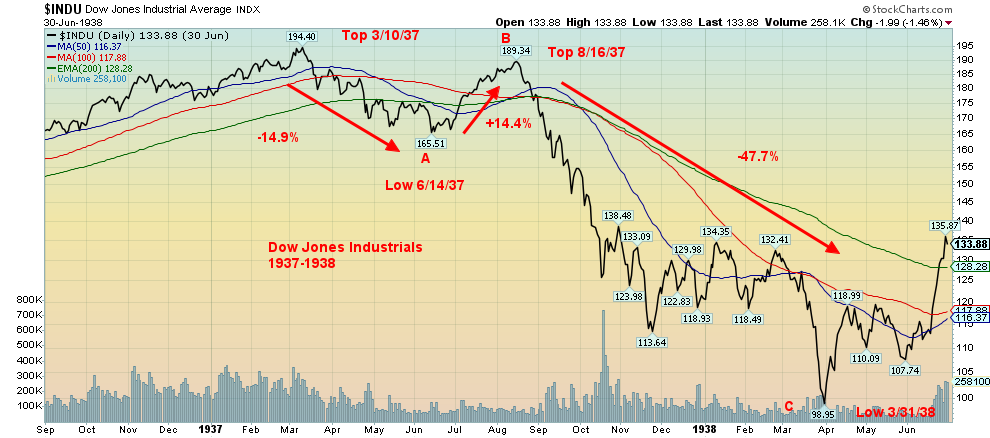
Source: www.stockcharts.com
The crash of 1937–1938 was triggered by doubts about the effectiveness of Roosevelt’s New Deal, fiscal tightening to balance the budget, and Fed tightening. While not as devastating as the 1929–1932 crash, markets nonetheless crashed almost 50% before bottoming in late March 1938. The winds of war helped recover the market, but the highs of March 1937 were not seen again until 1945. The final bottom did not come until April 1942 when the tides of war shifted in the Pacific, giving hope that the war might end soon.
Many of us remember the Arab oil embargo of 1973, triggered by the Arab objections to Israel over the Yom Kippur war. Saudi Arabia led OPEC in the embargo. The period was also one of high inflation leading to stagflation. As well, the Watergate crisis was ongoing in Washington, leading eventually to what was known as the Saturday Night Massacre in October 1973 and the resignation of President Richard Nixon. That the Saturday Night Massacre and the Arab oil embargo got underway in October 1973 may have been a coincidence.
The 1990s were one of the longest periods of U.S. economic growth in American history up until then. It was also a period of monetary expansion that helped trigger a bubble in the high-tech and dot.com growth stocks of the era. It all came to an end in 2000 when many discovered that those dot.com and high-tech companies made no money and the great promises were difficult to keep. The market crashed, but not by much. It chopped around into 2001 then came September 11, 2001, known colloquially as 9/11 and the onset of the war on terror. By October, the invasion of Afghanistan was underway. The recovery was spectacular as the DJI gained back most of its losses, but by March 2002 reality set in about the war on terror and the high-tech– dot.com market. The market crashed, only about 33% but overall, the DJI was down just under 40% from its January 2000 high. The tech-heavy NASDAQ fell 78% from March 2000 to October 2002. Surprisingly, the overall recession was short-lived and relatively shallow, with those involved in the high-tech–dot.com industries feeling the effects the most.
Nonetheless the 9/11 crash led to another round of ultra-low interest rates and flooding the financial system with money. That in turn fueled a new bubble, this time in housing. While the housing bubble topped out in 2006, it was the collapse of some obscure Bear Stearns funds involved in the sub-prime mortgage market in July 2007 that helped get the crash of 2008 underway. High oil prices due to huge surges in demand with the growth of China and Asia, coupled with rising food costs, also weighed on markets. In September 2008 Lehman Brothers collapsed, triggering a potential global financial meltdown. But it was not just Lehman Brothers as the house of cards in the banking industry led by Fannie Mae and Freddie Mac (two huge mortgage lenders), along with the giant insurance company AIG, also either collapsed or came close. The stock market crashed and when it finally bottomed in March 2009 the DJI had fallen over 50%. It all led to the biggest bailout in history as the central banks lowered interest rates to zero or below and a new term called quantitative easing (QE) was born. The subsequent recession was the steepest since the post-war recession in 1946. All of this laid the groundwork for the everything-bubble of the 2010s. The 2020 pandemic crash was short-lived but the very steep recession laid the groundwork for where we are today.
We are calling this the Great Reckoning crash. Contributing to it have been years of massive monetary stimulus, massive unsustainable debt growth, an emerging climate crisis, growing threat of global war, and a domestic political crisis, not just in the U.S. but in much of the Western world where xenophobic extreme right
groups have been on the rise. This portends the clash of political ideologies and possibly a prolonged period of social unrest.
The Arab Oil Embargo Crash – 1973–1974
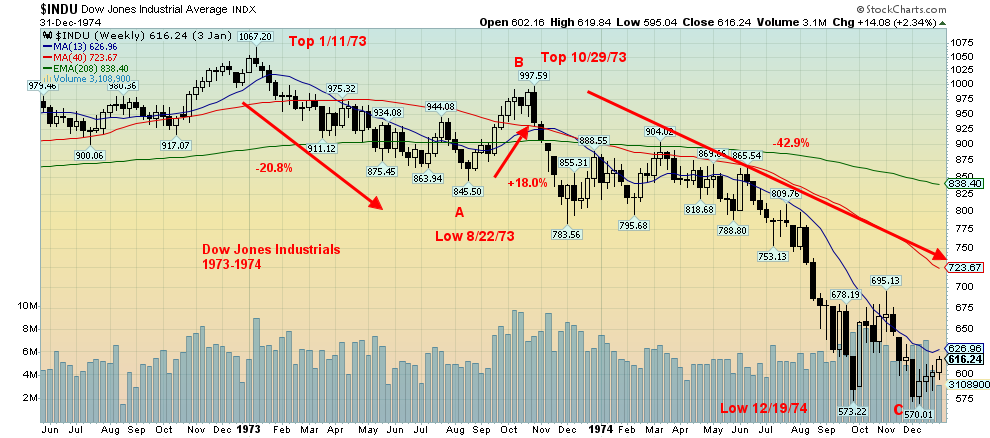
Source: www.stockcharts.com
The Dot.Com Bubble Burst – 2000–2002
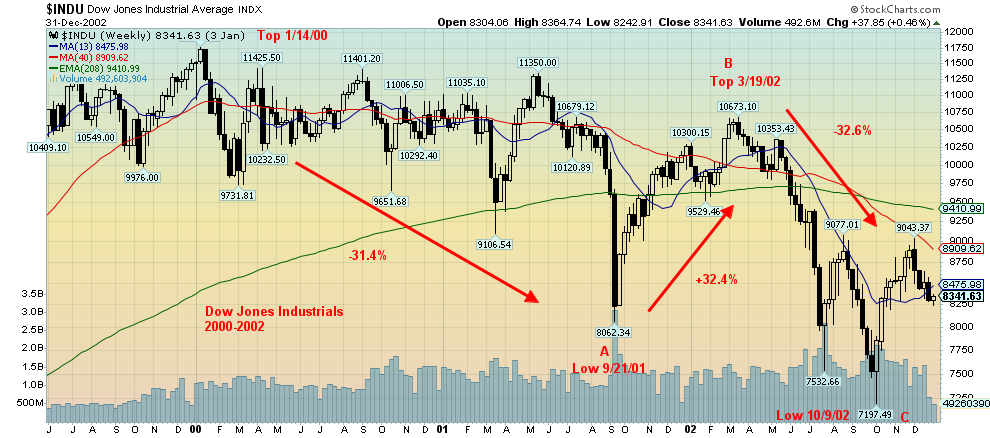
Source: www.stockcharts.com
The Financial Crisis of 2007–2008 Crash – 2007–2009
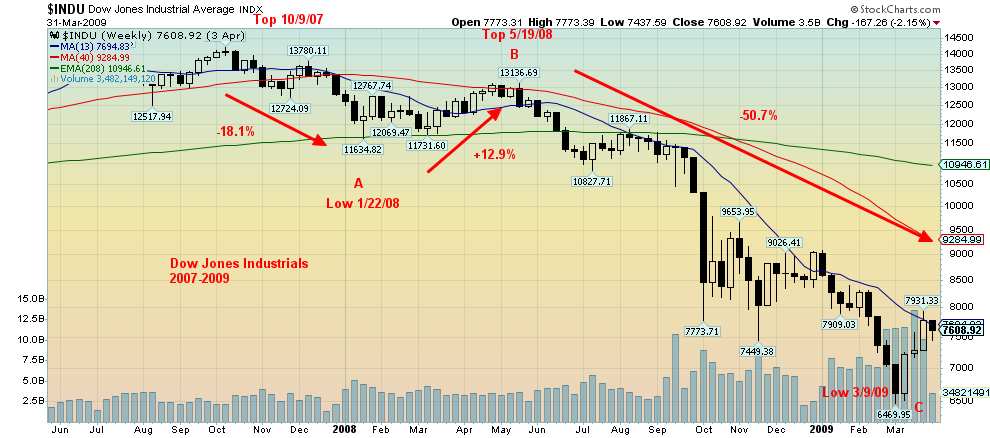
Source: www.stockcharts.com
The Great Reckoning Crash – 2022–?
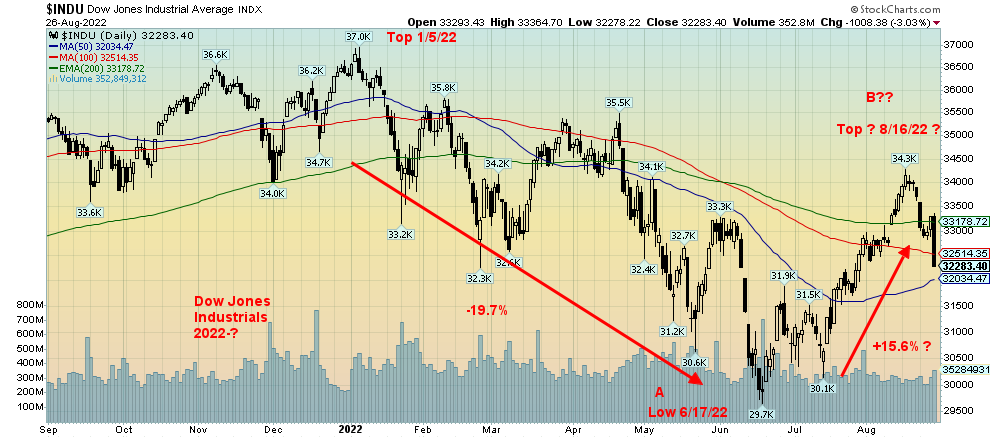
Source: www.stockcharts.com
Tokyo Nikkei Dow (TKN) 1990
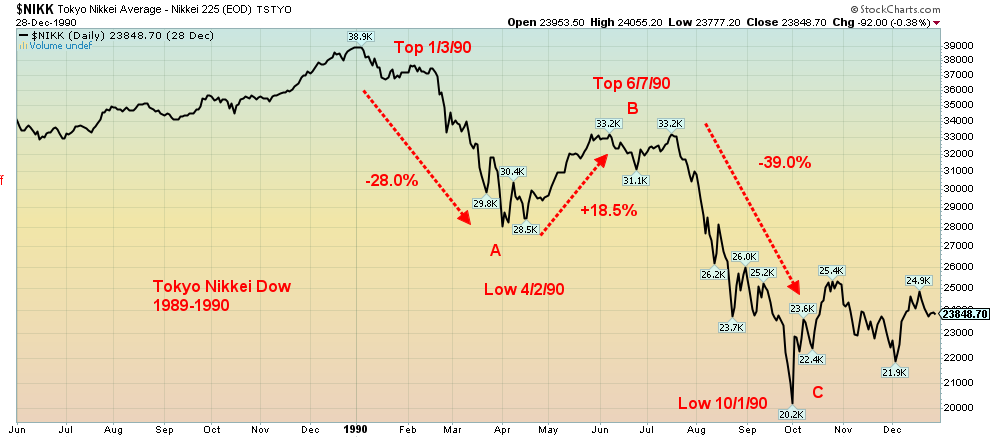
Source: www.stockcharts.com
We wanted to share one more chart to show that bear markets play out the same everywhere. This is the famous Tokyo Nikkei Dow (TKN) crash of 1990. Unsurprisingly, the pattern was similar with an initial drop (A) followed by a good rebound rally (B). Then came the C wave that carried the TKN sharply lower. Even then, the TKN wasn’t finished. A rebound rally got underway out of the low of October 1990 and for the next year or so the TKN managed to rise; however, it never made a good recovery, rising at best 34% off the low. Then a five-wave decline got underway in 1992. When the dust cleared, a bottom was found in August 1992 and the TKN was down 64% from it high of January 1990. The Japanese bubble market of the 1980s was fueled by ultra-low interest rates and lots of liquidity and debt (sound familiar). The classic case of too much money chasing too few goods (stocks, property). The Japanese were also experiencing a housing and property bubble at the same time. Thirty-two years later, the TKN has never recovered the high of January 1990. Since then, the Japanese economy has gone through a long series of feeble growth and recessions while maintaining ultra-low interest rates and oodles of liquidity. They call it the Japanese disease. Could the U.S. catch it too?
Jerome Powell has been very clear. They want to wrestle inflation down. In Powell’s own words: "Restoring price stability will likely require maintaining a restrictive policy stance for some time. The historical record cautions strongly against prematurely loosening policy. …we must keep at it until the job is done. History shows that the employment costs of bringing down inflation are likely to increase with delay, as high inflation becomes more entrenched in wage and price setting."
“Reducing inflation is likely to require a sustained period of below-trend growth. Moreover, there will very likely be some softening of labor market condition. …. they will also bring some pain to households and business.” Fed pivot to an easier stance? Fuhgeddaboudit. Don’t fight the Fed. We live in interesting times.
Markets & Trends
|
|
|
|
% Gains (Losses) Trends
|
|
||||
|
|
Close Dec 31/21 |
Close Aug 26/22 |
Week |
YTD |
Daily (Short Term) |
Weekly (Intermediate) |
Monthly (Long Term) |
|
|
Stock Market Indices |
|
|
|
|
|
|
|
|
|
`S&P 500 |
4,766.18 |
4,057.54 |
(4.0)% |
(14.9)% |
up (weak) |
down (weak) |
up |
|
|
Dow Jones Industrials |
36,333.30 |
32,282.80 |
(4.2)% |
(11.2)% |
neutral |
down (weak) |
up |
|
|
Dow Jones Transports |
16,478.26 |
14,380.23 |
(2.7)% |
(12.7)% |
up (weak) |
down (weak) |
up |
|
|
NASDAQ |
15,644.97 |
12,141.71 |
(4.4)% |
(22.4)% |
neutral |
down (weak) |
neutral |
|
|
S&P/TSX Composite |
21,222.84 |
19,873.29 |
(1.2)% |
(6.4)% |
up |
down |
up |
|
|
S&P/TSX Venture (CDNX) |
939.18 |
645.92 |
(0.6)% |
(31.2)% |
up (weak) |
down |
down (weak) |
|
|
S&P 600 |
1,401.71 |
1,225.51 |
(3.4)% |
(12.6)% |
up (weak) |
down (weak) |
up |
|
|
MSCI World Index |
2,354.17 |
1,943.60 |
(2.3)% |
(17.4)% |
neutral |
down |
neutral |
|
|
NYSE Bitcoin Index |
47,907.71 |
21,296.56 |
(0.6)% |
(55.5)% |
down (weak) |
down |
neutral |
|
|
|
|
|
|
|
|
|
|
|
|
Gold Mining Stock Indices |
|
|
|
|
|
|
|
|
|
Gold Bugs Index (HUI) |
258.87 |
197.50 |
(1.2)% |
(23.7)% |
down |
down |
down |
|
|
TSX Gold Index (TGD) |
292.16 |
233.66 |
(1.1)% |
(20.0)% |
down |
down |
down |
|
|
|
|
|
|
|
|
|
|
|
|
% |
|
|
|
|
|
|
|
|
|
U.S. 10-Year Treasury Bond yield |
1.52% |
3.03% |
1.7% |
99.3% |
|
|
|
|
|
Cdn. 10-Year Bond CGB yield |
1.43% |
3.02% |
2.4% |
111.2% |
|
|
|
|
|
Recession Watch Spreads |
|
|
|
|
|
|
|
|
|
U.S. 2-year 10-year Treasury spread |
0.79% |
(0.35)% |
(22.8)% |
(144.30)% |
|
|
|
|
|
Cdn 2-year 10-year CGB spread |
0.48% |
(0.52)% |
(10.6)% |
(208.3)% |
|
|
|
|
|
|
|
|
|
|
|
|
|
|
|
Currencies |
|
|
|
|
|
|
|
|
|
US$ Index |
95.59 |
108.75 (new highs) |
0.6% |
13.8% |
up |
up |
up |
|
|
Canadian $ |
.7905 |
.7674 |
(0.3)% |
(2.9)% |
down |
down |
neutral |
|
|
Euro |
113.74 |
99.65 |
(0.8)% |
(12.4)% |
down |
down |
down |
|
|
Swiss Franc |
109.77 |
103.51 |
(0.7)% |
(5.7)% |
neutral |
down |
down (weak) |
|
|
British Pound |
135.45 |
117.35 |
(0.8)% |
(13.4)% |
down |
down |
down |
|
|
Japanese Yen |
86.85 |
72.74 |
(0.5)% |
(16.3)% |
down |
down |
down |
|
|
|
|
|
|
|
|
|
|
|
|
|
|
|
|
|
|
|
|
|
|
Precious Metals |
|
|
|
|
|
|
|
|
|
Gold |
1,828.60 |
1,749.80 |
(0.7)% |
(4.3)% |
neutral |
down |
neutral |
|
|
Silver |
23.35 |
18.75 |
(1.7)% |
(19.7)% |
down |
down |
down |
|
|
Platinum |
966.20 |
855.30 |
(3.7)% |
(11.5)% |
down |
down |
down |
|
|
|
|
|
|
|
|
|
|
|
|
Base Metals |
|
|
|
|
|
|
|
|
|
Palladium |
1,912.10 |
2,121.90 |
(0.5)% |
11.0% |
up |
neutral |
neutral |
|
|
Copper |
4.46 |
3.70 |
1.0% |
(17.1)% |
up |
down |
neutral |
|
|
|
|
|
|
|
|
|
|
|
|
Energy |
|
|
|
|
|
|
|
|
|
WTI Oil |
75.21 |
93.06 |
2.9% |
23.7% |
down (weak) |
neutral |
up |
|
|
Nat Gas |
3.73 |
9.27 (new highs) |
(0.8)% |
148.5% |
up |
up |
up |
|
Source: www.stockcharts.com
Note: For an explanation of the trends, see the glossary at the end of this article.
New highs/lows refer to new 52-week highs/lows and, in some cases, all-time highs.
Source: www.stockcharts.com
Don’t fight the Fed. That is the message this week. For a good month or so the market tried to believe that the Fed might pivot to a more neutral stance because of signs of a slowing economy. The last Q2 GDP number showed a 0.6% contraction. Combine that with the 1.6% contraction seen in Q1 and we have the definition of a technical recession: two consecutive quarters of negative growth. Still, as we note, we have no official recession. It’ll probably take until 2023 to officially recognize we have been in one. But for the past month we’ve read a lot bullish articles that the next wave to the upside is underway. Except it made no sense with crashing markets in cryptos, meme stocks, NFTs, and SPACs. Now we are seeing signs that the housing market could come unraveled. Rising interest rates are starting to bite. In Canada the banks are predicting a 24% housing market correction. Banks are increasing their loan loss reserves. There have already been 50% corrections seen in selected places. The Premier of Ontario recently sold his home for 15% under the original asking price at a price even below the next asking price. In the U.S., there are some who believe the coming housing crash will be bigger than in 2008. Not what home owners want to hear.
On Friday at Jackson Hole Jerome Powell seemingly turned into Paul Volcker and gave a rather hawkish speech on why they are not letting up. He freely admitted it might cause a little pain. How about a lot? Stock markets fell, oil fell on fears of lower demand, the US$ soared and gold and the PMs fell. On the week, the S&P 500 fell 4.0%, the Dow Jones Industrials (DJI) 4.2%, the Dow Jones Transportations (DJT) 2.7%, the NASDAQ 4.4%, and the S&P 600 small cap index was off 3.4%. The S&P 400 Mid-Cap fell 3.0%.
For the most part, the story was the same elsewhere. The TSX dropped 1.2%, held up by a decent week from the commodity stocks. The TSX Venture Exchange (CDNX) was actually a star, losing only 0.6%. That is encouraging. The S&P 500 Equal Weight Index dropped 3.6%. The NY FAANG Index was off 2.9%, thanks to strong performances from Baidu and Alibaba who were up 14.4% and 9.4% respectively on the week as Chinese company listings were given a reprieve in terms of delisting on the NYSE. In the EU, the London FTSE lost 2.0%, the Paris CAC 40 was off 3.4%, and the German DAX was down 4.2%. In Asia, China’s Shanghai Index (SSEC) dropped 0.7% and the Tokyo Nikkei Dow (TKN) was down 1.0%. Asia continues to outperform.
Friday’s drop was ugly with the DJI down over 1,000 points. The drop leap-frogged into #13 on the list of the biggest point drops ever for the DJI. The 2,997-point drop of March 16, 2020 remains the granddaddy. The drop, however, didn’t even register for the biggest percentage point drops. October 19, 1987 remains the biggie as that day the DJI fell 22.6%, even as it fell short of the two-day wipeout on October 28 and 29, 1929 when the DJI fell 25.0%.
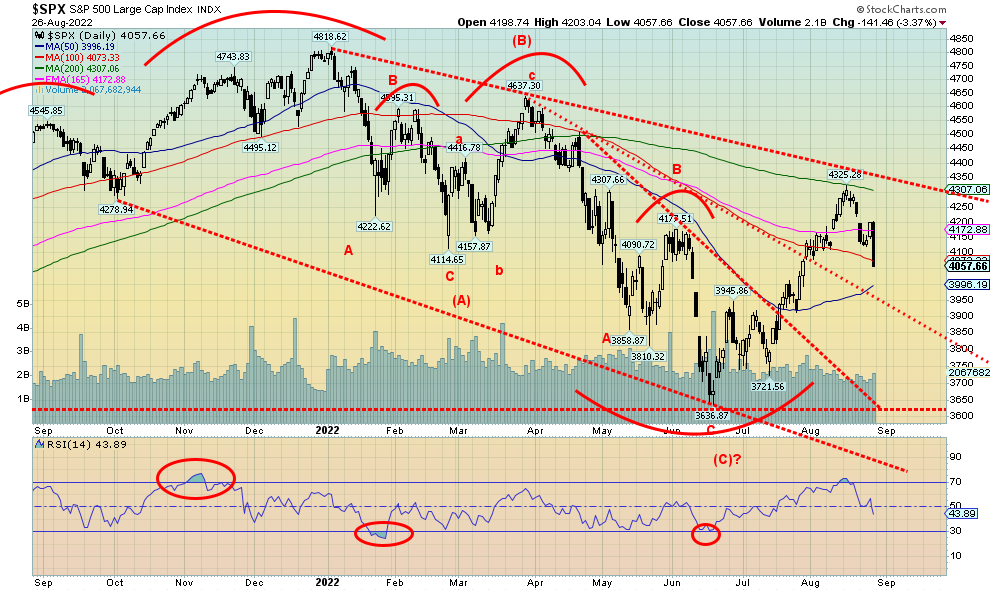
So, is the party over? The bears will be chortling and looking for blood. The bloodied bulls will be looking to regain their stature. The party was short-lived with the S&P 500 rising 19.7% from June 17 to August 16. But it ran smack into the 200-day MA. Looming above was the downtrend line from the January 2022 top. Our expectation was that the markets could falter here and they didn’t disappoint. But is a new bear drop underway? Or is this just a pretender, a teaser? The run from June to August was a bull teaser, in our opinion a sucker’s rally. It was also expected. What our theme of this week is all about, however, is that was only the A and B waves of an ABC pattern. The C wave down is usually the killer.
The decline Friday took us to the 100-day MA. So, we might find support there. Coming up is the rising 50-day MA, currently at just under 4,000. We dropped under 4,080 a point that suggested to us we’ve made at least a temporary top. But our last weekly low was seen in mid-July at 3,721, so we’d need to take out that point to confirm that we are on our way down with wave C. We cannot rule out another attempt to run to the highs or in a remote chance make new highs, but if we were to successfully take out 4,350 and especially above 4,500 then we could challenge the highs. Above that level new highs become possible.
Wave C down could well be underway. But it won’t occur overnight and could easily take us into 2023 before we find a bottom. Markets fell over 20% on the January/June decline. The S&P 500 fell 24.5%, the DJI dropped just a tad short of 20%, and the DJT dropped 30% from its November 2021 high. The NASDAQ fell 34.8% from its November 2021 high, the S&P 600 small cap was down 26.7%, and the S&P 400 mid-cap off 25.3%. The technical definition of a bear market? A drop of 20% or more. We are in a bear market and the bear is not yet finished with us. We’ve merely had a reprieve.
Elation over the June/August rebound rally has been dashed. The next wave of the bear could be underway.
Source: www.stockcharts.com
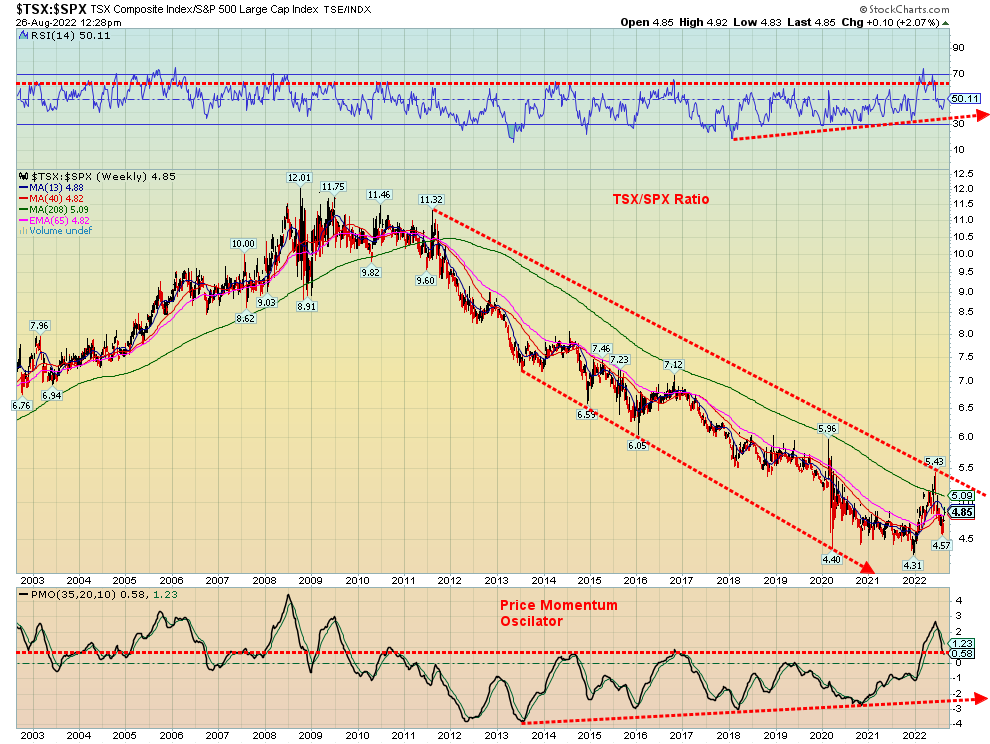
Recently we were referred to a Bloomberg article (available only through a Bloomberg terminal) by Stefanie Marotta, outlining how Canadian stocks based on at least one valuation method shows that the TSX Composite stocks are trading at or near historically low estimated earnings for the next 12 months. The S&P 500 stocks are according to the article have PE’s some 40% higher despite the recent sell-offs. What that appears to be telling us is that the TSX stock are relatively cheap by comparison. Our chart above of the S&P 500/TSX ratio seems to confirm that. Since peaking in 2008–2011, the ratio has embarked on long 11-year downtrend favouring the S&P 500 over the TSX Composite. What we see are signs that that could be coming to an end. https://www.bloomberg.com/news/articles/2022-08-23/top-toronto-fund-manager-sours-on-us-stocks-as-recession-looms?sref=5lk0w2FC
We have our usual RSI indicator above and have added a price momentum oscillator below. What we notice is that in both cases the RSI and the price oscillator broke out to new highs while the TSX/SPX ratio did not make new highs. As well, since 2013 on the price oscillator and since 2018 on the RSI we have series of rising lows while on the ratio we are making successive new lows. This is a major divergence and should be resolved only by a breakout to the upside by the TSX/SPX ratio favouring TSX stocks over S&P 500 stocks. The potential, we
believe, is in the commodity stocks that dominate the TSX as outside of energy stocks the commodity stocks remain cheap in golds, metals, and materials. So, what was up this past week on the TSX? Metals & Mining +2.8%, Materials +3.0%, while the Golds sub-index was held to a small loss of 1.1% vs. a drop in the S&P 500 by 4.0%. The recent pullback for the commodities and the commodity stocks may find some footing here and regain their stature. The potential is there to confirm the article that Canadian stocks are cheap relative to the U.S. stocks.
Source: www.stockcharts.com
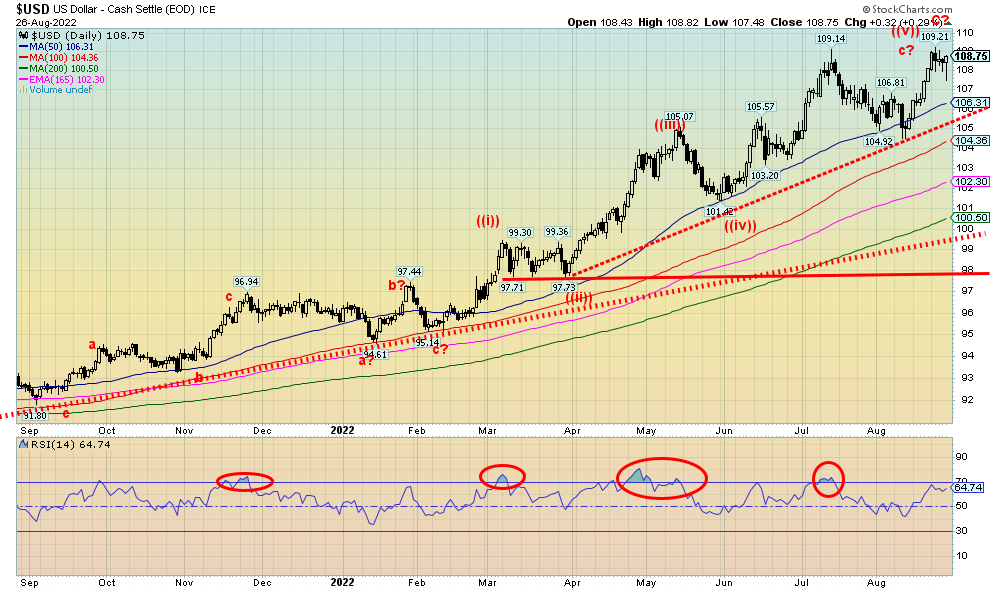
The US$ Index fell from a high in July 2022 to a low in August 2022 but never broke our key support at 105. It was then onward and upward once again. This past week the US$ Index made fresh 52-week highs at 109.21 (just barely above July’s 109.14) before settling off at 108.75. Friday’s hawkish statements by the Fed helped propel the US$ Index from a down day to an up day. The result is that new highs remain possible again this coming week.
The US$ Index gained 0.6% on the week. Everyone else was a loser. The euro fell under par to 99.65, losing 0.85. The Swiss franc was off 0.7% and the pound sterling dropped 0.8%. The pound is potentially in more trouble with a looming energy crisis. The Japanese yen fell 0.5% while the Canadian dollar dropped 0.3%. The Canadian dollar continues to be the best of the other currencies. Sentiment towards the euro and pound in particular is quite low. But negative sentiment can hang around longer than the bulls can remain solvent.
The US$ Index appears destined to continue to respond positively to the Fed’s aggressive stance on interest rates. As long as that stays in place, the US$ could continue to benefit. Uncertainty in the EU, as well as uncertainty in China and even Japan has seen capital flee those countries to the U.S. dollar. The U.S. dollar is the world’s reserve currency and while China, Russia, and the BRICS are trying to establish a new monetary order it is not in place yet. They are prepared to challenge global US$ hegemony and dominance. Hence, why we believe the current tensions between the U.S./China/Russia are not about Ukraine and Taiwan but about US$ dominance and the U.S.’s dominance of global institutions such as the World Bank and the IMF.
Source: www.stockcharts.com
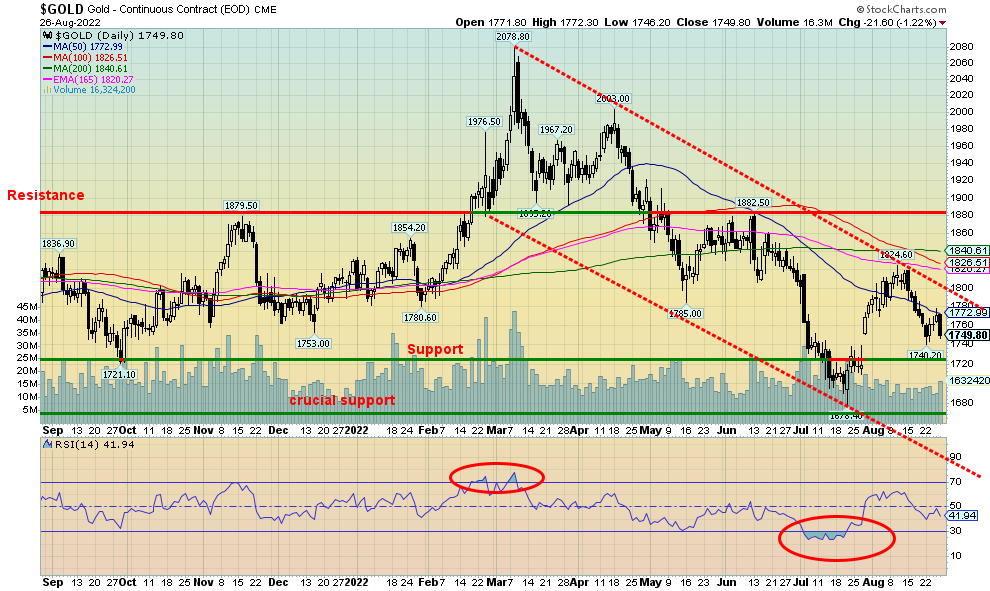
Everybody hates gold. Or so it seems. For the precious metals (PMs) (gold, silver, platinum and even palladium and copper), all with the exception of copper closed lower this past week. With the Fed’s aggressive stance on interest rates the US$ Index soared and the PMs sunk. Gold was down 0.7%, silver off 1.7%, platinum down 3.7%, and palladium losing 0.5%. Copper bucked the trend, rising about 1.0%. The PM stocks also fell with the Gold Bugs Index (HUI) losing 1.2% and the TSX Gold Index (TGD) off 1.1%.
Silver falling below $19 was not a good sign. Looming now is the July low of $18.01. We also traded briefly under $18.70, a point that could suggest new lows ahead. Break that and we could fall to $15. But we could also set up a potential double bottom. Gold is hanging in, but a break under $1,740 could send gold down to our breakdown point at $1,710. Below that new lows below $1,673/$1,675 are possible. Targets could then be down to around $1,500.
However, sentiment is practically at rock bottom. For the gold miners, the Gold Miners Bullish Percent Index (BPGDM) is at 10.34, as low it has been since March 2020. The commercial COT for both gold and silver improved this week with the commercial COT (bullion companies and banks) for gold up to 32% from 31% as the commercials added almost 4,000 longs while cutting their shorts by roughly 12,000 contracts. Silver did even better, rising to 48%, up from 45% as commercial longs rose almost 4,000 contracts and commercial shorts fell by almost 5,000 contracts. Predictably, the large speculators COT (hedge funds, managed futures, etc.) fell with the gold speculator COT down to 68% from 71% and the silver large speculator COT down to 48% from 52%.
Our stance on the PMs at this point is at least mildly bullish. We are in a potential seasonal sweet spot that usually sees the PMs rise. However, the peak could come as soon as October. The key will be, can gold get past $1,900? Right now, we need to break out over $1,820 to suggest that we could rise towards $1,900. Getting through $1,900 would be even more important. Failure at or near $1,900 could send gold tumbling once again. While $1,900 is important, only above $2,000 could we say new highs are possible.
We constantly remind ourselves that we have some negative cycles that are unresolved. We have often noted the 7.83-year cycle (last seen in December 2015, range 86–102 months) and the 23.5-year cycle (last seen April 2001, range 19.5 to 27.5 years). Merriman (www.mmacycles.com) pinpoints the potential lows to be made somewhere between February 2023 to June 2024. The next 31-month cycle may be clue to when the 7.83-year and 23.5-year cycles make their low. The last one was seen with a double bottom in March 2021 at $1,673 and again in August 2021 at $1,675. The next 31-month cycle low is due anywhere from now until March 2023. Note the potential overlap with the longer cycles.
It is tempting to note that another low was seen in July 2022 at $1,678. A triple bottom? Triple bottoms (and tops) are rare, so we are not placing too much emphasis on the low being significant. Significant in the short term but not necessarily in the longer term. We have vivid memories of the potential looking double bottom of 2012 only to see gold break out in late 2012 (a head fake as it turned out never confirmed by silver) and then crash through $1,500 in April 2013, eventually bottoming at $1,045 in December 2015.
Our view for gold is thus short-term bullish, intermediate term bearish, and long-term bullish. We can get anxious awaiting these cycle lows, but patience is required. The fundamentals for gold (and silver) are strong. A shift that causes the US$ Index to start falling is not there yet. In the interim, all we have to go on is that if we break under $1,675, we could fall sharply. If we break above $2,000, new highs are very likely. Right now, we are closer to the former than the latter. The risk remains to the downside. But if the markets decide to turn up, gold could lead the way as it did in March 2020.
Source: www.stockcharts.com
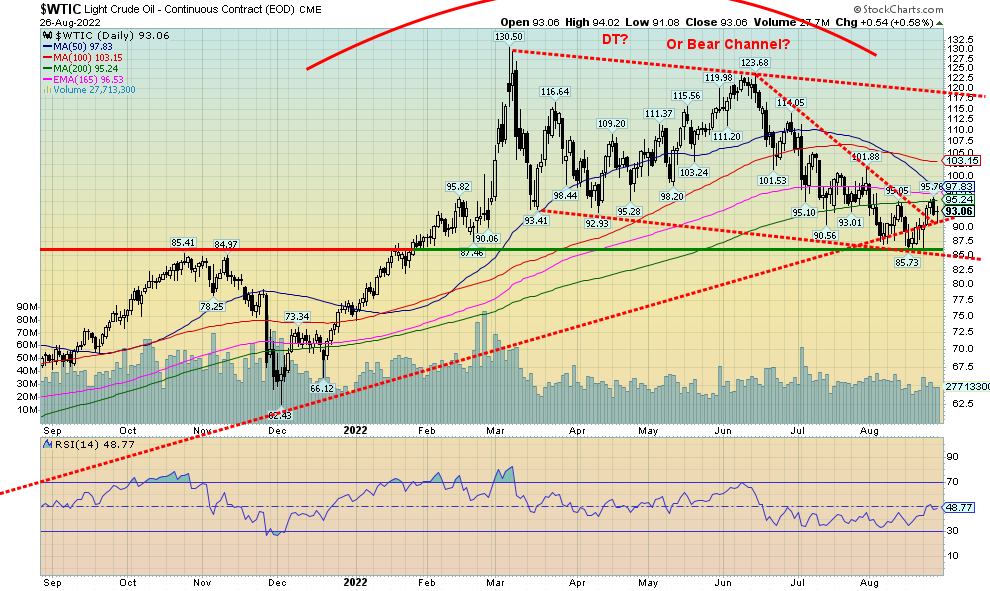
So, what is going to drive oil prices? The Fed’s words from Jackson Hole that there will be pain? Or the failure to come to a nuclear deal with Iran? Both seemed to drive oil prices this past week. Oil prices rose through the early part of the week on word that any Iranian nuclear deal could fall apart. Seems the U.S. won’t even become involved directly in talks, going instead through the Europeans. But what was on offer for Iran did not fit with the Tehran leadership. It could now be down to take it or leave it. Odds favour the latter. And that spells continued problems for oil prices as Iran continues its quest for a nuclear bomb. The fear is that Israel in particular could attack Iran’s nuclear facilities, thus potentially sparking a crisis in the Middle East. A third of the world’s oil goes through the Straits of Hormuz and Saudi Arabia and Iran are ranked #2 and #7 in global production. Iran ranks high despite years of sanctions. Furthermore, Saudi Arabia is ranked #2 in oil reserves and Iran #4. Add in Iraq, Qatar and others in the Gulf and you have Mid-East oil powerhouses.
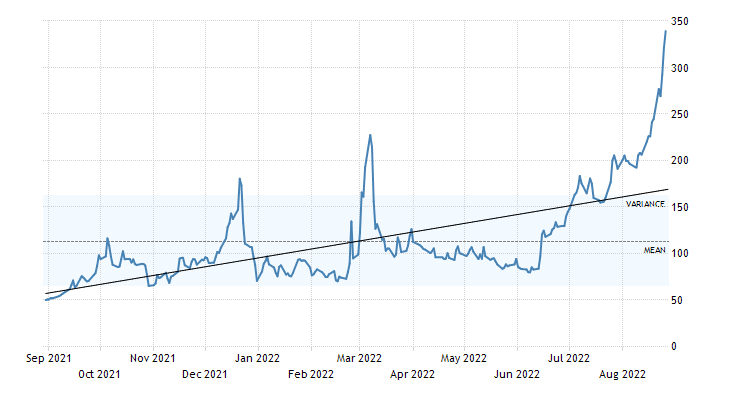
But by week’s end the Fed’s words won out and oil prices sank on fears of demand destruction. Still, by week’s end WTI oil rose 2.9%. Natural gas (NG) continued its upward march as Russia once again cuts back on supplies to the EU. Gazprom says that turbines needed to run the Nord Stream pipeline have not arrived. We presume those are the expected turbines from Canada that are caught up in a political storm. Supplies are not coming through the two Caspian Sea pipelines as mooring points on the Black Sea have been damaged. Worse, severe drought conditions have left the Rhine River too shallow to transport supplies, which also threatens energy shipments and limits both nuclear and hydroelectric power production. And the EU cannot source enough replacement. In the UK, households face potential bills that could rise 80% this coming winter. Many may not
be able to afford it, creating a potential major energy crisis in the UK. NG hit 52-week highs before pulling back and closing off a small 0.8%. EU Dutch Hub NG soared to record highs up 38.6% on the week, hitting briefly over €340 per megawatt hour, up from €245 the previous week.
EU Natural Gas Dutch Hub (€)
Source: www.tradingeconomics.com
So, who will win out? Fears of Iran or fears of an economic slowdown sparked by an aggressive Fed? Technically, our argument that we may have made a double top is weakening. It’s a failure to break down, particularly under $85 that would set the stage for a potential decline to $75 and lower. When prices broke under $90 there was no swift decline and support was found above $85. Instead, we may be forming a gentle sloping bear channel. We have broken the recent downtrend. But WTI ran into the 200-day MA this week before turning down once again on the Fed’s stance. Only above $105 do we stand a chance of moving higher. Above $114 WTI would confirm its upward move and above $120 new highs are possible. We will continue to monitor $85 as the breakdown point to lower prices.
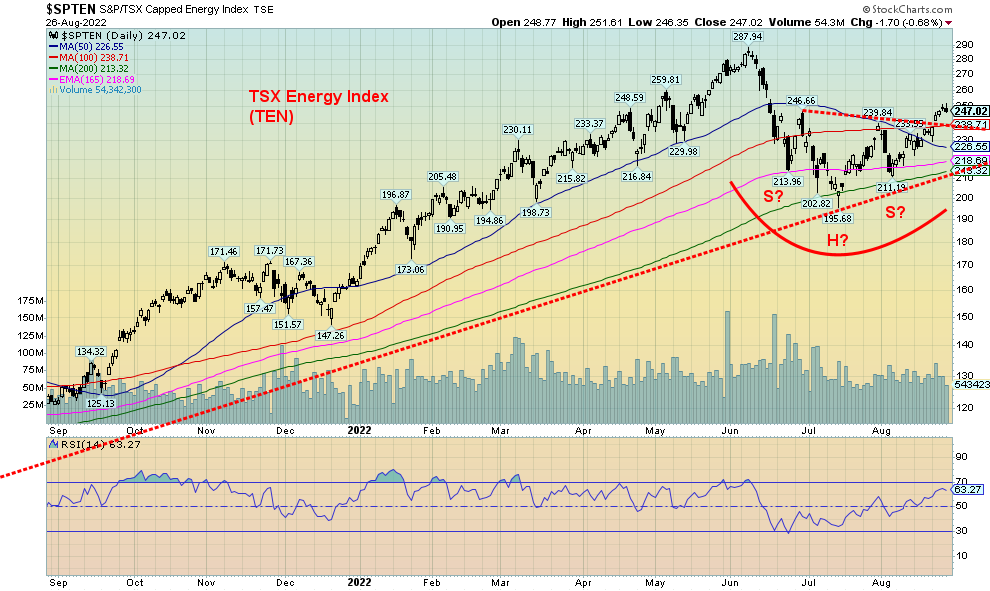
Oil and gas stocks responded positively to this past week’s rise in price but predictably fell on the Fed’s speech. Still, the ARCA Oil & Gas Index (XOI) closed up 4.5% and the TSX Energy Index (TEN) gained 5.0%. The TEN in particular is breaking out of a possible head and shoulders bottom pattern that could target up to 285 and even new highs.
Source: www.stockcharts.com
Copyright David Chapman, 2022
|
GLOSSARY Trends Daily – Short-term trend (For swing traders) Weekly – Intermediate-term trend (For long-term trend followers) Monthly – Long-term secular trend (For long-term trend followers) Up – The trend is up. Down – The trend is down Neutral – Indicators are mostly neutral. A trend change might be in the offing. Weak – The trend is still up or down but it is weakening. It is also a sign that the trend might change. Topping – Indicators are suggesting that while the trend remains up there are considerable signs that suggest that the market is topping. Bottoming – Indicators are suggesting that while the trend is down there are considerable signs that suggest that the market is bottoming. |
Disclaimer
David Chapman is not a registered advisory service and is not an exempt market dealer (EMD) nor a licensed financial advisor. He does not and cannot give individualised market advice. David Chapman has worked in the financial industry for over 40 years including large financial corporations, banks, and investment dealers. The information in this newsletter is intended only for informational and educational purposes. It should not be construed as an offer, a solicitation of an offer or sale of any security. Every effort is made to provide accurate and complete information. However, we cannot guarantee that there will be no errors. We make no claims, promises or guarantees about the accuracy, completeness, or adequacy of the contents of this commentary and expressly disclaim liability for errors and omissions in the contents of this commentary. David Chapman will always use his best efforts to ensure the accuracy and timeliness of all information. The reader assumes all risk when trading in securities and David Chapman advises consulting a licensed professional financial advisor or portfolio manager such as Enriched Investing Incorporated before proceeding with any trade or idea presented in this newsletter. David Chapman may own shares in companies mentioned in this newsletter. Before making an investment, prospective investors should review each security’s offering documents which summarize the objectives, fees, expenses and associated risks. David Chapman shares his ideas and opinions for informational and educational purposes only and expects the reader to perform due diligence before considering a position in any security. That includes consulting with your own licensed professional financial advisor such as Enriched Investing Incorporated. Performance is not guaranteed, values change frequently, and past performance may not be repeated.
About the author


Website: https://www.enrichedinvesting.com
Disclaimer: David Chapman is not a registered advisory service and is not an exempt market dealer (EMD) nor a licensed financial advisor. We do not and cannot give individualised market advice. David Chapman has worked in the financial industry for over 40 years including large financial corporations, banks, and investment dealers. The information in this newsletter is intended only for informational and educational purposes. It should not be considered a solicitation of an offer or sale of any security. The reader assumes all risk when trading in securities and David Chapman advises consulting a licensed professional financial advisor before proceeding with any trade or idea presented in this newsletter. David Chapman may own shares in companies mentioned in this newsletter. We share our ideas and opinions for informational and educational purposes only and expect the reader to perform due diligence before considering a position in any security. That includes consulting with your own licensed professional financial advisor.