
“Invest in inflation. It’s the only thing going up.”
—Will Rogers, American vaudeville performer, actor, humourist, social commentator, a citizen of Cherokee Nation, starred in films from the silent era to the “talkies”; 1879–1935
“Inflation is the senility of democracies.”
—Sylvia Townsend Warner, English novelist, poet, musicologist, known for Lolly Willowes, The Corner That Held Them (1948); 1893–1978
“Inflation is taxation without legislation.”
—Milton Freidman, American economist and statistician, Nobel Prize in Economic Sciences 1976, known as the intellectual leader of the Chicago School of Economics at The University of Chicago; 1912–2006
$80 trillion. That’s how much the Bank for International Settlements (BIS) (www.bis.org) says is potentially at risk because of FX swaps, forwards, and currency swaps that do not appear on balance sheets nor are accounted for in debt statistics. To put that $80 trillion in perspective, the global economy is estimated at about $100 trillion. Global stock markets are at about $90 trillion, but global debt is estimated at over $300 trillion. And that doesn’t include the $80 trillion noted. There is also an estimated one quadrillion notional value (some say $2.3 quadrillion) of derivatives globally, but the actual risk is only about $12–$15 trillion. Such is the nature of derivatives where the notional principal is not at risk. What’s at risk is the cash flow. Still, that’s a lot. Remember, being at risk and failing are two different things. Just because it is at risk does not mean it will fail.
So, what is the BIS? The BIS is known as the central bank of central banks. It is owned by the central banks of the world which include both the Fed, the BofC, BOE, ECB, BOJ, and PBOC. Its prime mission as stated is to support central banks' pursuit of monetary and financial stability through international cooperation, and to act as a bank for central banks. The BIS maintains huge data bases on numerous monetary and banking statistics and is renowned for its research department.
The major concern here is that, embedded in the foreign exchange (FX) markets are huge, unseen dollar borrowings. Numerous foreign entities borrow U.S. dollars because the U.S. dollar market is the deepest and most liquid market in the world. So, who borrows? Sovereigns, international corporations, insurance companies, pension funds. The largest borrowers by country are Japan, China, the U.K., Switzerland, and the Cayman Islands. But numerous other countries and entities borrow, particularly Emerging Market Economies (EMEs).
So why do they borrow in U.S. dollars and then trade in FX currency swaps? As stated, the U.S. dollar market is the deepest and most liquid in the world. But their need is not U.S. dollars. What they need is the home currency, whether that be yen, yuan, sterling, Swiss francs, or Canadian dollars. But it also could be used to
convert to Turkish lira, Brazilian reals, or even Russian rubles. These FX swaps or currency swaps are like a repurchase agreement (repo), except it is the currency rather than securities. But where this goes awry is that
the payments are all recorded off-balance sheet rather than on the balance sheet. The $80 trillion is an estimate.
Pension funds engage in these kinds of operations, including some of Canada’s largest pension funds such as the Canada Pension Fund, Teachers, and OMERS. Why do pension funds engage in what is a leveraged activity? Interest rates have been for years very low, so a prime reason is to enhance returns, and give them portfolio flexibility. Derivatives also act as a hedge. Pension funds, along with other financial institutions and non-bank financial institutions, face numerous risks including interest rate risk, market risk, FX risk, credit risk, etc.
As a result, pension funds and others engage in the use of numerous derivatives besides FX swaps but including interest rate swaps, forward rate agreements (FRAs), futures, options, credit default swaps (CDS), collateralized debt obligations (CDO), mortgage-backed securities (MBS), equity swaps, and more. While some are exchange-traded such as futures and options, most are traded in the over-the-counter (OTC) market. These instruments are traded alike between financial and non-financial institutions. Financial institutions make up the bulk of the market. Non-bank institutions may have up to $35 trillion of obligations.
When engaging in asset/liability management, mismatches in terms of term and currency are not unusual. Swaps/forwards and currency swaps are mostly short-term vs. long-term borrowings, and the value exceeds all the treasury bills, repos, and commercial paper outstanding combined. Volume in trading exceeds $5 trillion/day.
So, what could go wrong? A major large party could default. That could leave holes in many portfolios. What could then follow is a liquidity crisis. This is what happened during the financial crisis of 2008 after Lehman Brothers collapsed and it came to light that the giant insurer AIG was going to blow up as a result of calls on its CDSs. The COVID crash of March 2020 also created chaos as borrowers couldn’t borrow, or at least were forced to pay exorbitant rates. So, what happened was the central banks came riding to the rescue, supplying the financial system with liquidity. A global financial collapse was averted.
Recent events such as the collapse of the crypto king FTX and Sam Bankman-Fried highlight the vulnerabilities in the markets. Contagion spread to other crypto players and the once $2.3 trillion dollar market is now worth only about $850 billion. In 2022 we’ve also had a Russian financial crisis when Russia was forced into an artificial default as a result of the war in Ukraine. There was also the U.K. financial crisis that resulted in the removal of the short-lived prime minister Liz Truss. The BOE was in the process of tightening the financial system by raising interest rates and conducting quantitative tightening (QT) operations as a result of high inflation in excess of 11%. The financial crisis created by the Truss government sparked a liquidity crisis resulting in the BOE having to enter the market to buy up gilts and help bail out pension funds that were threatened. The exact opposite of what they had been doing.
Hedge funds are facing withdrawals, and some are now being forced to either limit withdrawals or stop withdrawals altogether. Most recently, the world’s largest institutional asset manager, Blackrock, with some $10 trillion under management has been forced to limit withdrawals and is facing revolts and challenges to its CEO Larry Fink to resign. Ironically, Blackrock has been warning of a coming dangerous recession and that central banks won’t be able to ride to the rescue this time. That is today’s reality.
Just how much is at risk? The BIS calls it missing dollar (U.S.) debt because regular statistics don’t appear to be accounting for it. For non-banks outside the U.S., it is estimated at $26 trillion. For banks outside the U.S., it is estimated at $39 trillion. Payment obligations from FX swaps/forwards and currency swaps are estimated at a staggering $97 trillion. Global GDP is $96 trillion. The U.S. dollar dominates. As the BIS notes in its article, if someone want to do an FX swap from Swiss francs to Polish zlotys, they first do an FX swap to U.S. dollars, then swap the dollars for zlotys—two separate transactions. To start with, they may have borrowed in Swiss francs and then loaned out in zlotys. Ah, the mysteries of international finance.
Our chart below from the BIS shows the massive growth in FX swaps dominated by U.S. dollars, as well as by maturity and by key players. Yes, those are trillions.
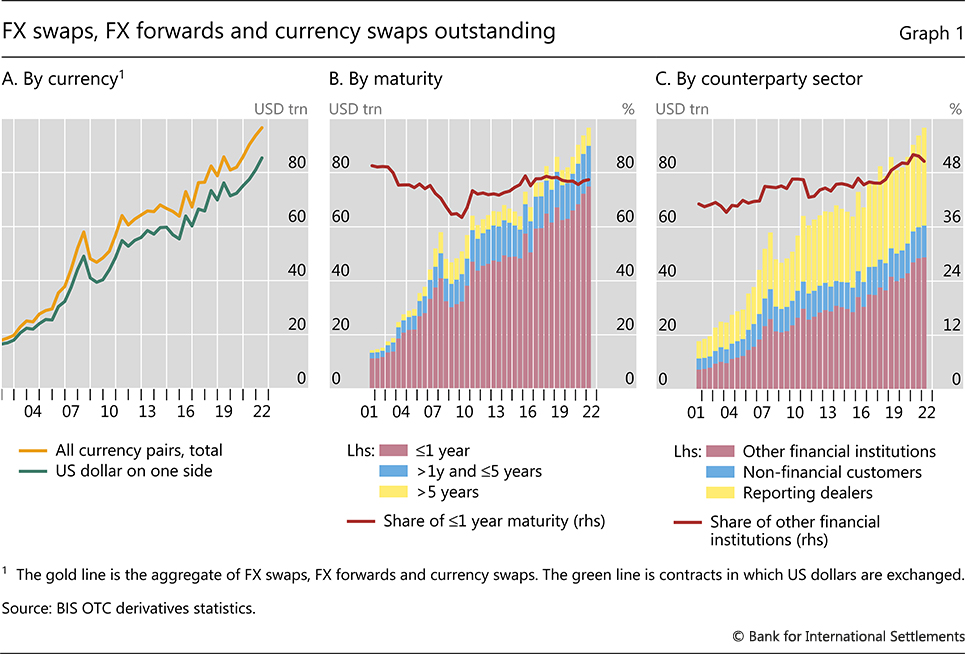
Source: www.bis.org
Remember that a lot of this has been lent long and is being funded short. That creates the potential for a liquidity squeeze if something goes awry. Apparently, some 70% of FX swap turnover is rolled over every week and overnight 30%. That’s staggering. As a former money market dealer in U.S. dollars and other currencies who was also involved in FX swaps and interest rate swaps plus futures, options, and FRAs, we can fully appreciate the chaos on a not-so-good morning when finding overnight funds or short one-week funds to cover obligations was difficult. One situation we experienced was on October 19–20, 1987 when everything suddenly seemed to dry up. Even back then the Fed rode to the rescue. Will they, or can they now? That’s questionable.
The BIS goes on to describe missing dollar debt that is mostly outside the U.S. How large is that? At the end of June 2022, dealer-banks held $52 trillion in outstanding dollar positions. Non-bank held $26 trillion. We are showing the second chart from the BIS that shows the amount of on-balance sheet debt of non-banks outside the U.S., coupled with on-and-off balance sheet debt. The differences are huge as off-balance sheet dwarfs balance sheet debt.
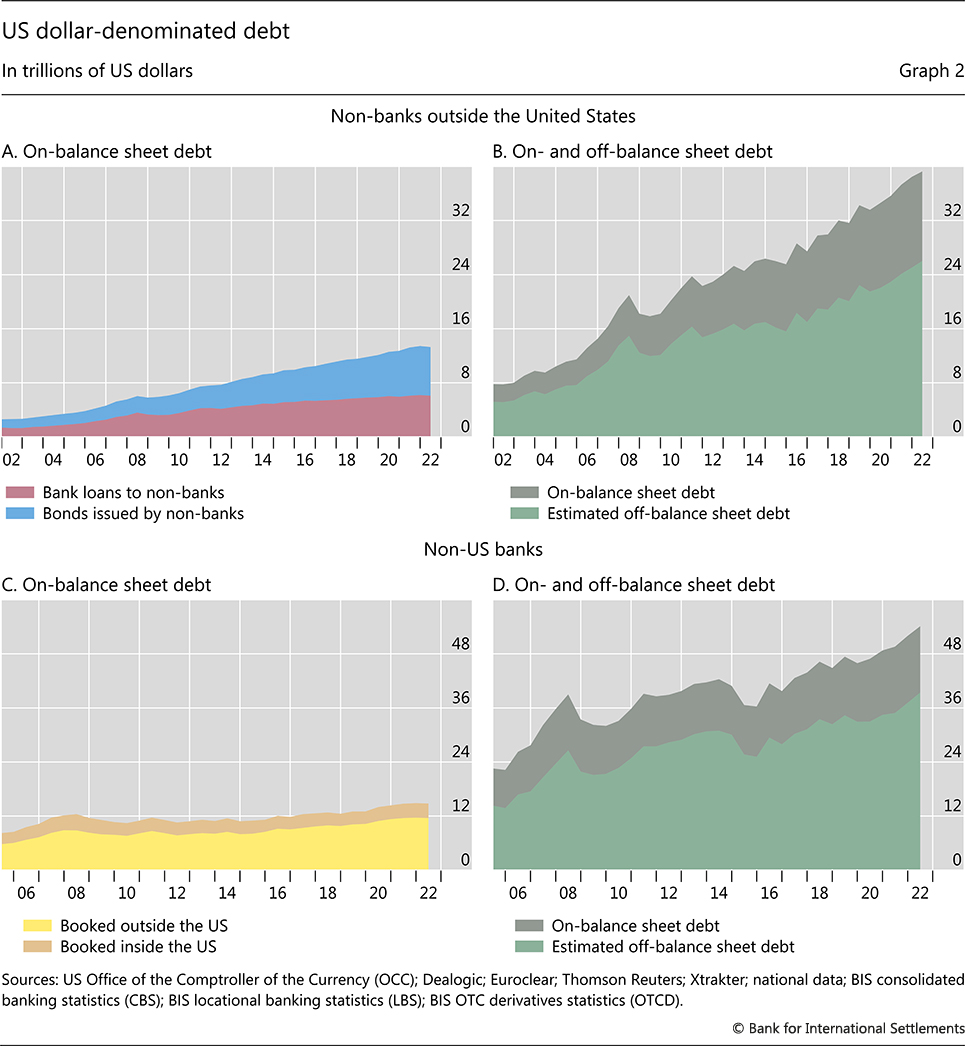
Source: www.bis.org
The BIS article, which can be found at www.bis.org/publ/qtrpdf/r_qt2212h.htm, highlights a potential black hole that could become a black swan event if something goes missing. The article was highlighted at Bloomberg (www.bloomberg.com) and Reuters (www.reuters.com) along with GATA (www.gata.org), an organization whose aim is to investigate, expose, and oppose price collusion in the price of gold and related financial instruments. Our aim is to add to the story, a story worth noting.
We have also noted that the BIS has added to its gold swaps recently. That shouldn’t be unusual as the BIS has been an active trader of gold swaps for years. The BIS holds 102 metric tonnes of gold. The BIS had seemingly run down its gold swaps and by October reported its lowest level in years, down to only 7 tonnes. Then by the end of November they were up to 105 tonnes, the highest level in months. That also coincided with a rise in the price of gold. Most of the BIS’s gold swap transactions are with commercial bullion banks (BNP Paribas, Citibank, Credit Suisse, Goldman Sachs, HSBC, ICBC Standard Bank, JP Morgan Chase, Merrill Lynch, Morgan Stanley, TD Bank, UBS, Standard Chartered Bank). Could the BIS’s activity in the gold swap market and the rise in the price of gold be connected?
We can only guess at the reason for the sudden jump in gold swaps while at the same time noting the article provided by the BIS on the international FX swap market. Is something amiss? Martin Armstrong, the gadfly that runs Armstrong Economics (www.armstrongeconomics.com) has noted that if one thinks 2022 was bad, wait until 2023. It’s going to be worse.
The rest of this page is blank
Chart of the Week
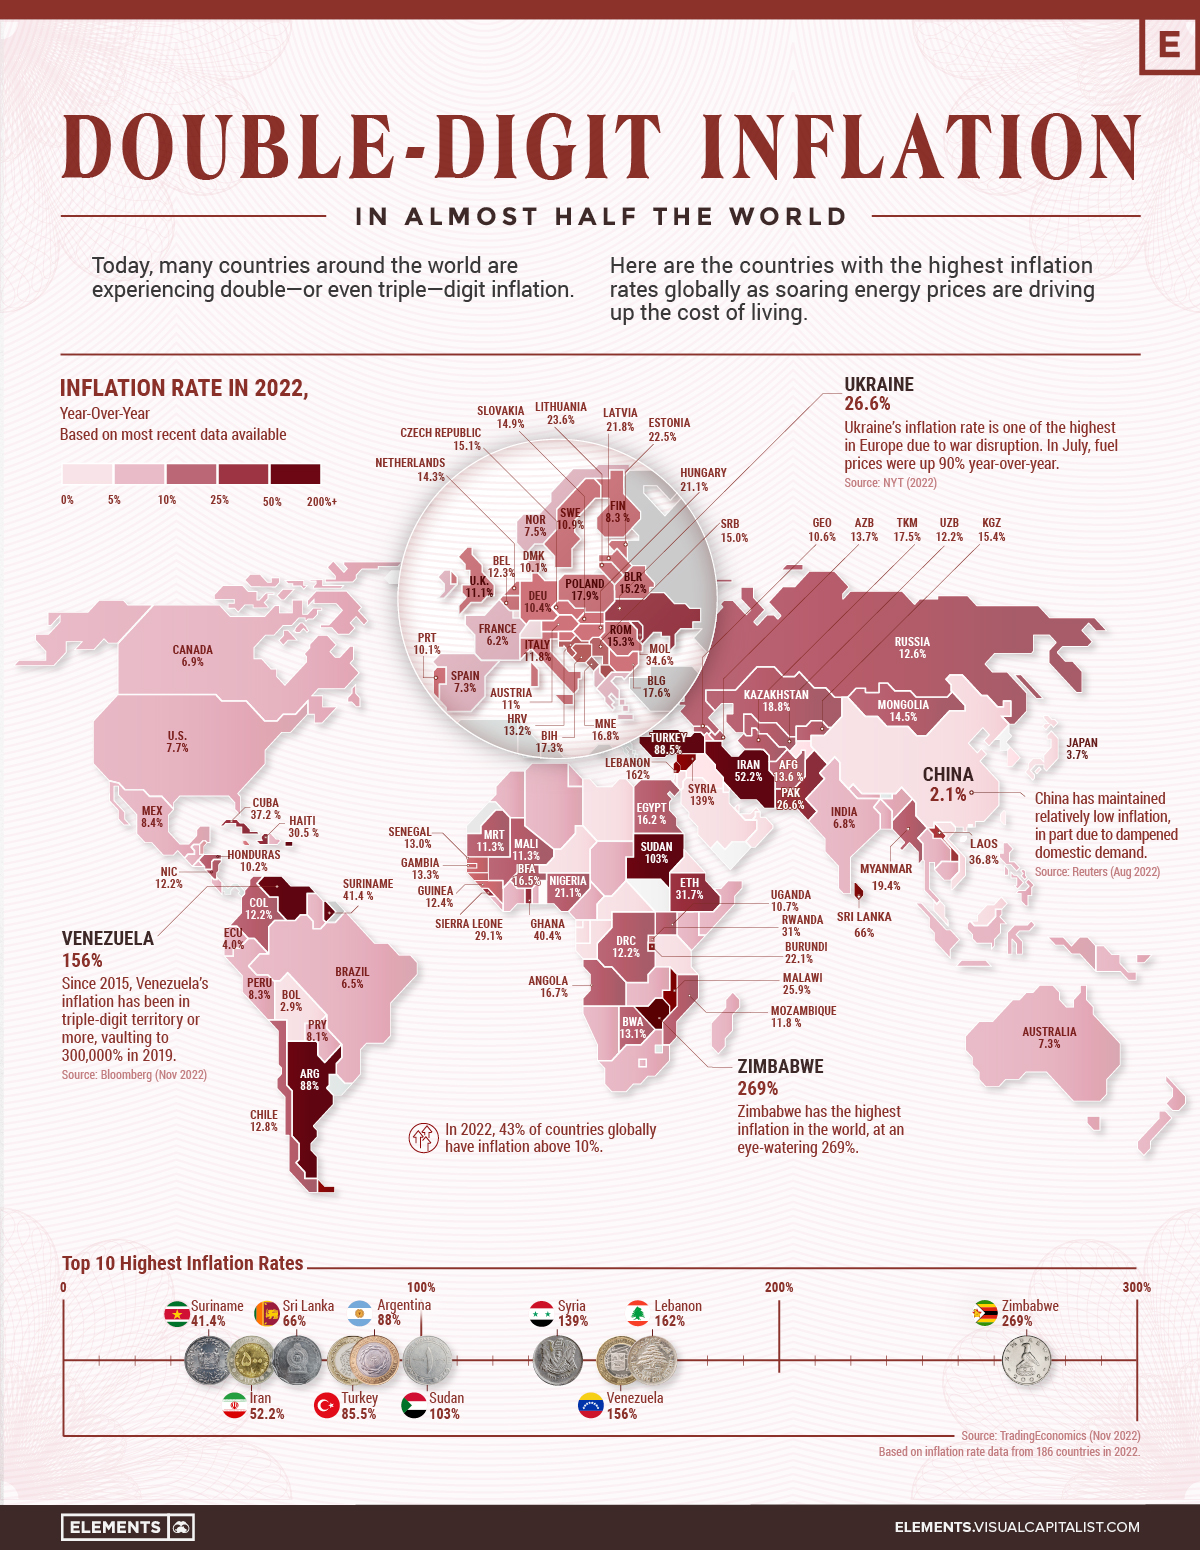
Source: www.visualcapitalist.com
Inflation is not just a Western phenomenon. We’d really have something to complain about with inflation if we lived in Argentina (88%), Turkey (88.5%), or Venezuela (156%). While, yes, inflation is a monetary phenomenon, Western inflation has been battered by supply-disruptions from the pandemic recession, the war in Ukraine triggering higher energy costs, and even climate change, which has caused numerous droughts around the world. Serious droughts have been experienced in the Canadian prairies, northern Ontario, in the U.S. south-west and California, in Africa, north and central, in southern South America, in Asia, especially China, and even in Europe. Droughts have put millions at risk of starvation, as well as displacing millions, especially in Africa. Droughts are also battering wild life as thousands of animals have died particularly in Africa and a million species are at risk as eco-systems collapse. In the southern U.S. reservoir, river and lake levels have fallen so drastically that millions are at risk of having no water. Food prices have naturally soared.
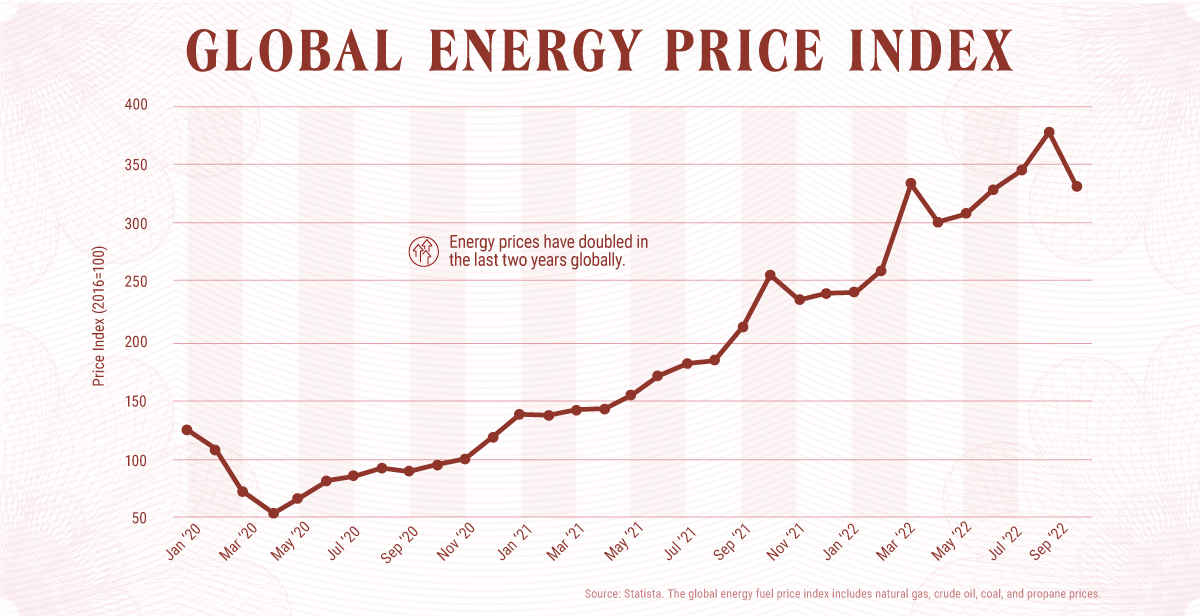
Source: www.visualcapitalist.com
This is how energy prices have more than doubled in the past two years. In the EU, natural gas prices are up 2,500% since the pandemic got underway in March 2020. As we know, money supply and quantitative easing (QE) injections into the economy have also played a role. The massive growth in money supply plus QE set off the leap in the stock prices. Inflation manifests itself in more ways than one.
Now with QT, along with hiked interest rates and governments pulling back on fiscal spending, the risk is now the other way as prices fall—at least for the stock market and housing, two areas that benefitted considerably from the round of money printing. Interest rates are still too low, below the rate of inflation. In 1980 it took hiking interest rates above the rate of inflation to spark the economic downturn of the early 1980s, which resulted in a sharp contraction and rising unemployment. On that note, we are not there yet.
Inflation in the G7 countries is as follows: Canada 6.9%, U.S. 7.7%, U.K. 11.1%, Germany 10.4%, France 6.2%, Italy 11.8%, and Japan 3.7%. By those measures, Canada isn’t doing too badly. Japan’s has stayed low and, unlike the others, Japan has not been hiking interest rates—which on the other side sparked a huge sell-off in the Japanese yen.
Canada, as expected, did hike its key bank rate 50 bp to 4.25%. But with inflation at 6.9% it remains below that level. The picture is much the same in the U.S. as the Fed rate is currently at 3.75%–4.00% vs. inflation 7.7%.
Canada Bank Rate vs. Inflation 1997–2022
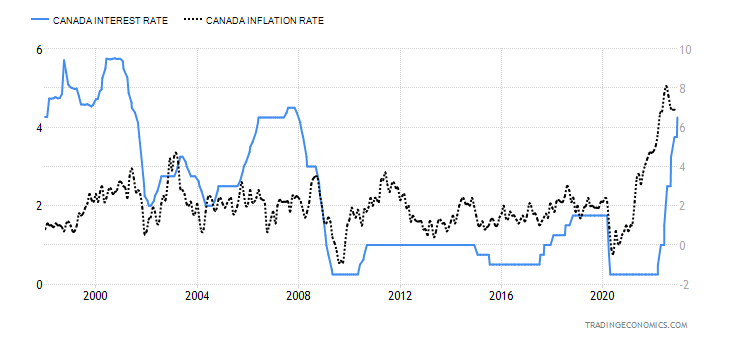
Source: www.tradingeconomics.com, www.bankofcanada.ca. www.statcan.gc.ca
Fed Rate vs. Inflation 1970–2022
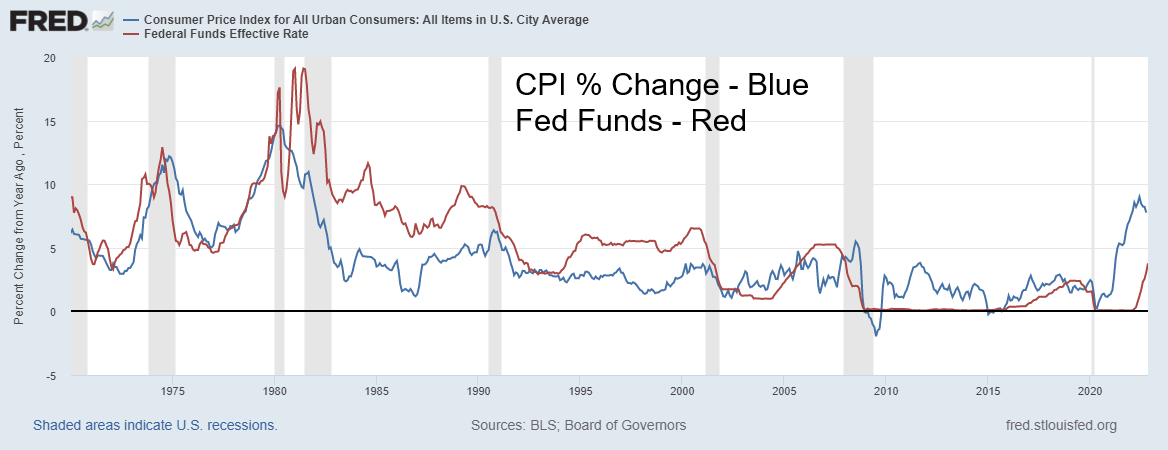
Source: www.stlouisfed.org
Markets & Trends
|
|
|
|
% Gains (Losses) Trends |
|
||||
|
|
Close Dec 31/21 |
Close Dec 9/22 |
Week |
YTD |
Daily (Short Term) |
Weekly (Intermediate) |
Monthly (Long Term) |
|
|
Stock Market Indices |
|
|
|
|
|
|
|
|
|
`S&P 500 |
4,766.18 |
3,934.38 |
(3.4)% |
(17.5)% |
up (weak) |
neutral |
neutral |
|
|
Dow Jones Industrials |
36,333.30 |
33,476.46 |
(2.8)% |
(7.9)% |
up (weak) |
up |
up |
|
|
Dow Jones Transport |
16,478.26 |
13,762.82 |
(5.2)% |
(16.5)% |
neutral |
neutral |
up (weak) |
|
|
NASDAQ |
15,644.97 |
11,461.50 |
2.1% |
(26.7)% |
up |
down |
down (weak) |
|
|
S&P/TSX Composite |
21,222.84 |
19,947.07 |
(2.6)% |
(6.0)% |
up (weak) |
neutral |
up |
|
|
S&P/TSX Venture (CDNX) |
939.18 |
577.62 |
(3.6)% |
(38.5)% |
down |
down |
down |
|
|
S&P 600 (small) |
1,401.71 |
1,186.60 |
(4.7)% |
(15.4)% |
neutral |
neutral |
up (weak) |
|
|
MSCI World Index |
2,354.17 |
1,988.10 |
(2.0)% |
(15.6)% |
up |
neutral |
down |
|
|
Bitcoin |
47,907.71 |
17,170.79 |
1.3% |
(64.2)% |
down (weak) |
down |
down |
|
|
|
|
|
|
|
|
|
|
|
|
Gold Mining Stock Indices |
|
|
|
|
|
|
|
|
|
Gold Bugs Index (HUI) |
258.87 |
227.68 |
(3.9)% |
(12.1)% |
up |
neutral |
down |
|
|
TSX Gold Index (TGD) |
292.16 |
277.67 |
(1.8)% |
(5.0)% |
up |
neutral |
down |
|
|
|
|
|
|
|
|
|
|
|
|
% |
|
|
|
|
|
|
|
|
|
U.S. 10-Year Treasury Bond yield |
1.52% |
3.59% |
2.9% |
136.2% |
|
|
|
|
|
Cdn. 10-Year Bond CGB yield |
1.43% |
2.89% |
4.0% |
102.1% |
|
|
|
|
|
Recession Watch Spreads |
|
|
|
|
|
|
|
|
|
U.S. 2-year 10-year Treasury spread |
0.79% |
(0.75)% |
5.1% |
(194.1)% |
|
|
|
|
|
Cdn 2-year 10-year CGB spread |
0.48% |
(0.96)% |
2.0% |
(300.0)% |
|
|
|
|
|
|
|
|
|
|
|
|
|
|
|
Currencies |
|
|
|
|
|
|
|
|
|
US$ Index |
95.59 |
104.80 |
0.3% |
9.6% |
down |
neutral |
up |
|
|
Canadian $ |
.7905 |
0.7338 |
(1.2)% |
(7.2)% |
down |
down |
down |
|
|
Euro |
113.74 |
105.29 |
flat |
(7.4)% |
up |
neutral |
down |
|
|
Swiss Franc |
109.77 |
106.96 |
0.3% |
(2.6)% |
up |
up |
down |
|
|
British Pound |
135.45 |
122.53 |
(0.2)% |
(9.5)% |
up |
neutral |
down |
|
|
Japanese Yen |
86.85 |
73.16 |
(1.7)% |
(15.8)% |
up |
neutral |
down |
|
|
|
|
|
|
|
|
|
|
|
|
|
|
|
|
|
|
|
|
|
|
Precious Metals |
|
|
|
|
|
|
|
|
|
Gold |
1,828.60 |
1,810.70 |
0.1% |
(1.0)% |
up |
neutral |
neutral |
|
|
Silver |
23.35 |
23.72 |
2.0% |
1.6% |
up |
up (weak) |
neutral |
|
|
Platinum |
966.20 |
1,036.20 |
0.9% |
7.2% |
up |
up |
up (weak) |
|
|
|
|
|
|
|
|
|
|
|
|
Base Metals |
|
|
|
|
|
|
|
|
|
Palladium |
1,912.10 |
1,968.800 |
3.6% |
3.6% |
neutral |
down |
neutral |
|
|
Copper |
4.46 |
3.88 |
0.8% |
(13.1)% |
up |
neutral |
neutral |
|
|
|
|
|
|
|
|
|
|
|
|
Energy |
|
|
|
|
|
|
|
|
|
WTI Oil |
75.21 |
71.02 |
(11.2)% |
(5.6)% |
down |
down |
up |
|
|
Nat Gas |
3.73 |
6.25 |
(0.5)% |
67.6% |
neutral |
down |
up |
|
Source: www.stockcharts.com
Note: For an explanation of the trends, see the glossary at the end of this article.
New highs/lows refer to new 52-week highs/lows and, in some cases, all-time highs.
Source: www.stockcharts.com
Markets suffered the worst week since September as, once again, fear of the Fed jumped. Not helping was the Producer Price Index (PPI) that came out on Friday. The PPI was up 0.3% in November. The problem was, the market was expecting only a 0.2% gain. The Core PPI (less food and energy) gained 0.4% once again above the expected gain of 0.2%. Falling oil prices did help somewhat, but food prices continue to rise. Also, consumer sentiment was stronger and the Purchasing Managers’ Index (PMI) reported earlier in the week were also stronger than expected. All this weighed on the stock markets, and they fell.
The S&P 500 was down 3.4%, the Dow Jones Industrials (DJI) dropped 2.8%, the Dow Jones Transportations (DJT) was off 5.2%, and the NASDAQ fell 4.0%. In Canada, the TSX lost 2.6% while the TSX Venture Exchange (CDNX) dropped 3.6%. The S&P 400 Mid was off 4.1% while the S&P 600 Small dropped 4.7%. Weakness in the small cap stocks was not good as you need to see them leading.
In the EU, the London FTSE was off 1.1%, the Paris CAC 40 fell 1.0%, the German DAX dropped 1.1%, and Euronext fell 1.1%. In Asia, China’s Shanghai Index (SSEC) was a winner as COVID restrictions eased up 1.6% and Hong Kong’s Hang Seng jumped 6.6%. The Tokyo Nikkei Dow (TKN), not to be left out, gained 0.4%. North America and the EU were down but Asia was up.
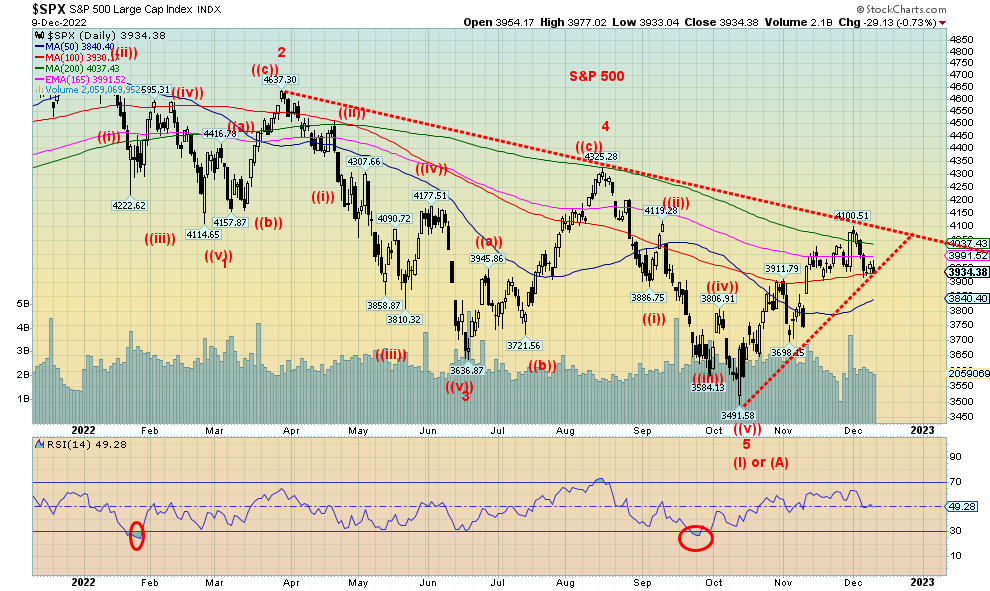
The S&P 500 has run into a wall of resistance at the 200-day MA (currently 4,037). Resistance was expected there, but the reality is we must firmly break over that level if we are to go higher. Only the DJI has broken above its 200-day MA, a divergence with the rest of the market. The NASDAQ isn’t even close. The DJT has underperformed the DJI. And the mid caps and small caps continue to struggle. We could still hold on through December and even experience a Santa Claus rally. But beyond January we are not so sure, and we continue to see dark clouds on the horizon.
We have continued to see the markets as engaged in a corrective to the decline that got underway in January 2022. There is little doubt we will close the year in the red. It would be the first down year since 2018. That year the DJI was down 5.6%. So far in 2022 the DJI is down 7.9%. More on the decennial cycle in an upcoming Scoop when we do our annual forecast.
As to the current correction, are we finishing the correction or is this just a pullback before another wave takes us up again to either a flat correction or a slightly higher high? Interestingly, Elliott Wave International (www.elliottwave.com) believes we are completing a correction, whereas we see the potential for a pullback now and one more attempt to a high later in the month into 2023. That the S&P 500 ran into resistance at the 200-day MA is not surprising. But the divergence with the DJI is worrisome. We need to break out over 4,100 to suggest higher levels. A breakdown now under 3,900 could set us up for further declines to 3,800. A breakdown under 3,700 would confirm the high at 4,100 and under 3,600 new lows are highly probable. The all-time high was 4,818. Only above 4,500 could we consider new highs are possible.
In following economists such as Martin Armstrong of Armstrong Economics (www.armstrongeconomics.com), we note they see considerable danger ahead in 2023. We are pointed towards a recession and there are rumblings in behind of a potential liquidity crisis. Liquidity crisis is what we experienced in the 2008 financial meltdown and the 2020 pandemic meltdown. Our main essay on potential dangers in the international currency swap market and the potential for sovereigns to go under remain in the spotlight. As well, we have noted problems with pension funds. A crisis is brewing. We just don’t know when it will hit. But if we are making a high into early January, we’d be cautious after that.
Source: www.stockcharts.com
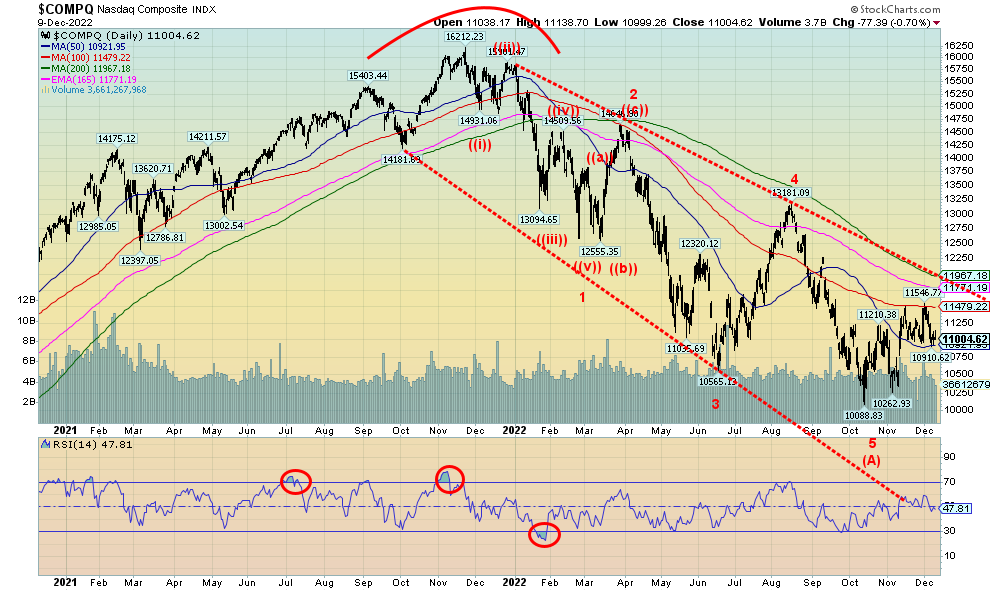
The NASDAQ, led by the FAANGs, continues to struggle. The NASDAQ fell 4.0% this week. The NY FANG Index was down only 2.3%, but a number of significant FAANGs were down. Notably, Meta fell 6.2%, Amazon was down 5.3%, Google was off 7.7%, while Tesla dropped 8.1%. Holding the FAANGs up was Baidu, up 5.5%, and to a lesser extent Alibaba, up 1.4%. Nvidia was also positive, up 0.7%. Elon Musk is still the richest man in the world, but his wealth has taken a hit. After peaking at around $250 billion, Musk has now dropped to $190 billion. That’s quite a haircut, even for a billionaire. That would still rank Musk around Algeria and Hungary as the 57th largest country by GDP in the world. Except Musk isn’t a country. He’s one person.
The NASDAQ has been the weakest by far of the major indices, not even able to reach the 200-day MA (currently 11,967). The NASDAQ has struggled to break out over the 100-day MA and is now at support of the 50-day MA. A break back under 10,900 could send the NASDAQ tumbling lower. Under 10,400 new lows are highly probable. The NASDAQ doesn’t break out until it’s over 12,000. That doesn’t appear to be in the cards at the moment.
Source: www.stockcharts.com
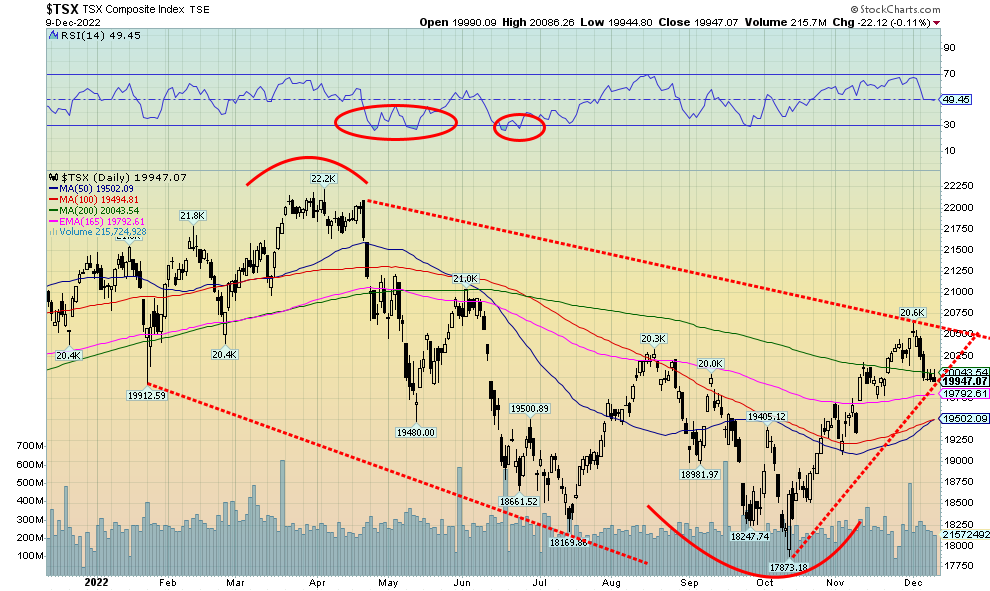
It wasn’t a great week for the TSX as it fell 2.6%. The TSX Venture Exchange (CDNX) fared worse, down 3.6%. Of the 14 sub-indices, only two saw gains. Consumer Staples (TCS) was up 1.5% and Utilities (TUT) gained 0.4%. Leading the dirty dozen down was the volatile Health Care (THC) sector down 12.5%. Energy (TEN) fell 8.1% while Information Technology (TKK) dropped 5.1%. Energy, previously a big winner, still clings to a 44.1% gain for the year despite oil prices turning negative on the year. The TSX is down 6% on the year. The TSX gained above the 200-day MA but ran into a wall around 20,500. Since then, it has fallen back to just under the 200-day MA (currently at 20,043). If the TSX can regroup here, then we could still new highs above 20,600. There is resistance up to 21,000. The TSX with its sub-sectors is always a choice between those sectors. Golds (TGD) still look good as do Metals (TGM) and Materials (TMT). The financial sub-indices (Financials (TFS), Income Trusts (TCM), and Real Estate (TRE)) continue to look iffy going forward. A break under 19,800 could be negative and under 19,400 the rally may be considered over.
10-year Treasury Bond/Canadian 10-year Government Bond (CGB)
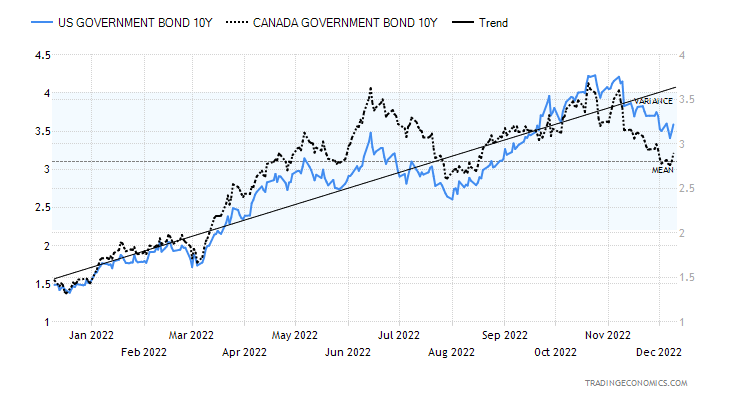
Source: www.tradingeconomics.com, www.home.treasury.gov, www.bankofcanada.ca
Bond yields ticked back up this past week as the U.S. 10-year treasury note rose to 3.59%, up 2.9% on the week and the 10-year Government of Canada bond (CGB) was up about 4.0% to 2.89%. The recession spreads bounced back a bit as a result as the 2–10 spread was negative 75 bp in the U.S. and negative 96 bp in Canada. Highest levels since the early 1980s.
The biggest excitement on the week was the PPI numbers on Friday when year over year (y-o-y) PPI was up 7.4%. Chart is below. The Michigan Consumer Sentiment Index for November (final) came in at 59.1 above expectations of 56.9 and last month’s 56.8. It seems consumers are getting into the Christmas spirit. However, it remains the lowest seen since the mid-1970s. Canada hiked the key bank rate 50 bp as was expected. It is now at 4.25%. The ISM non-manufacturing Index was 56.5, above the expected 53.3 and last month’s 54.4. All these helped push yields up.
The big number this week is the FOMC on Dec 13–14 with a 50 bp hike widely expected. CPI is out on Tuesday and expected is a rise of 7.3%, down from 7.7%. Retail sales are out on Thursday, and it is expected to fall 0.2% month over month (m-o-m).
We are not expecting any big rise immediately here for bonds. We did hit near some support zones. If the perception is that the Fed will ease up, bond yields could fall further. Otherwise, it could also push yields back up if they don’t signal a slowing.
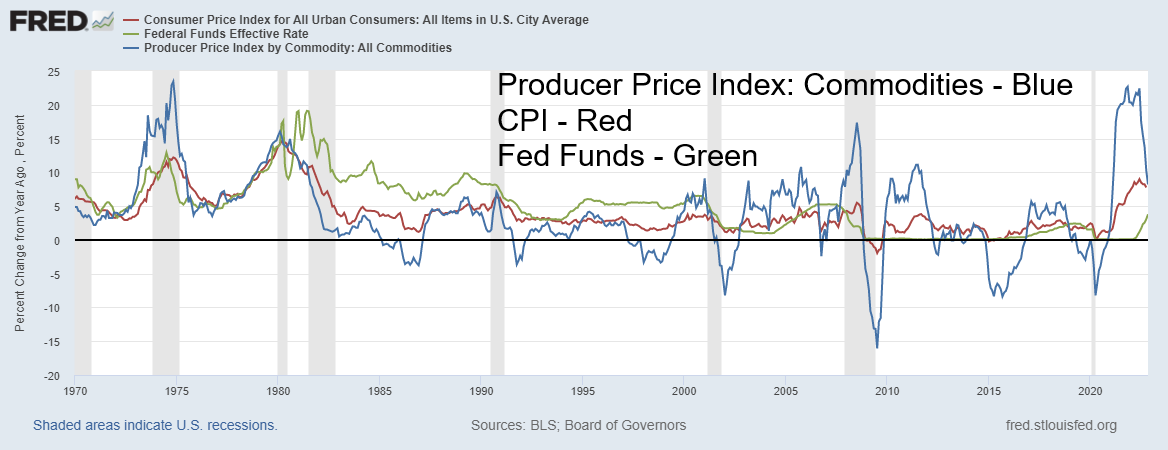
PPI, CPI, Fed Funds – 1970–2022
Source: www.stlouisfed.org
The PPI for November rose 0.3% m-o-m. That was above the expected 0.2% gain. The PPI was up 7.4% y-o-y. One of the main causes was a sharp rise in vegetable prices. That gain was partially offset by a fall in energy prices. Above is a chart from 1970 showing the PPI for commodities, the CPI, and the Fed funds rate. We are showing the PPI for commodities rather than the final demand PPI that is the headline number. The PPI for all commodities was up 8.2% y-o-y. The highlight here is that the Fed funds rate is still sharply below both the CPI and PPI. As noted, the Fed is expected to hike at least 50 bp at the Dec 13–14 FOMC, but that still leaves the key rate only at 4.25–4.50% below the PPI (8.2%) and CPI (7.7%). As you can see from the chart, it took hiking the Fed funds rate above the rate of inflation (CPI, PPI) in 1980 to wrestle inflation to the ground. The cost was a steep recession. The Fed funds remained above the CPI and PPI until around 2000 when the high-tech/dot.com crisis erupted and the Fed lowered interest rates to close to zero. Following both the financial crisis of 2008 and the pandemic crisis of 2020, the Fed dropped the rate to zero. Ultra record-low interest rates, coupled with QE, helped burst the housing bubble of the early 2000s and the everything bubble of the 2010s. The bubble got even larger after the pandemic crisis of 2020 as housing and the stock market soared. Asset inflation at its best—or is it worst.
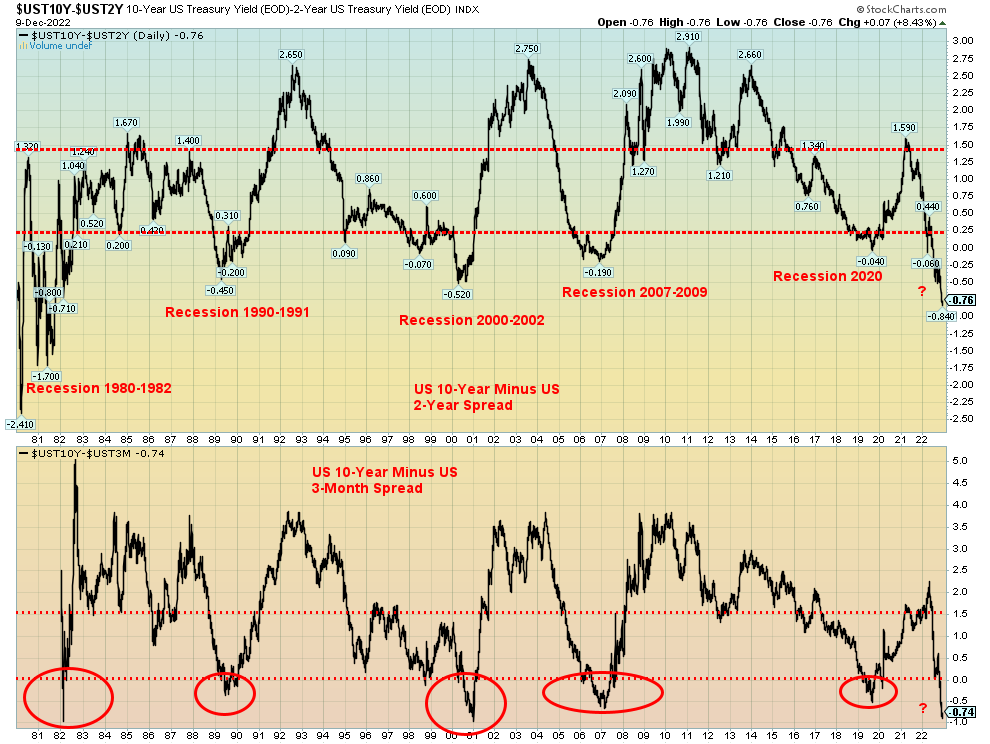
Source: www.stockcharts.com
We continue to show the recession spreads: the 2-year–10-year spread, currently at negative 76 bp, and the 3-month–10-year spread, currently at negative 74 bp. We highlight this as these are the lowest spreads in 40 years since the early 1980s. We are definitely pointed to an official recession in 2023—the question is, when does it officially start? Many believe we are already in a recession, despite the ongoing rosy job numbers.
Source: www.stockcharts.com
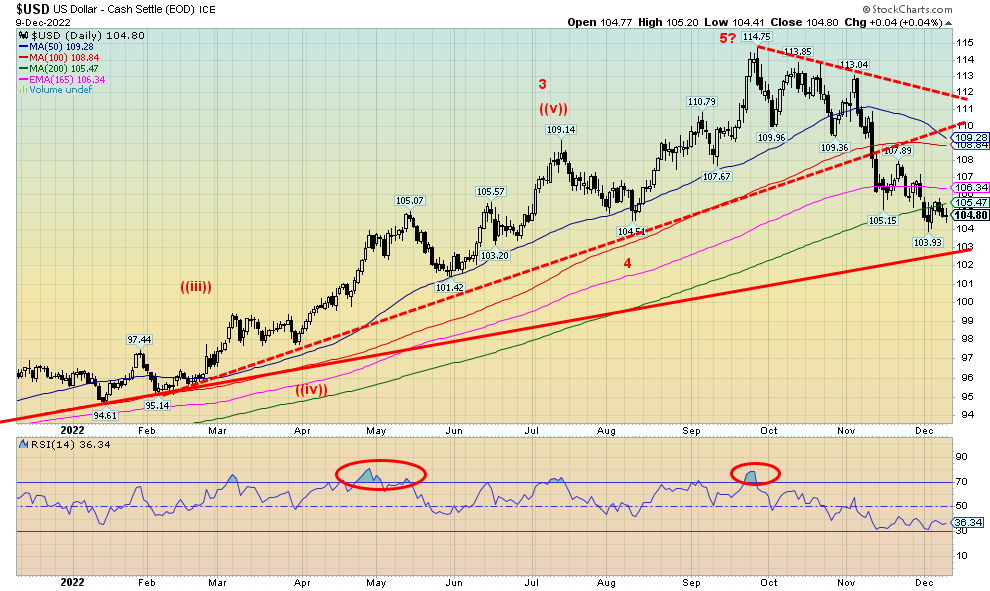
The US$ Index (USDX) continues to struggle, clinging to around the 200-day MA. This past week the US$ Index rose 0.3%, the euro was essentially flat, the Swiss franc was up 0.3%, the pound sterling was off 0.2%, while the Japanese yen gave up most of the previous week’s gains, down 1.7%. The Cdn$ lost 1.2%, thanks to sinking oil prices. As noted, the US$ Index is clinging to just under the 200-day MA (currently at 105.47), closing the week at 104.80. Looming below is major support near 103. That area is expected to provide even stronger support, but a breakdown under that level could prove dangerous for the US$ Index. Only above 107 might we consider that a low is in.
Source: www.stockcharts.com
Gold prices managed to stay flat on the week against the backdrop of a weaker stock market, threats of higher interest rates from the Fed, and economic numbers still suggesting the economy is hanging in. Silver rose 2.0%, platinum was up 0.9%, and the near precious metals saw palladium rise 3.6% while copper was up 0.8%. The gold stocks, however, followed the stock market down with the Gold Bugs Index (HUI) losing 3.9% while the TSX Gold Index (TGD) fell 1.8%.
Gold is still trying to look past the Fed easing up on its rate hikes. As noted, a rate hike of 50 bp is widely expected this week. But traders will be parsing the words of the Fed afterward. Some think the Fed will still hike another 50 bp in January. The PPI rose slightly more than expected this week, which didn’t help gold prices. On the week the US$ Index was up and that didn’t help gold either.
The COT was not printed at our usual source this past week, and to put together the COT from the CFTC one needs a PhD in math. Okay, that’s a bit of an exaggeration, but it is difficult to interpret. We did note that long open interest appeared to fall roughly 16,000 contracts this past week while short open interest fell over 5,000 contracts. That would lower the commercial COT to roughly 32%. Falling but not yet bearish.
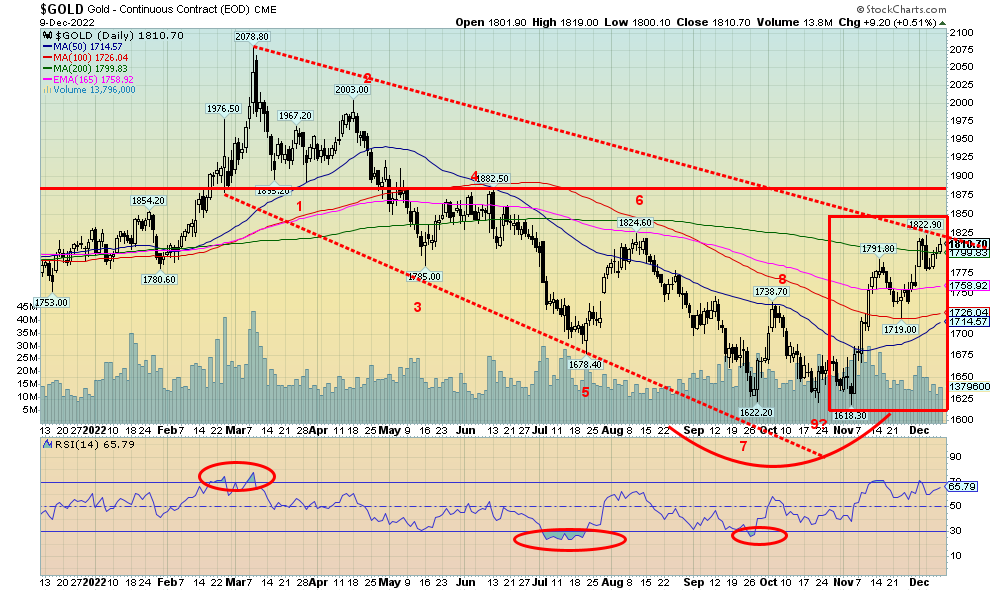
Technically, gold is struggling to stay above the 200-day MA. It fell back earlier in the week but regained by week’s end to close basically flat. So far, $1,770/$1,775 support is holding. The real danger point comes under
$1,720 where odds would suggest that a top is in. Under $1,665 new lows are probable. If this is just a flat correction, then gold would lose its luster once again and fall to new lows below $1,620.
We have poked up against $1,825 resistance, but there remains a strong resistance level at $1,825/$1,875. Breaking above that level would be quite positive and we’d be looking at $1,900 and up to $1,975. Above $1,980 new highs above $2,089 are possible.
China reported an increase in its gold reserves for the first time in three years. China is not noted to be fully transparent as to its official level of gold reserves. Officially, they report that they added 32 metric tonnes in November, bringing their total holdings to 1,980 metric tonnes. It is suspected the actual level is higher. The U.S. holds officially 8,133 metric tonnes. China ranks seventh in holdings of gold reserves, behind the U.S., Germany, IMF, Italy, France, and Russia. Canada brings up the rear with none. We closed the week noting a story that said Egyptians were flocking to gold as the Egyptian pound falls. Egypt is heavily dependent on food imports from…you guessed it, Russia and Ukraine.
Source: www.stockcharts.com
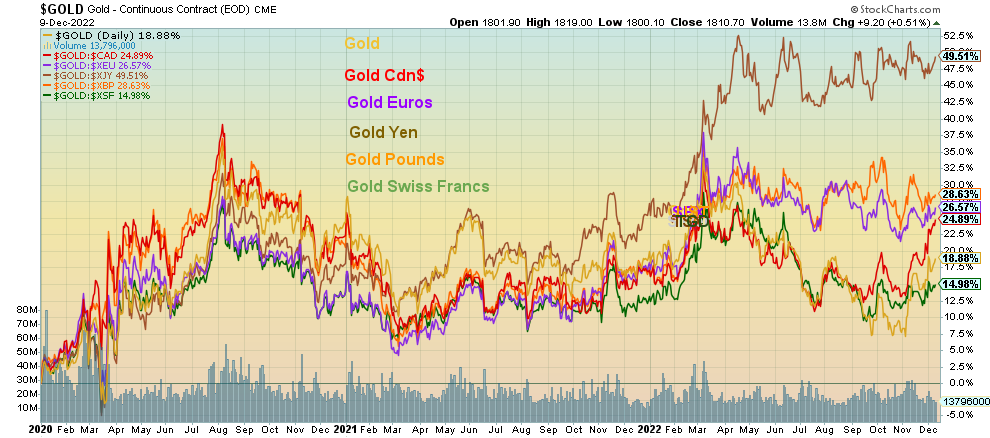
As we have noted on several occasions, gold in U.S. dollars has been almost the weakest of all the major currencies. Since January 2020, gold in US$ is up 18.9%, while slightly lower is gold in Swiss francs, up 15.0%. The big winner has been gold in Japanese yen, up almost 50%. Gold in pound sterling has gained 28.6%, while gold in euros is up 26.6%. Gold in Cdn$ is up almost 25%. Gold is a hedge against currency devaluation. In many lesser currencies, the rise for gold in their currencies is even higher. Tellingly, the S&P 500 is up 21.8% and the TSX is up 16.9% during the same period.
Source: www.stockcharts.com
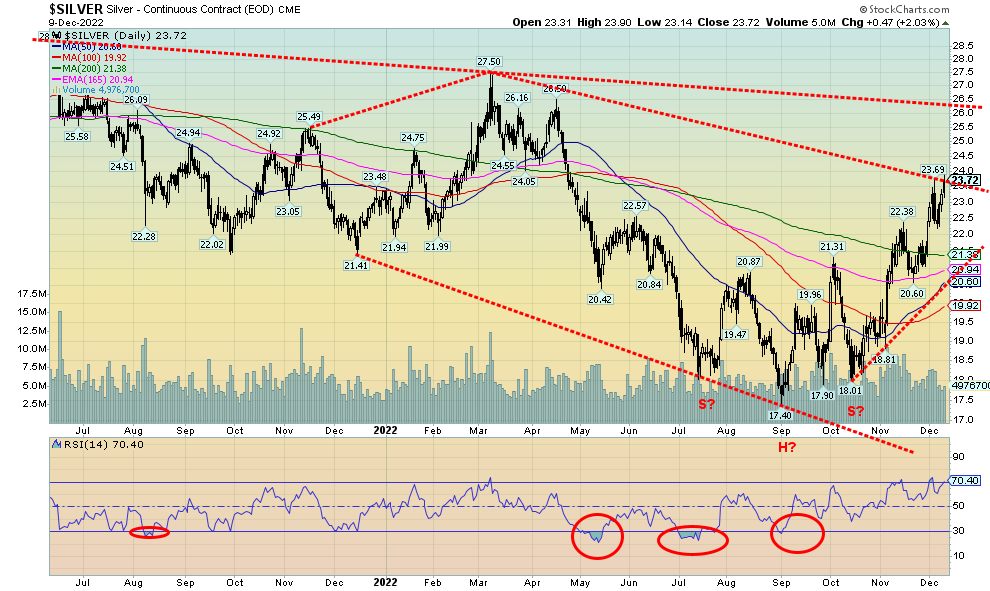
Silver had a good week, rising just over 2.0%. Unfortunately, as we note next, it didn’t translate into any great gains for stocks, although silver stocks did hang in this past week. Silver has successfully regained above $23, a level we considered important. So far, we are holding above that level despite a dip back under earlier in the week. A break under $22.25 would be negative and could set up further declines towards $21. Under $20.60 we’d consider the rally over. Silver has been flirting with overbought levels, but it is not extremely overbought. That suggests to us that we could move higher, subject to not breaking below the levels noted. New highs above $24 could send us towards that major resistance line near $26.25. Just because silver remains in shortages doesn’t mean we automatically move higher. The paper silver market still rules the physical silver market. Silver maples at SilverGoldBull (www.silvergoldbull.ca) are still at a 30% premium to spot.
As with the gold COT, we don’t have precise numbers, but it appears long open interest for the commercials fell 1,500 contracts this past week, while shorts rose about 1,800 contracts. That would leave the commercial COT slightly weaker on the week at 37%, but it is still bullish overall.
We note silver made a slight new high this week, but gold did not. A divergence?
Source: www.stockcharts.com
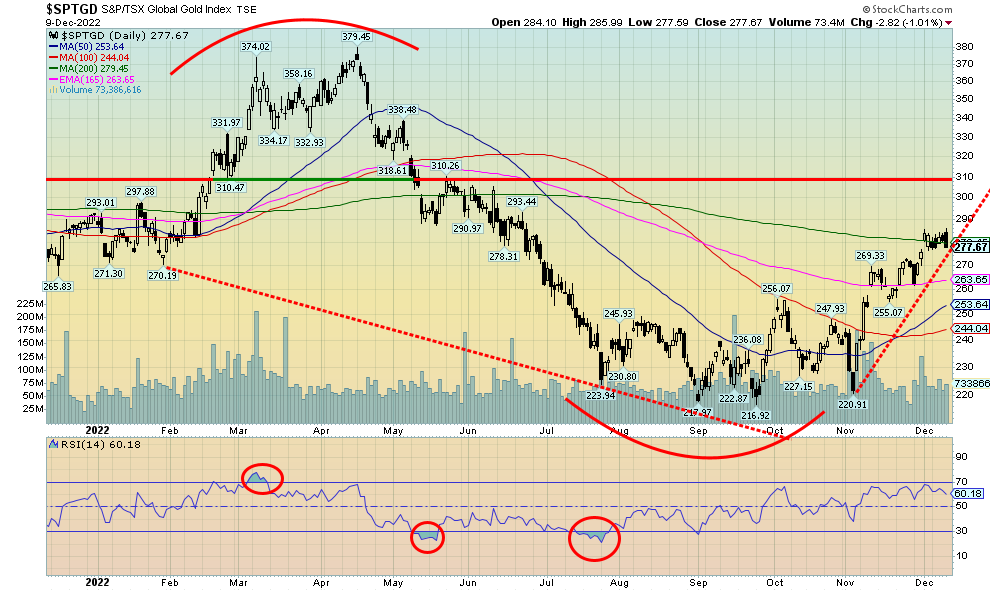
Despite gains for both gold and silver this past week, the gold stocks instead followed the broader stock markets downward. The TSX Gold Index (TGD) fell 1.8% while the Gold Bugs Index (HUI) was off 3.9%. Both remain down on the year, TGD down 5.0% and the HUI down 12.1%. Overall, that is somewhat better than the broader market. The TGD remains short of a potential breakout level near 310 and has been trading at the 200-day MA for the past week or so. Is this just a consolidation before another upward move? Or is it topping zone that will see the TGD fall back once again? A break under 263 and especially under 260 would suggest to us that the trend is reversing to the downside. A breakout above 290 could set us on the way to major resistance at 310. Indicators are not particularly oversold, so there is room to regroup here before moving higher once again. But we are also at a crossroad where we need a move soon either up or down to give us clarity on the next direction. We are up over 25% from that November low so the run has been good. But we’ve seen this picture before where everyone is getting excited for a further rally, only to be pushed back down once again. Seasonally, things are positive for us. So hopefully that should help. Friday’s action was disappointing as we put in a bit of a reversal day with a new high, followed by outside day down move and lower close. Below 235 new lows are probable.
Source: www.stockcharts.com
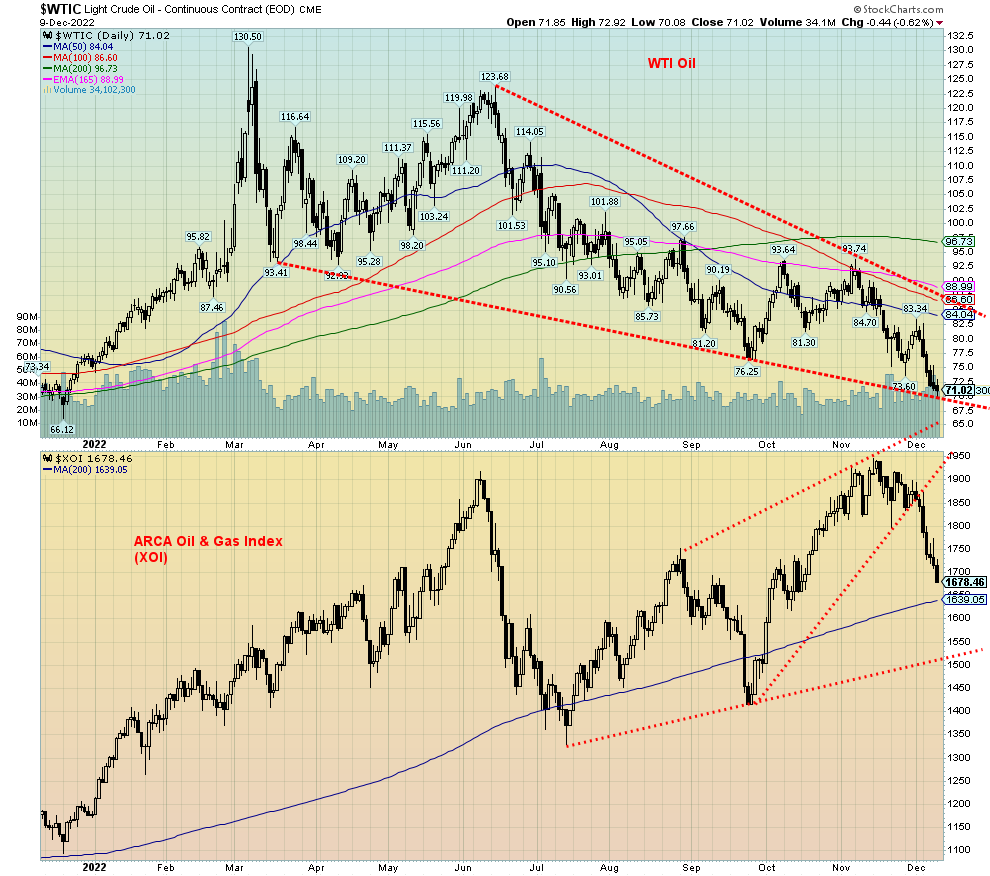
Whither oil prices? This past week WTI oil fell to its lowest level since December 2021. It was back then that oil prices began to rise as a result of the growing threat of war in the Ukraine. The low was seen on December 20, 2021, at $66.12. One year later and here we are again only about $5 above that December 20 low. We also appear to be at the bottom of the bear channel and near our target of $69 stated in this report earlier. With an RSI just under 30, we have also entered oversold territory. Although we note that oversold is merely a warning and does not guarantee an immediate low.
This past week WTI oil was hammered, down 11.2%. Brent oil fell 10.2%. Oil prices are now down on the year. WTI is down 5.6% and Brent is off 1.2%. No joy in oil land. Not so natural gas (NG). While North American natural gas—aka West Texas at the Henry Hub—did slip 0.5%, it is still up 67.6% in 2022. EU NG at the Dutch Hub rose 2.6% and is up 97.8% thus far in 2022. War does have consequences. Nonetheless, the energy stocks responded negatively to the fall in oil prices as the ARCA Oil & Gas Index (XOI) was down 8.9% and the TSX Energy Index (TEN) fell 8.1%.
One would have thought oil prices would have gone up this past week. China was poised to ease COVID restrictions, there was an oil spill on the Keystone pipeline slowing exports from Canada, and a slew of tankers are unable to go through the Turkish Straits. Apparently, the latter is over a row with Turkish authorities and insurers over the supposed start of the Russian oil price cap. As noted here before, price caps don’t work, and this should prove to be no different. As to the shutdown of Keystone, that definitely impacts Alberta oil which was already trading below market and now will fall even further.
Technically, WTI oil looks as good as it has been in some time, given proximity near the bottom of the bear channel and our price target, coupled with oversold levels on numerous technical indicators. Evidence of a low will come when WTI oil regains above $75, but really WTI oil needs to regain above $84 to suggest to us that a low is most likely in.
Saudi Arabia and China met this past week and China is indicating they will buy more oil from Saudi Arabia. Saudi Arabia has made a shift from the U.S. to China which, of course, has geopolitical consequences. As well, China is indicating strongly that the yuan will be the currency that oil will trade in. That is red flag in front of the U.S. as the U.S. dollar is the world’s reserve currency and all commodities trade in U.S. dollars. It is noteworthy that, prior to invasions, Iraq was demanding payment in euros for its oil and Libya was in the process of setting up a pan-African currency that would be the gold dinar. That would mean that Libya would only accept gold dinars as payment for its oil. Challenges to the global supremacy of the U.S. dollar do not go unheeded. However, it is noteworthy that China does not have the depths of markets, particularly in bonds, that the U.S. does. However, this attempt to usurp U.S. dollar global hegemony should not go unnoticed.
Oil markets are oversold. Speculators may wish to take note.
Copyright David Chapman, 2022
|
GLOSSARY Trends Daily – Short-term trend (For swing traders) Weekly – Intermediate-term trend (For long-term trend followers) Monthly – Long-term secular trend (For long-term trend followers) Up – The trend is up. Down – The trend is down Neutral – Indicators are mostly neutral. A trend change might be in the offing. Weak – The trend is still up or down but it is weakening. It is also a sign that the trend might change. Topping – Indicators are suggesting that while the trend remains up there are considerable signs that suggest that the market is topping. Bottoming – Indicators are suggesting that while the trend is down there are considerable signs that suggest that the market is bottoming. |
Disclaimer
David Chapman is not a registered advisory service and is not an exempt market dealer (EMD) nor a licensed financial advisor. He does not and cannot give individualised market advice. David Chapman has worked in the financial industry for over 40 years including large financial corporations, banks, and investment dealers. The information in this newsletter is intended only for informational and educational purposes. It should not be construed as an offer, a solicitation of an offer or sale of any security. Every effort is made to provide accurate and complete information. However, we cannot guarantee that there will be no errors. We make no claims, promises or guarantees about the accuracy, completeness, or adequacy of the contents of this commentary and expressly disclaim liability for errors and omissions in the contents of this commentary. David Chapman will always use his best efforts to ensure the accuracy and timeliness of all information. The reader assumes all risk when trading in securities and David Chapman advises consulting a licensed professional financial advisor or portfolio manager such as Enriched Investing Incorporated before proceeding with any trade or idea presented in this newsletter. David Chapman may own shares in companies mentioned in this newsletter. Before making an investment, prospective investors should review each security’s offering documents which summarize the objectives, fees, expenses and associated risks. David Chapman shares his ideas and opinions for informational and educational purposes only and expects the reader to perform due diligence before considering a position in any security. That includes consulting with your own licensed professional financial advisor such as Enriched Investing Incorporated. Performance is not guaranteed, values change frequently, and past performance may not be repeated.
About the author


Website: https://www.enrichedinvesting.com
Disclaimer: David Chapman is not a registered advisory service and is not an exempt market dealer (EMD) nor a licensed financial advisor. We do not and cannot give individualised market advice. David Chapman has worked in the financial industry for over 40 years including large financial corporations, banks, and investment dealers. The information in this newsletter is intended only for informational and educational purposes. It should not be considered a solicitation of an offer or sale of any security. The reader assumes all risk when trading in securities and David Chapman advises consulting a licensed professional financial advisor before proceeding with any trade or idea presented in this newsletter. David Chapman may own shares in companies mentioned in this newsletter. We share our ideas and opinions for informational and educational purposes only and expect the reader to perform due diligence before considering a position in any security. That includes consulting with your own licensed professional financial advisor.