
“Whatever method you use to pick stocks…. your ultimate success of failure will depend on your ability to ignore the worries of the world long enough to allow your investments to succeed. It isn’t the head but the stomach that determines the fate of the Stockpicker.”
- Peter Lynch, American investor, mutual fund manager, author, philanthropist, manager of the Magellan Fund for Fidelity Investments 1977-1990; b. 1944
“Real knowledge is to know the extent of one’s ignorance.”
- Confucius, Chinese philosopher of the Spring and Autumn period, paragon of Chinese sages, teachings and philosophy underpin East Asian culture and society; c551BCE-c479BCE
“The riskiest moment is when you are right. That’s when you’re in the most trouble, because you tend to overstay the good decisions.”
- Peter L. Bernstein, American financial historian, economist, educator, member of the research staff of the Federal Reserve Bank of New York, and the Office of Strategic Services, Washington, author Primer on Money, Banking and Gold 1965 plus others; 1919-2009
For roughly thirty-years we sat on the trading desks of a large government agency, a major A bank and a large insurance company. Our role was mostly as the head of trading for money markets. Money markets refers to the trading of short-term debt investments including corporate loans, interbank loans (loans between banks), intrabank loans (loans with other parts of the organization), commercial paper, treasury bills, repurchase agreements (repos), other securities including short-term bond strips, bankers’ acceptances, CDs, plus others and including derivatives such as futures, options, future rate agreements, interest rate swaps. Term wise, while the focus was largely overnight to three months, our portfolios often went out to five years. Our key role was in risk management as we had to manage the inevitable mismatches as to term and different financial instruments. Despite our role being money markets, we also dealt in foreign exchange, derivatives and bonds. Everything interlocked.
Oddly the pecking order on the trading floor often had bond dealers and the derivatives dealers at the top followed by the foreign exchange dealers. There were also precious metals dealers in a corner largely forgotten. Sales were separate but were a key element in dealing. At the A bank sales included both a corporate and a branch dealing desk. The hub for the entire trading floor was money markets as everyone on the floor dealt with them. Plus, many internal players also dealt with money markets including corporate finance, equity trading, and, trade finance. Money markets greased the wheel. Nevertheless, a common and key role for everyone was risk management. There were even in the case of the A bank global risk management whereby they would try to determine the exposure of the entire bank along with our particular region.
At a recent meeting we were at this past week we discussed risk management and spent most of the meeting trying to determine where will the risks come from. Banks, shadow banks, sovereign countries, weather events, war, political chaos, stock market crashes, the rise of AI? History is replete with many events from those sources and others. Some could threaten the collapse of the global economy. But the real unknown comes from the unexpected black swan event.
Yes, black swan events. A surprise that has a major impact. However, it is unfair to black swans as rare as they are. Black swans were thought to not exist until one was found. What we learned is that something we think is quite rare may be more common than we thought. The recent earthquake in Morrocco and the massive flooding as the result of dam bursts in Libya are major examples of a weather/nature black swan event. But so was the pandemic, the collapse of Lehman Brothers, 9/11 even the rise of AI. And going back further the October 1929 crash, and even the onset of WW1 and WW2. For investors when a black swan event occurs and the market collapses, they learn the true meaning of holding for the long-term. A black swan event is usually highly destructive but it also has a low probability so when it occurs everyone is surprised even if they shouldn’t be.

Source: Roy Muz, www.unsplash.com/@roymuz
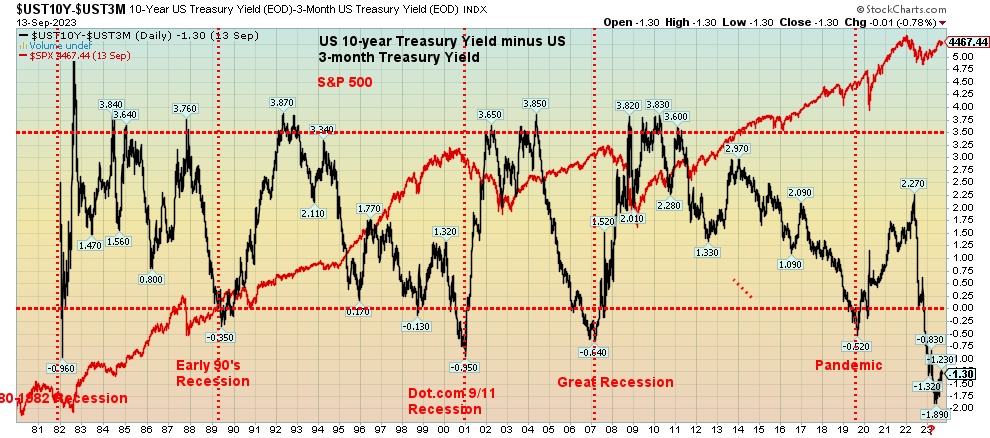
One of the things we discussed at our meeting was one we have noted many times – the inverted yield curve as a warning for a coming recession. Since the 1970’s when these things were tracked, the coming of a sharply inverted yield curve has had a 100% record of predicting a recession. The recession doesn’t start until at least 6-12 months after the inverted yield curve bottoms but it could be up to 24 months from the start of the yield curve becoming inverted. The longer the yield curve remains inverted the more the potential rises for a steeper recession. But no, the inverted yield curve is not a black swan. Instead it’s a warning which we can heed or not.
Source: www.stockcharts.com
We are showing the 3-month-10-year yield curve (3m-10). While we and many others use the 2-year-10-year (2-10) yield curve the 3m-10 yield curve can sometimes be a better predicter. Here we seen the 3m-10 yield curve inverting prior to the 1980’s recession, the early 90’s recession, the dot.com 9/11 early 2000’s recession, the Great Recession 2007-2009 and the pandemic recession 2020. Notice big dips in the 3m-10 curve prior to the Asian financial crisis 1997 and the Russian/LTCM collapse 1998 although the yield curve never turned negative.
The 3m-10 first went negative in October/November 2022 just as the stock market was bottoming. The absolute low so far occurred in June 2023. By that measurement the recession could be underway by December 2023 or as far out as October 2024. We say this despite only circumstantial evidence thus far that we could even enter a recession. Many officials both monetary and government are claiming that only a soft landing could occur. Are they really going to say we are going to have a hard landing? Germany is in an official recession and much of the EU particularly the U.K. is not far behind. Canada recently reported a quarter of negative growth. Mild and shallow so far. Japan almost constantly reports low growth and China, the world’s second largest economy is slowing. A slowing China could have global implications. Then just as it seems to be slowing China perks up again. But China can’t be ignored and the growing cold war between the U.S. and China cannot be ignored either because of its global implications. The world’s two largest and most important economies going head-to-head in a largely destructive manner.
The world is awash in debt. The focus is often on the huge debt obligations of countries. The U.S. government is the most indebted government in the world. Yet as long as the U.S. dollar remains the world’s reserve currency the U.S. has a license to print money. U.S. dollar securities still make up about 57% of total central bank reserves, the lowest in years. The U.S. prints fiat money, where the money is worth only what the government tells you it is worth. Money that is essentially an I.O.U. backed by nothing but the good faith of the U.S. government. If that faith is ever lost or is threatened the U.S. dollar could collapse. Eventually all fiat currencies return to their intrinsic value – zero.
But other countries are in more dire financial shape, corporations are laden with debt as are households. Here in Canada, Canadian households have almost the highest debt to GDP and Income in the world. The mortgage market is overburdened with debt from households that helped prop up an unsustainable bubble in housing prices. Rising interest rates are putting a big dent in the housing market and the risk of a housing market collapse is rising. All bubbles eventually burst. The pain is widespread.
Many countries are already bankrupt or on the verge of bankruptcy. Some 95 countries are rated below BBB the lowest investment grade and are effectively considered junk bonds. Some are rated as CCC or lower as they are either highly speculative or in default with little hope of recovery i.e., Pakistan. Ukraine, Argentina, Russia (however, Russia in that category is artificial as the U.S. put them there). Some such as Puerto Rico are in default and no hope of recovery. In the U.S. many banks are teetering and have been downgraded. Could we have more bank collapses as we did earlier with SVB Bank, Signature Bank and First Republic Bank? Yes. Commercial real estate loans pose a large unknown threat. European banks are also teetering. Japanese and Chinese banks are in many cases what we would call zombie banks. Alive but only surviving because the government won’t let them fail.
The pandemic, war, supply disruptions, trade wars and sanctions, extreme weather events are putting huge pressure on inflation as commodities become scarcer, food growing regions are disrupted and some are becoming uninhabitable due to extreme heat and drought. Extreme weather along with war are driving mass migrations. In the past climate change caused civilizations to collapse. Examples are numerous but ones we can think of off the top are the collapse of Mayan civilization of Mesoamerica, the Puebloan civilization of Chaco Canyon, New Mexico, the Viking civilization of Greenland and Iceland, and, the Angkor Civilization of Cambodia. There were others. But then the world didn’t have eight billion people in previous periods of extreme climatic change. Global war is threatening because of the ongoing conflict between Ukraine and Russia, a proxy war of East vs. West, along with growing tensions between the U.S. and China. Fear is growing of a false flag with nuclear weapons. Some are even proposing that the U.S. gets involved directly in the war. They already are indirectly by supplying weapons and more to Ukraine.
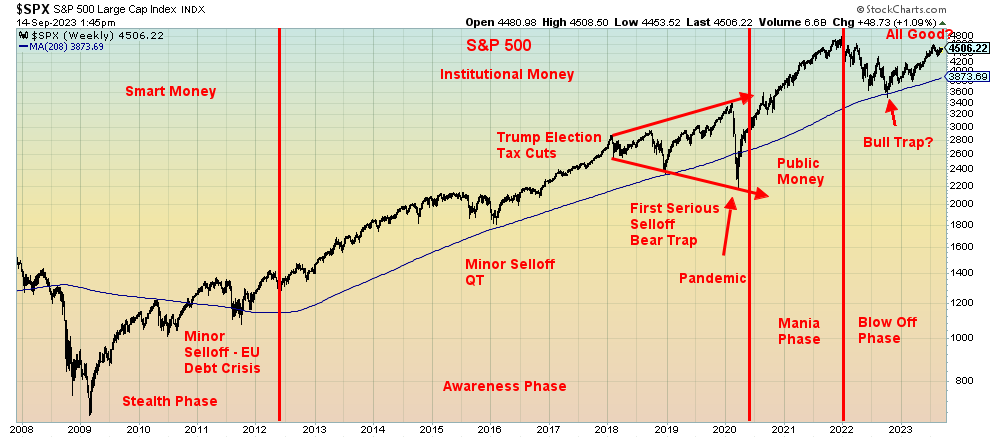
An interesting chart we have shown in the past shows how markets go through phases. First is the theoretical chart of how markets go through phases. Then we provide a weekly chart of the S&P 500 and apply the theory to the market dating from the low of the Great Recession in March 2009. We are now in the final phase when something happens that could cause markets to collapse. What we don’t know is the what, the black swan type of event that sparks a collapse. What we do know is that the pressure is building. Will it be a stock market crash ala October 1929? Or a debt crisis like the sub-prime mortgage crisis of 2007. Recall that Bear Stearns collapsed but it was absorbed by another firm. Merrill Lynch was absorbed but Lehman Brothers was allowed to collapse sparking a stock market crash that saw the S&P 500 collapse in all some 57%.
What now? SVB Bank, Signature Bank and First Republic bank collapsed. Markets fell but they didn’t collapse. The first wave down sparked a drop of 27.5% for the S&P 500. The rebound rally has been impressive but thus far has fallen short of the January 2022 all-time high. But what happens when the third wave down comes? Previous third waves down were not pretty. We note 1930-1932 down 83%, 1973-1974 down 48.2%, 2007-2009 down 56.8%. All for the S&P 500. But other smaller ones occurred as well. 2002 comes to mind when the market fell 33.8%.
Complacency is rising again that we’ll only have a soft landing. Nothing has really collapsed and the extreme weather/nature events happen to someone else. Unknown, however, as to what damage Hurricane Lee could cause. We are on that “return to normal” phase noted in Rodrigue’s chart. The third wave down is coming but from what we can see we are not prepared.
Those thirty years or so on trading desks plus another twenty as a stock broker/analyst we were witness to numerous black swans. The ones that stand out for us include – the Arab oil embargo 1973, the Iranian hostage crisis and rise in oil prices 1979, gold’s record rush to all-time highs with lines around the corner to buy gold 1979, the 1987 stock market crash, the invasion of Iraq 1990, the Russian/LTCM collapse 1998, the dot.com crash of 2000-2002 preceded by the dot.com/NASDAQ bubble, 9/11, the invasion of Iraq again 2003, the collapse of Lehman Brothers 2008, the gold crash April 2013, and, the pandemic crash of March 2020. Elsewhere we note the Japanese bubble of 1985-1990 and the subsequent crash 1990-1992. The three most vivid ones were the 1987 stock market crash, 9/11 and the March 2020 pandemic crash with a shout-out to the gold crash of April 2013.
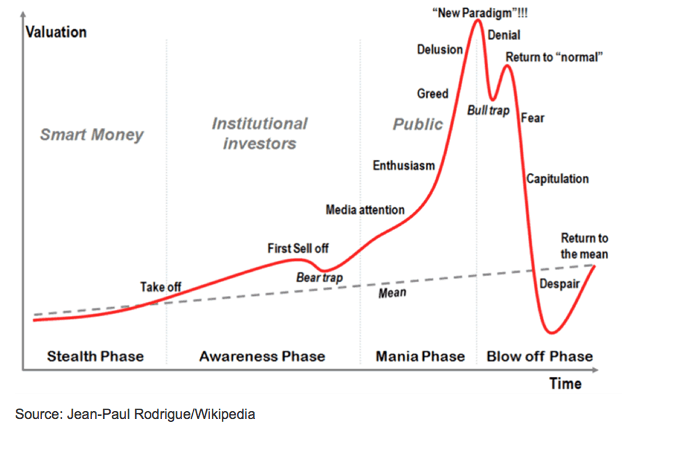
Source: www.wikipedia.org/wiki/Jean-Paul_Rodrigue
Source: www.stockcharts.com
Chart of the Week
CPI, Core CPI, Fed Rate 2000-2023
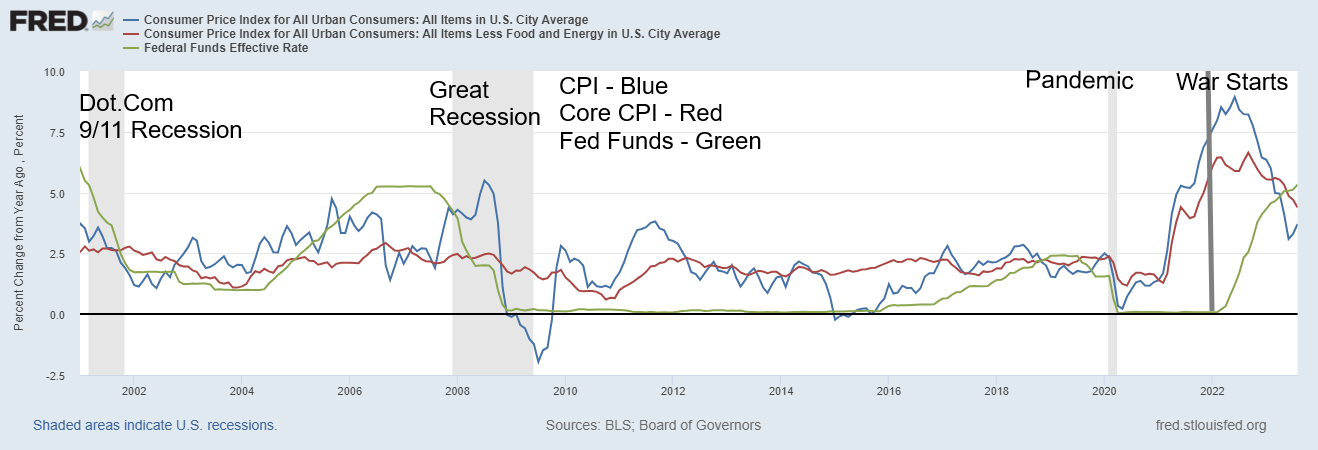
Source: www.stlouisfed.org
Yes, we have shown this chart in the past. But sometimes it bears repeating. The U.S. inflation numbers were released this week and largely they came in as expected. The August CPI was up 3.7% y-o-y vs. the expected 3.5% and July’s gain of 3.2%. Higher oil prices were to blame for the rise. The core CPI less food and energy was up 4.3% below July’s 4.7% and better than the expected 4.4%. With the Fed rate at 5.5% it finally exceeds the inflation rate and we have a positive yield spread for the first time in years. This is important as we really did not have that throughout most of the 2000’s. As the chart shows the inflation rate was mostly above the Fed rate except for brief periods the last real one being in 2005 and 2006 as the housing bubble was in progress. The real yield spread helped contribute to the slowly, at the time, unfolding sub-prime mortgage crisis. The Fed rate is also above the core CPI rate.
We have a positive yield curve for the first time in years. There are calls to lower interest rates. That would require political pressure being applied to the central banks. Central banks are responsible for monetary policy while governments are responsible for fiscal policy. A good reason why they are separate as the central bank does not take instructions from the government. When it does, chaos can sometimes erupt. The best example for Canada was the Coyne Affair a conflict that developed between the Bank of Canada headed by its governor James Coyne and the Diefenbaker government headed by PM John Diefenbaker and the finance minister Donald Fleming. What was it about? The BofC tightening to bring down inflation vs. a government that wanted to spend and bring down interest rates to spur economic growth. Sound familiar?
Inflation falling wasn’t a real surprise to markets so generally markets have responded positively. Some of the reason inflation is falling is a clearing up of supply disruptions due to the pandemic albeit it’s slow. Wage inflation has not really taken off, yet although strikes have been rising with the most recent one being the UAW strike against the auto companies. The rise of AI could prove to be quite deflationary.
But this is only the officially reported inflation. Shadow Stats www.shadowstats.com continues to report much higher inflation closer to 11% by plotting inflation the way it used to be plotted back in 1980. After that officials moved from calculating inflation on the basis of measuring the cost of living to basing it on the what was needed to maintain a constant cost of living. The latter is somewhat unrealistic but nonetheless what we get is the headline inflation. And that is what the monetary authorities pay attention to.
Nonetheless, with inflation coming down it could help the Fed pause any further rate hikes. The next FOMC is September 19-20 and it is widely expected that the Fed will pause. However, for anyone expecting the Fed to cut that event is a long way off. The same holds true in Canada.
One thing we do note is that the Fed started raising rates in March 2022 just after war broke out between Russia/Ukraine. War is inflationary, however, admittedly it is difficult to connect the two except as to coincidence.
The Fed of course didn’t stop at just raising rates as quantitative tightening (QT) kicked in. Since peaking April 2022 at $8,965.5 billion the Fed’s balance sheet has since fallen some $864 billion. Money supply has also fallen both M1 and M2. The screws get turned in a number of ways.
Fed Assets 2019-2023
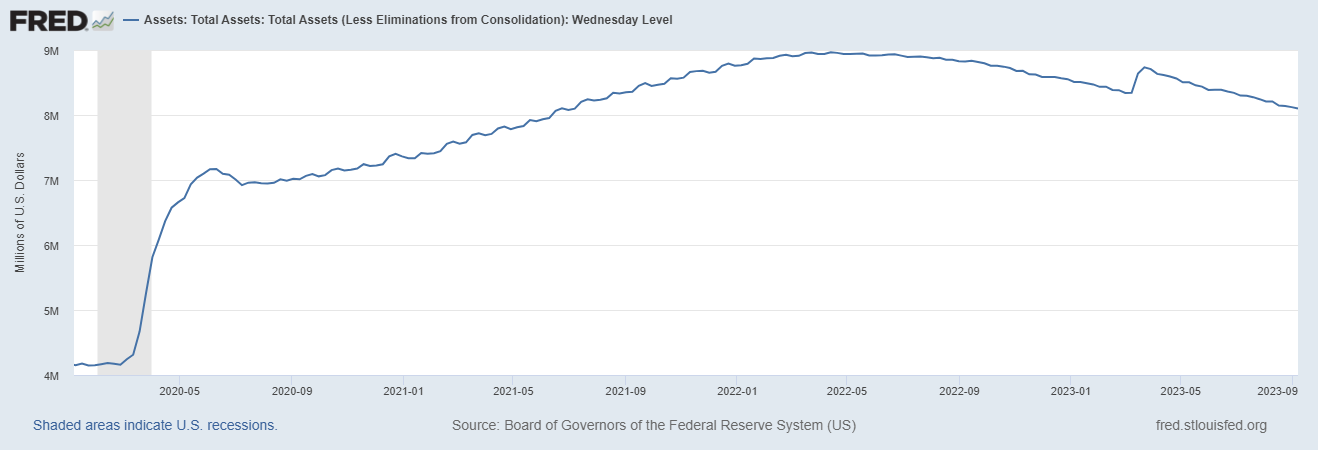
Source: www.stlouisfed.org
Markets & Trends
|
|
|
|
% Gains (Losses) Trends |
|
||||
|
|
Close Dec 31/22 |
Close Sep 15, 2023 |
Week |
YTD |
Daily (Short Term) |
Weekly (Intermediate) |
Monthly (Long Term) |
|
|
Stock Market Indices |
|
|
|
|
|
|
|
|
|
S&P 500 |
3,839.50 |
4,450.32 |
(0.2)% |
15.9% |
down (weak) |
up |
up |
|
|
Dow Jones Industrials |
33,147.25 |
34,618.57 |
0.1% |
4.4% |
down (weak) |
up |
up |
|
|
Dow Jones Transport |
13,391.91 |
15,339.43 |
0.9% |
14.5% |
down |
up |
up |
|
|
NASDAQ |
10,466.48 |
13,708.33 |
(0.4)% |
31.0% |
down (weak) |
up |
up |
|
|
S&P/TSX Composite |
19,384.92 |
20,622.34 |
2.7% |
6.4% |
up |
up |
up |
|
|
S&P/TSX Venture (CDNX) |
570.27 |
590.78 |
1.7% |
3.6% |
down (weak) |
down |
down |
|
|
S&P 600 (small) |
1,157.53 |
1,186.40 |
0.1% |
2.5% |
down |
neutral |
neutral |
|
|
MSCI World |
1,977.74 |
2,121.64 |
1.3% |
7.3% |
neutral |
neutral |
neutral |
|
|
Bitcoin |
16,531.31 |
26,403.48 |
2.1% |
59.7% |
down (weak) |
neutral |
neutral |
|
|
|
|
|
|
|
|
|
|
|
|
Gold Mining Stock Indices |
|
|
|
|
|
|
|
|
|
Gold Bugs Index (HUI) |
229.75 |
229.22 |
4.7% |
(0.2)% |
neutral |
down |
down |
|
|
TSX Gold Index (TGD) |
277.68 |
277.01 |
3.3% |
(0.2)% |
neutral |
down |
down |
|
|
|
|
|
|
|
|
|
|
|
|
% |
|
|
|
|
|
|
|
|
|
U.S. 10-Year Treasury Bond yield |
3.88% |
4.33% |
1.6% |
11.6% |
|
|
|
|
|
Cdn. 10-Year Bond CGB yield |
3.29% |
3.74.% |
2.5% |
13.7% |
|
|
|
|
|
Recession Watch Spreads |
|
|
|
|
|
|
|
|
|
U.S. 2-year 10-year Treasury spread |
(0.55)% |
(0.71)% |
2.7% |
(29.1)% |
|
|
|
|
|
Cdn 2-year 10-year CGB spread |
(0.76)% |
(0.99)% |
flat |
(30.3)% |
|
|
|
|
|
|
|
|
|
|
|
|
|
|
|
Currencies |
|
|
|
|
|
|
|
|
|
US$ Index |
103.27 |
105.34 |
0.3% |
2.0% |
up |
up |
up |
|
|
Canadian $ |
73.92 |
74.07 |
1.1% |
0.2% |
down (weak) |
down (weak) |
down |
|
|
Euro |
107.04 |
106.59 |
(0.4)% |
(0.4)% |
down |
down |
down (weak) |
|
|
Swiss Franc |
108.15 |
111.41 |
(0.5)% |
3.0% |
down |
up (weak) |
up |
|
|
British Pound |
120.96 |
123.82 |
(0.6)% |
2.4% |
down |
neutral |
neutral |
|
|
Japanese Yen |
76.27 |
67.62 |
flat |
(11.3)% |
down |
down |
down |
|
|
|
|
|
|
|
|
|
|
|
|
|
|
|
|
|
|
|
|
|
|
Precious Metals |
|
|
|
|
|
|
|
|
|
Gold |
1,826.20 |
1,946.20 |
0.2% |
6.6% |
down (weak) |
neutral |
up |
|
|
Silver |
24.04 |
23.39 |
1.0% |
(2.7)% |
down (weak) |
neutral |
neutral |
|
|
Platinum |
1,082.90 |
929.50 |
3.9% |
(14.2)% |
neutral |
down |
down |
|
|
|
|
|
|
|
|
|
|
|
|
Base Metals |
|
|
|
|
|
|
|
|
|
Palladium |
1,798.00 |
1,252.70 |
5.1% |
(30.3)% |
neutral |
down |
down |
|
|
Copper |
3.81 |
3.80 |
2.2% |
(0.3)% |
neutral |
down |
neutral |
|
|
|
|
|
|
|
|
|
|
|
|
Energy |
|
|
|
|
|
|
|
|
|
WTI Oil |
80.26 |
90.02 |
2.9% |
12.2% |
up |
up |
up |
|
|
Nat Gas |
4.48 |
2.64 |
1.3% |
(41.1)% |
neutral |
down (weak) |
down |
|
Source: www.stockcharts.com
Note: For an explanation of the trends, see the glossary at the end of this article.
New highs/lows refer to new 52-week highs/lows and, in some cases, all-time highs.
Source: www.stockcharts.com
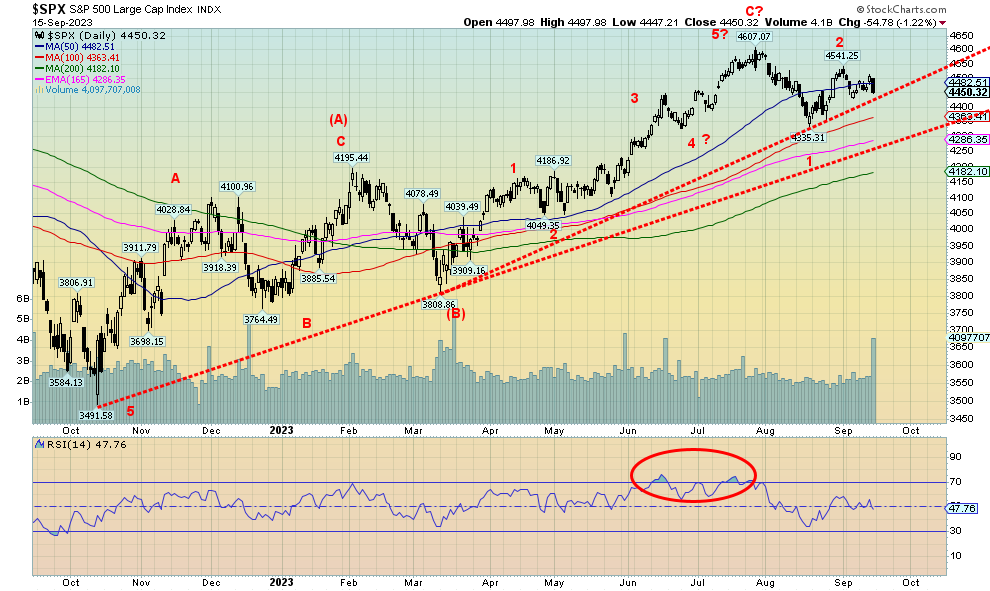
Do you love the volatility? On Thursday the S&P 500 jumped almost 38 points. On Friday the S&P 500 fell 55 points. On Thursday we thought we were breaking out to the upside. On Friday our thoughts that the market is headed down was confirmed. It was interesting that all this occurred around the 50-day MA. Now our uptrend line below 4,450 looms. If that breaks and then we break under 4,400 we’ll know we are headed lower. Final support lies around 4,350 and finally the 200-day MA at 4,180. Not that we haven’t dipped under the 200-day MA before. We did that in March as we were rising and the market turned around and rose further. All this is happening as we await the Fed on Wednesday.
On the week the S&P 500 and the NASDAQ both fell for the second week in a row. SPX lost about 0.2% while the NASDAQ was off 0.4%. Technology fell as the NY FANG Index was down just over 0.9%. The Dow Jones Industrials (DJI) held in gaining 0.1% while the Dow Jones Transportations (DJT) surprised up 0.9% despite higher oil prices. The S&P 400 (Mid) fell 0.3% but the S&P 600 (Small) gained just under 0.1%. The S&P 500 Equal Weight was off 0.1%. Yes, the drop didn’t seem like much (we’ve seen far worse – think March 2020) but when put in the context of a sharp gain on Thursday followed by a sharp loss on Friday it was not a good week. Volume also picked up on the Friday. Not a good sign.
In Canada the TSX Composite rose 2.7% thanks to some strong performances from Materials and Banks. The TSX Venture Exchange (CDNX) also gained up 1.7%. In the EU performance was good. The London FTSE rose 3.6%, the Paris CAC 40 was up 2.8%, the German DAX gained 1% while the EuroNext was up 1.4%. Asia saw China’s Shanghai Index (SSEC) flat, the Tokyo Nikkei Dow gained 2.8% but Hong Kong’s Hang Seng (HSI) lost 0.1%.
The verdict on the week is that we are seeing a rise in volatility and the trend is shifting to the downside. The short-term trends are pointed down although the weekly trend is up but is fading. Support lines loom below and if they break, they could confirm the breakdown that appears to be going on. High volume on a down day was not a good sign.
Source: www.stockcharts.com
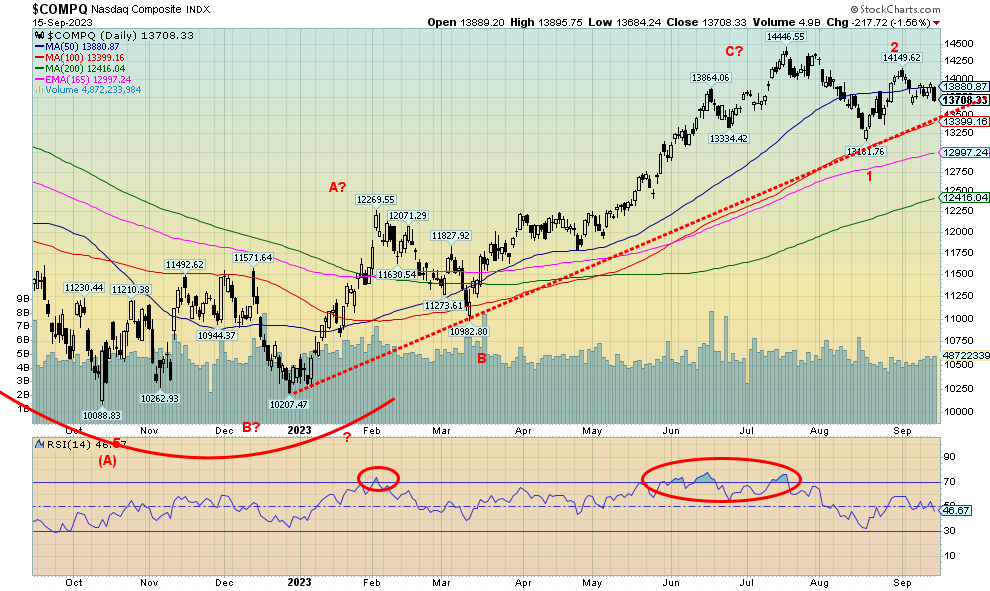
The NASDAQ also had a volatile week losing 0.4% thanks to weakness with the technology stocks. But even they were mixed and volatile. Netflix was clobbered losing 10.4% but Tesla leaped 10.4%. Google made new all-time highs gaining 0.8%. Most other FAANGS closed down. The NASDAQ fell back under its 50-day MA and the uptrend line from December looms below at 13,400. If that breaks, we could soon be looking at the 200-day MA near 12,425. We could stay alive if we make new highs above 14,149 the recent high. But that high was lower than the July high of 14,446. In that respect we appear to be forming a downtrend. We just await confirmation.
Source: www.stockcharts.com
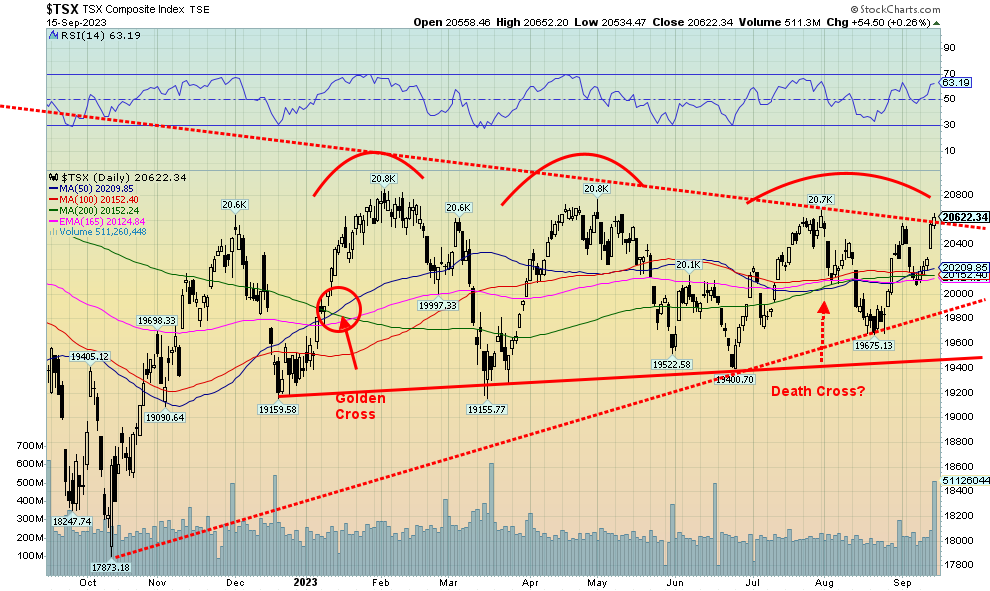
Is the TSX poised to breakout? We did penetrate that down line on Friday but it’s only one day. The TSX gained 0.3% on Friday despite the U.S. markets falling sharply. The rise occurred on good volume. The rise was primarily thanks mostly to the materials (golds, metals etc.) and financials. On the week the TSX Composite rose a healthy 2.7%. The TSX Venture Exchange (CDNX) was up 1.7%. Only one sub-index, Health Care (THC) was down on the week. THC lost 0.7%. The big winner was Metals & Mining (TGM) up 4.8%. Financials (TFS) the largest component rose 3.7%. Income Trusts (TCM) were up 3.1%, Golds (TGD) up 3.3%, Industrials (TIN) 3.1%, Materials (TMT) up 3.7%, and, Utilities (TUT) up 3.3%. The remainder were also up but all under 3% gains. The gain on Friday was an extension of the sharp gain on Thursday. The TSX did it but the U.S. indices fell sharply. A divergence? Key now will be follow through on Monday. Note how volume really picked up at the end of the week. That’s a big positive. Given all the highs in the same zone over the past year we began to wonder if we would fail and instead of breaking out, we’d fall. The breakdown zone remains at 19,800 and again at 19,400. We still haven’t made new highs above 20,800 so that is a must if we are going higher. Our death cross just seen a few weeks ago is becoming a golden cross as the 50-day is now above 200-day once again. A whipsaw I’m sure many will appreciate. Key now is we follow through to the upside and soon see new highs above 20,800.
U.S. 10-year Treasury Bond/Canadian 10-year Government Bond (CGB)
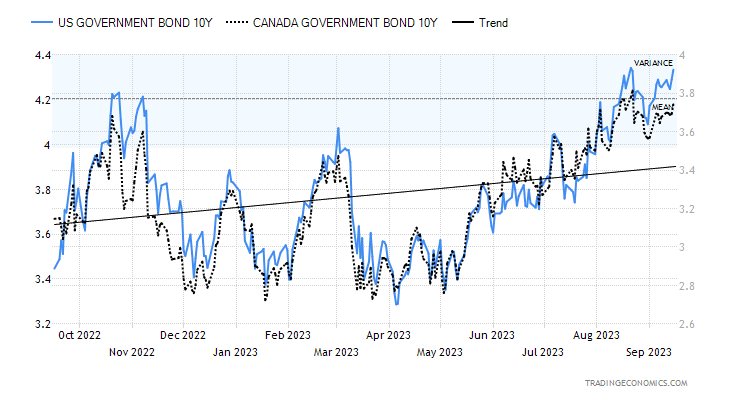
Source: www.tradingeconomics.com, www.home.treasury.gov, www.bankofcanada.ca
Bond yields keep rising. And if bond yields are rising the odds of rates coming down any time soon are lessened. Not that we would expect rates to come down. The FOMC meets next week and the expectation is that there will no rate hike. Instead, we will watch the guidance. The U.S. 10-year treasury note rose to 4.33% this past week up from 4.26%. The Canadian 10-year Government of Canada bond (CGB) rose to 3.74% from 3.65%. As to our 2-10 spread the U.S. 2-10 fell slightly to negative 71 bp from negative 73 bp while the Canadian 2-10 was unchanged at negative 99 bp. The big economic number on the week was the CPI which we discussed under Chart of the Week. The PPI was reported y-o-y up 1.6% above expectations but still down sharply from its high of 8.5% a year ago. Retail sales were below expectations but still positive. We are not sure how much higher gasoline prices played. Initial jobless claims were largely as expected at 220,000. The NY Empire State Manufacturing Index was 1.9 when they were expecting negative 8. Industrial production y-o-y was up 0.2% above the expected negative 0.5%. The Michigan Consumer Sentiment Index, however, came in below expectations at 67.7 when they expected 70. The Michigan index remains not far off its lows and levels seen 40 years ago during the early 1980’s recession. This coming week besides the FOMC we do get housing starts in both Canada and the U.S. Watch in particular Canada’s housing starts out on Monday. Canada also reports its inflation numbers on Tuesday. And here inflation has been coming down but we don’t know how the recent rise in gasoline prices will impact the CPI. The big one, however, is the FOMC interest rate decision on Wednesday followed by the press conference.
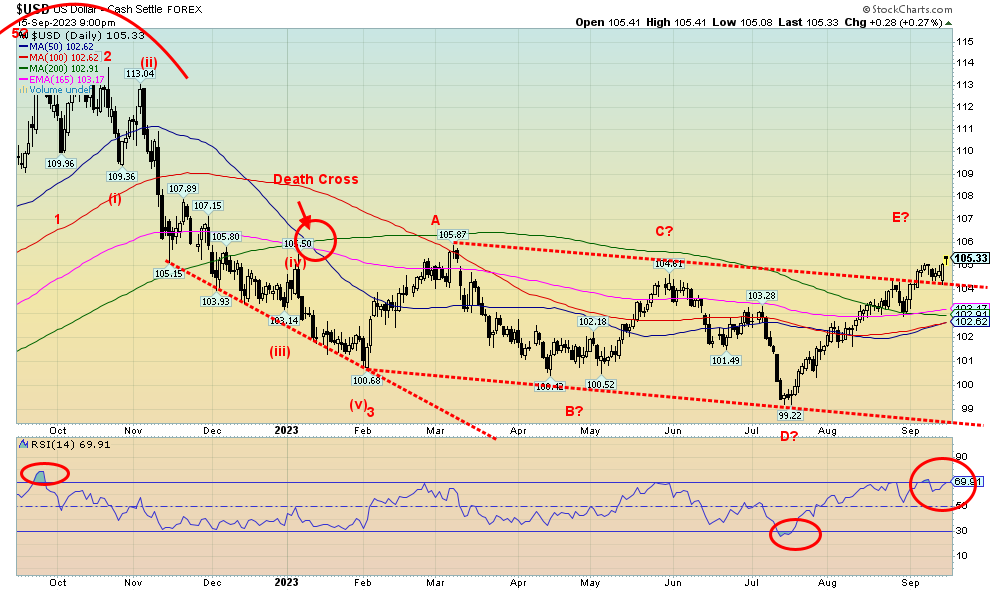
Source: www.stockcharts.com
Once again, the US$ Index made new highs for the current up move. We are also breaking out over that trend line from the March high of 105.87. If that channel breakout is true then we do have the potential to rise further with targets up to 110/111. Gold bugs would not want to see that. On the week the US$ Index gained 0.3%. The currencies fell with the euro down 0.4%, the Swiss franc off 0.5%, the pound sterling dropping 0.6%. The Japanese yen was spared as it was mostly flat. And the Canadian dollar was a star, thanks to higher oil prices, gaining 1.1%. Canada gaining helped keep the gain on the US$ Index down. We are getting overbought with the RSI at 70 diverging small with an earlier high. Reality, however, is that we first need to see the US$ Index fall back under 104 then we need to breakdown under 102. We are getting close to a golden cross as well with the 50-day MA at 102.62 and the 200-day MA at 102.91. That to a number of technicians would be another bullish sign.
Source: www.stockcharts.com
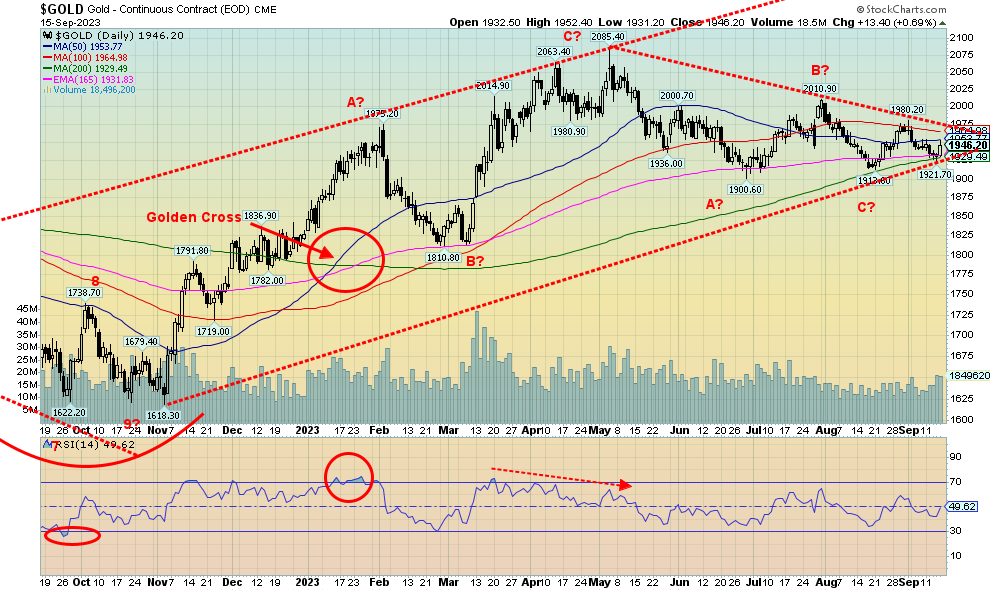
All thing’s considered gold is holding up remarkably well despite depressed silver prices and depressed gold stock prices. We keep banging on the door of $2,089 the high seen in August 2020. As well we are holding near those highs and up from the November 2022 low of $1,618. On the week gold was up 0.2%. Remarkable in the face of a strong US$ Index that broke out over 105 this past week. Gold has previously made new highs in other currencies. However, gold in Japanese yen is the winner making fresh all-time highs on September 5.
Besides gold gaining 0.2% this past week silver was up about 1.0% and platinum rose 3.9% rebounding from the sharp down previous week. For the near precious metals, palladium rose 5.1% and copper was up 2.2%. Only gold, however, is up in 2023 with a gain of 6.6%. All other metals remain negative on the year. The gold stock indices did rebound nicely with the Gold Bugs Index (HUI) up 4.7% and the TSX Gold Index (TGD) gaining 3.3%. The indices and by extension the gold stocks, however, remain depressed. The junior gold miners even more so.
Gold may be focusing on next week’s FOMC where the Fed is expected to hold rates steady. Everyone, however, will be focusing on the guidance. Gold also may be experiencing some safe haven buying. The strike at the auto plants has potential negative ramifications for the U.S. economy if it stretches. Asian gold premiums also widened this past week a reflection of a pick-up in demand. The gold buying, particularly in China, has been to help prop up the weak yuan. Demand has remained good in both India and Japan as well.
Key going forward, however, is the U.S. dollar. The dollar has been strong and a strong dollar is not good for foreign issuers of debt denominated in U.S. dollars. The debt becomes much more expensive as the home currency depreciates. We have expressed concern about defaults particularly the shadow banking system in China and elsewhere in Asia. In the U.S. it didn’t help that we got okay retail sales, industrial production and the NY Empire Manufacturing Index. However, consumer confidence faltered.
Gold needs to regain $1,950 to even think about the $1,980/$2,000 resistance zone. If we do break $2,000 that would be a big positive and could then set an attempt on $2,050. We are still fighting our long term down cycles. We will only know the cycle low is in if we make new all-time highs above $2,100. Until then the bear prowls. But we are encouraged by gold holding up despite the strong U.S. dollar.
Source: www.stockcharts.com
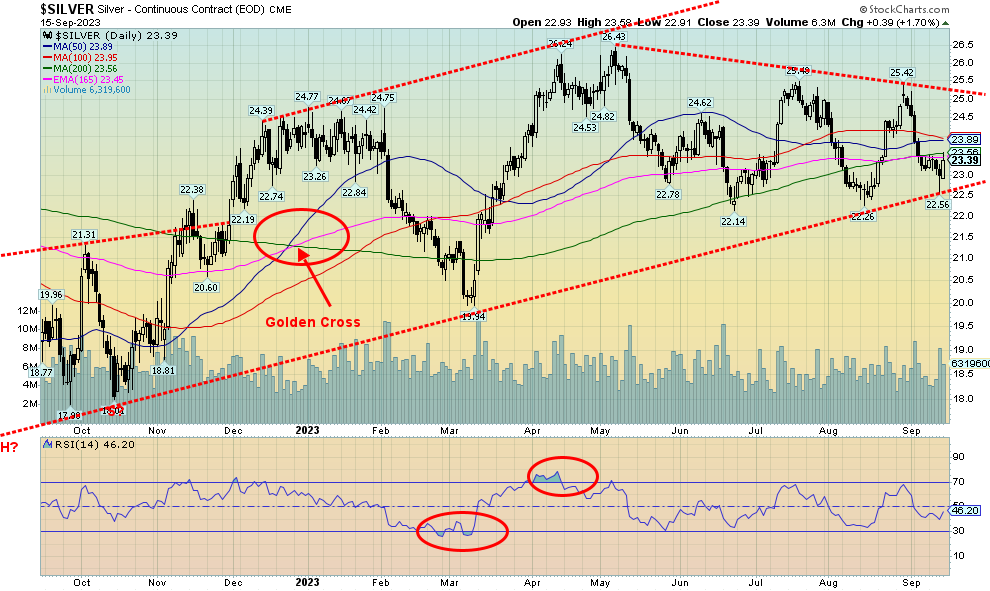
Silver managed a gain of about 1% this past week despite being down at one point. With the low at $22.56 we appeared to bounce off that trend line that comes up from a September 2022 low. $22.50 was a key support zone that if broken, silver could have fallen to $22 or lower. While Friday’s rebound was good it doesn’t end the potential bearishness for silver. The current decline did not see silver’s RSI dip under 30. Result that could mean more bearishness ahead. We really need to take out $24 to convince we could go higher. Further resistance is up at $25 but above that new highs above the May high of $26.43 become possible. Thursday’s rebound off the low left a possible bottom pattern. But confirmation won’t come until we exceed $24. There are those that expect silver demand to soften in 2023 mostly due to less investment demand. The bearishness of silver over the past two years has left a lot of investors discouraged. We last peaked at $30.35 back in February 2021. The most encouraging sign we see is a potential head and shoulders bottoming pattern forming with the head at the $17.40 low in September. Result that is why breaking above $25 is so important because of the pattern is correct the potential target is $35. First, however, $22.50 must continue to hold.
Source: www.stockcharts.com
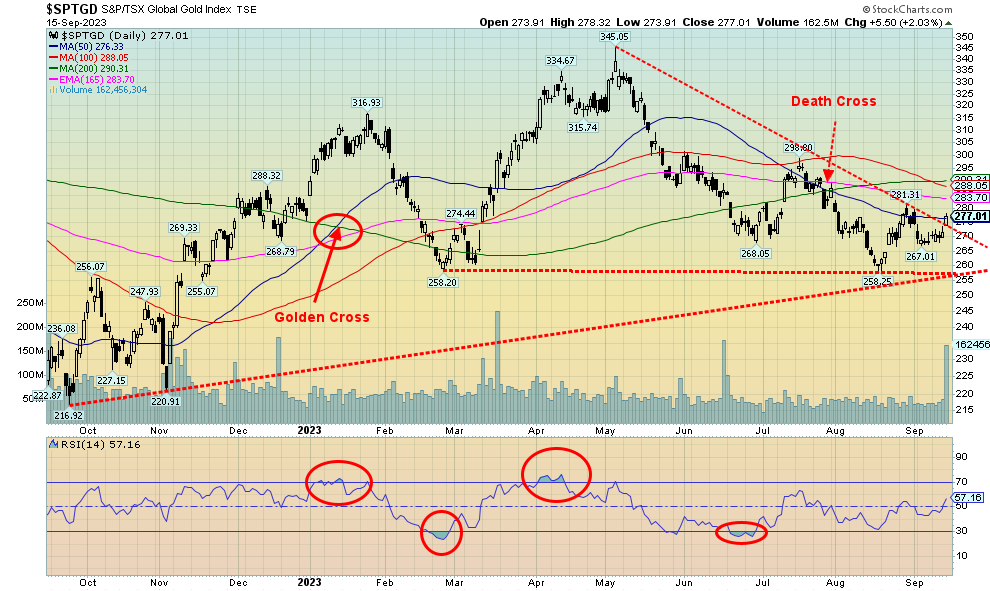
The gold stocks may be preparing for a breakout. This past week we broke the downtrend line from the May high but that doesn’t confirm a firm breakout just yet. We still have to get above 300 to confirm any breakout. The TSX Gold Index (TGD) was up 3.3% this past week while the Gold Bugs Index (HUI) rose 4.7%. The TGD turned up not putting any new low in. Once above 282 our target becomes 305. The negative hanging around was that death cross seen in July. We also fell under all the moving averages. Nonetheless, we need to get above 300 to suggest that we may have made a low. Sentiment remains low with the Gold Miners Bullish Percent Index (BPGDM) still at 14. Not rock bottom but definitely low. The overall pattern, however, remains bothersome, possibly bearish with what looks to us like a potential head and shoulders top. The left shoulder topped at 316 in January, the head at 345 in May and the right shoulder at 298 in July. Therefore, why it is important to take out 300 as it could bust the pattern. If it really is a H&S pattern than a breakdown under 255 could target around 170.
Source: www.stockcharts.com
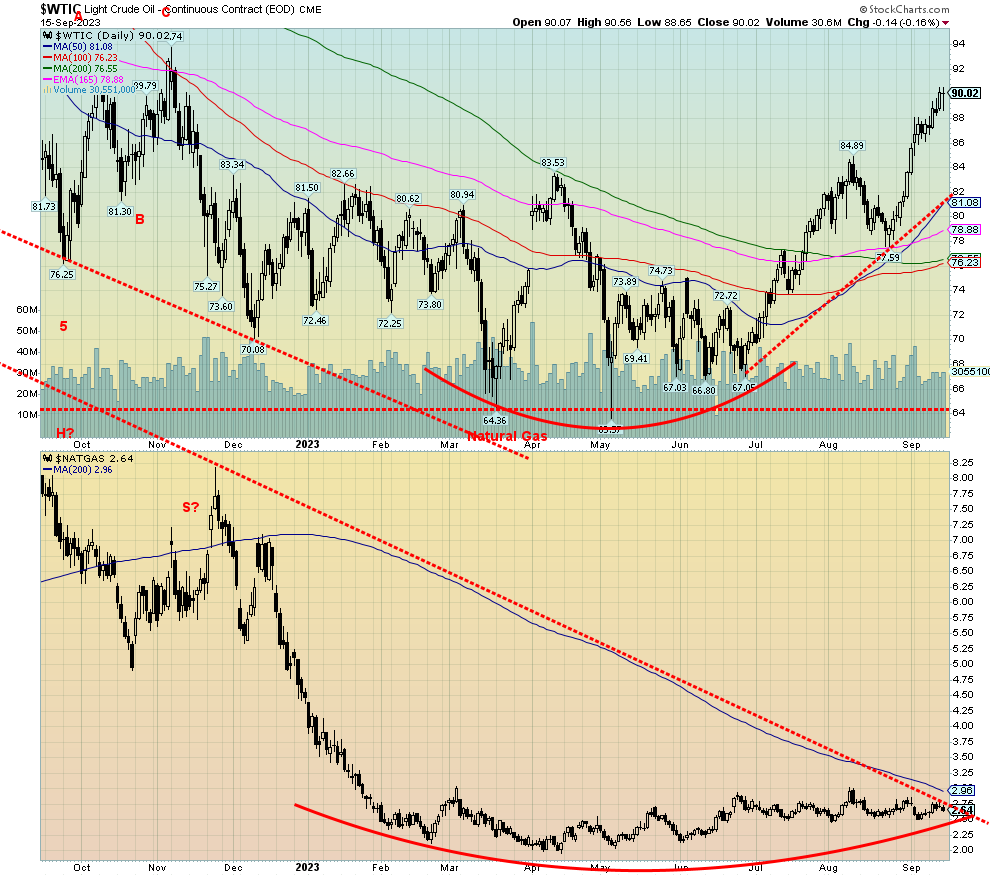
Oil prices keep rising. WTI is now up roughly $27 from its low last May. On the week WTI gained 2.9% while Brent crude rose 4.2%. Tightened supply because of extended cuts from Saudi Arabia and Russia and heightened demand particularly from China as some economic numbers this past week, including retail sales and manufacturing output were better than expected. The market is overextended with the RSI above 70 but that doesn’t mean we are topping out. We were looking for at least $90 and we have now passed that level. We have further targets at $93 and $95. Irrespective, we wouldn’t be surprised to see a pullback to work off some of the excess.
Natural gas (NG) is still struggling to break out but did gain 1.3% at the Henry Hub. The EU Dutch Hub did better up 5.7%. Some strikes in Australia plus some heightened demand particularly in Asia as some are trying to stock up for the winter. There were some supply disruptions as well.
Energy stocks were sluggish particularly on Friday when they pulled back sharply. Profit taking? Or just the general market malaise on Friday? The ARCA Oil & Gas Index (XOI) rose only 0.1% while the TSX Energy Index (TEN) was up 0.5%.
We may be overextended but that doesn’t necessarily mean we’ll pull back but a pullback would be positive to ease some of the overbought conditions. Expectations are, however, that we are headed higher eventually to $100 and some calling for $120. Support is now down to $86 and $84 below that.
On a separate note, we see uranium has broken above $60. Still in front is the April 2022 high of $64.50, however, uranium is above the weekly high close seen in March 2022. Uranium stocks have been some of the best performers of late.
GLOSSARY
Trends
Daily – Short-term trend (For swing traders)
Weekly – Intermediate-term trend (For long-term trend followers)
Monthly – Long-term secular trend (For long-term trend followers)
Up – The trend is up.
Down – The trend is down
Neutral – Indicators are mostly neutral. A trend change might be in the offing.
Weak – The trend is still up or down but it is weakening. It is also a sign that the trend might change.
Topping – Indicators are suggesting that while the trend remains up there are considerable signs that suggest that the market is topping.
Bottoming – Indicators are suggesting that while the trend is down there are considerable signs that suggest that the market is bottoming.
Disclaimer
David Chapman is not a registered advisory service and is not an exempt market dealer (EMD) nor a licensed financial advisor. He does not and cannot give individualised market advice. David Chapman has worked in the financial industry for over 40 years including large financial corporations, banks, and investment dealers. The information in this newsletter is intended only for informational and educational purposes. It should not be construed as an offer, a solicitation of an offer or sale of any security. Every effort is made to provide accurate and complete information. However, we cannot guarantee that there will be no errors. We make no claims, promises or guarantees about the accuracy, completeness, or adequacy of the contents of this commentary and expressly disclaim liability for errors and omissions in the contents of this commentary. David Chapman will always use his best efforts to ensure the accuracy and timeliness of all information. The reader assumes all risk when trading in securities and David Chapman advises consulting a licensed professional financial advisor or portfolio manager such as Enriched Investing Incorporated before proceeding with any trade or idea presented in this newsletter. David Chapman may own shares in companies mentioned in this newsletter. Before making an investment, prospective investors should review each security’s offering documents which summarize the objectives, fees, expenses and associated risks. David Chapman shares his ideas and opinions for informational and educational purposes only and expects the reader to perform due diligence before considering a position in any security. That includes consulting with your own licensed professional financial advisor such as Enriched Investing Incorporated. Performance is not guaranteed, values change frequently, and past performance may not be repeated.
About the author


Website: https://www.enrichedinvesting.com
Disclaimer: David Chapman is not a registered advisory service and is not an exempt market dealer (EMD) nor a licensed financial advisor. We do not and cannot give individualised market advice. David Chapman has worked in the financial industry for over 40 years including large financial corporations, banks, and investment dealers. The information in this newsletter is intended only for informational and educational purposes. It should not be considered a solicitation of an offer or sale of any security. The reader assumes all risk when trading in securities and David Chapman advises consulting a licensed professional financial advisor before proceeding with any trade or idea presented in this newsletter. David Chapman may own shares in companies mentioned in this newsletter. We share our ideas and opinions for informational and educational purposes only and expect the reader to perform due diligence before considering a position in any security. That includes consulting with your own licensed professional financial advisor.