
“To waste, to destroy our natural resources, to skin and exhaust the land instead of using it so as to increase its usefulness, will result in undermining in the days of our children the very prosperity which we ought by right to hand down to them amplified and developed.”
—Theodore Roosevelt, American politician, statesman, conservationist, naturalist, historian, 26th president of the U.S. 1901–1909, vice president 1901, 33rd governor of New York 1899–1900, leader of progressive policies and anti-trust; 1858–1919
“The most important thing about global warming is this. Whether humans are responsible for the bulk of climate change is going to be left to the scientists, but it’s all of our responsibility to leave this planet in better shape for the future generations than we found it.”
—Mike Huckabee, American politician, Baptist minister, political commentator and bassist, 44th governor of Arkansas 1996–2007, Republican party candidate for president 2008 and 2016; b. 1955
“Saving our planet, lifting people out of poverty, advancing economic growth… these are one and the same fight. We must connect the dots between climate change, water scarcity, energy shortages, global health, food security and women’s empowerment. Solutions to one problem must be solutions for all.”
—Ban Ki-moon, South Korean politician, 8th Secretary-General of the United Nations 2007–2016, career diplomat South Korea’s Ministry of Foreign Affairs, 31st Minister of Foreign Affairs 2004–2006; b. 1944
COP26
We suppose we could call it quite a week. The FOMC meeting, the Bank of England (BOE) too, even the Reserve Bank of Australia (RBA), the jobs report, an OPEC meeting, and the 26th UN Climate Change Conference of the Parties, aka COP26. Where to start? We’ll cover the FOMC, the jobs report, and OPEC elsewhere. So that really leaves COP26.
Oh yes, COP26, where the ink hasn’t even dried on the signed agreement and they are already pushing back to slow or stop its goals, despite the pleading of the climate activists led by Greta Thunberg. Are they going to shut down the coal plants if it means also turning off the lights? Not China. Not the U.S. But what is one to do when the world’s largest emitters of greenhouse gasses are China, the U.S., India, Russia, and collectively the European Union (EU)? On a per capita basis, the highest emitters are the U.S. and Russia. Collectively, the five account for far in excess of half the world’s emissions. China, the U.S., and the EU together contribute 41.5% of total global emissions while the bottom 100 countries account for only 3.6%, according to the World’s Resources Institute (www.wri.org).
China and Russia didn’t even bother to send their leaders to COP26. However, they did promise to help end deforestation by 2030. But even meeting deforestation goals will prove to be problematic. Over 60% of the world’s forests are in eight countries: Russia, Brazil, Canada, U.S., China, Australia, Democratic Republic of Congo, and Indonesia. Indonesia is already declaring they will back out of their deforestation obligations. India says they might meet their climate goals—by 2070. China, 2050. Despite commitments from many world leaders including President Biden of the U.S., his odds of getting plans through Congress and the Senate are at best facing a very tough slog and at worst doomed to failure. In Canada, ambitious plans from Prime Minister Trudeau are already under attack. However, he has a majority working with the NDP party and a cap on emissions is most likely coming. Surprisingly, this is supported by the big oil companies.
So, what is the world going to do? The energy sector is the biggest contributor. They represented 73% of all global emissions back in 2017. Maybe even higher today. The Paris Climate Accord was signed in April 2016. The U.S., an original signatory, pulled out of the Paris Accord when President Donald Trump came to power and called climate change a hoax. Many claim that and point to periods when the earth was a lot hotter than it is today. Except there weren’t 7.8 billion people living on the planet millions of years ago when the earth’s temperatures were sharply higher. Palm trees at the North Pole? Yes, 53.5 million years ago.
The worst effects of climate change are being felt today in Africa, Latin America, and South Asia with severe droughts, flooding, flash storms, and more. Can anyone seriously live-in 50⁰C weather? Yet it is becoming a regular occurrence in many parts of the world. Severe weather and droughts are a prime driving force behind the millions of refugees trying to escape their countries and migrate either to large urban cities or north to North America and Europe. Some project that by 2050 there could be upwards of one billion climate refugees.
Already there is an estimated 800 million to one billion people feeling the effects of climate change because of rising sea levels, increased frequency of natural disasters, prolonged droughts, and irregular weather patterns. The vast majority impacted are from developing countries which in turn generates climate refugees fleeing the problem. The world, particularly the developed world is ill-equipped to deal with that, giving rise to the desire to stop the flow of refugees from even entering the country. On the other hand, the warming of the Arctic seas has opened up possibilities that didn’t exist before because of ice free winters. One is that the North West and Eastern passages allow ships to reach their destinations faster than going the long routes through the Suez or Panama canals.
It is interesting to note that in April 2016 at the time of the Paris accords, WTI oil closed at $45.99, Brent crude at $47.40, natural gas (NG) at $2.14, and coal traded at $50.65/metric tonne. Fast-forward to today and WTI oil is $81.27 (high was $85.41), Brent $82.55 (high $86.10), NG at $5.52 (high $6.47), and coal $154.75 (high $240). OPEC cut production during the pandemic and has been slow to bring supplies back up, agreeing only to a limited increase, currently 400,000 bpd monthly. There have been supply chain disruptions. The EU and Russia are at loggerheads over energy. High energy prices are making it difficult to justify environmental regulations and carbon taxes. Some countries have brought back coal plants to meet energy demand as high prices, particularly for NG, have made things quite expensive. Voters in the Western democracies are in favour of meeting climate goals—as long as someone else pays for it. The wealthy nations want poorer countries to transition to clean energy. Except millions in developing countries have no power to start with.
The claim is that climate change is an “existential threat to human existence as we know it.” Well, maybe, maybe not. But it is becoming a chronic problem and there is a need to manage it properly. And it could spark conflicts. According to the original Paris Agreement 2015, the planet is on track to warm 2.7 degrees by 2100 if all kept their promises. That is still well above the 1.5 degrees agreed to in principle in Paris. Rising to that level could result in more severe droughts, storms, flooding, rising sea levels, and wildfires. Yes, all of these things happen and they have happed before. It is estimated that since the start of the industrial age (roughly 1750) the earth has warmed over 1 degree Celsius. Most of that has occurred since 1975. There is an old saying about bankruptcy—first it is gradual, then sudden. The impacts of climate change are cumulative. As more problems crop up it causes a snowball effect that in turn generates more problems. Gradually, then suddenly.
The effects of climate change are seen in rising sea levels, more frequent and severe weather extremes, loss of biodiversity, and increased risks of disease (pandemics?). Climate change impacts everything: humans, plants, and animals (mammals, fish, birds, reptiles and amphibians and even arthropods, invertebrates and vertebrates).
Earth’s climate has never been stable. There have been at least seven recorded ice-age cycles, the last one ending roughly 11,000 years ago. There was what was known as the Little Ice Age from 1200–1850 AD. Precipitous changes in climate have negatively impacted civilizations in the past. Without going into details, these stand out: Mesoamerica - Mayan civilization (circa 2000 BC–1700 AD, although the peak was around 900 AD), Mesopotamia – the Akkadian Empire (2334–2154 BC), and the Khmer empire in South Asia (802–1431 AD). Even the Viking civilizations (793–1066 AD) of Greenland and the North Atlantic disappeared or were drastically altered because of climate change. The Mayan, Akkadian, and Khmer civilizations collapsed because of prolonged severe droughts, with severe monsoons adding to the woes of the Khmers while the Viking civilization in the Americas ended with the regions becoming too cold, making growing crops and raising livestock extremely difficult. All of these occurred during periods when the earth’s population was not 7.8 billion as it is today.
Dealing with climate change will be expensive. The cost is expected to be at least $140 to $300 billion annually until 2030 and then $280 to $500 billion annually until 2050, according to the U.N. Environment Programme. However, the costs of doing nothing could be even higher and most economists can’t even come up with a number as it is difficult to estimate how much climate change will cost if we fail to take serious steps. According to the Intergovernmental Panel on Climate Change (IPCC), the cost of doing nothing exceeds the cost of doing something, probably in the trillions of dollars.
All of this shifts our focus to investing in renewables, as renewables should benefit from a shift to a clean energy economy. There is also a growing focus on Environmental, Social and Governance (ESG) investing. No, that does not mean that coal plants and the use of fossil fuels are going to end tomorrow, to be replaced by windmills, solar panels, and electric cars. Renewables are much more than that. It is probably no surprise that interest in renewables has perked up in the past several weeks. There are indices for renewables: the S&P Global Clean Energy Index and the S&P/TSX Renewable Energy and Clean Technology Index (TXCT). StockCharts (www.stockcharts.com) did not have charts on these indices so these came from SP Global (www.spglobal.com). Note that in Canada the clean energy index has outperformed the TSX over a 10-year period, whereas in the U.S. the global clean energy index has underperformed the S&P 500.
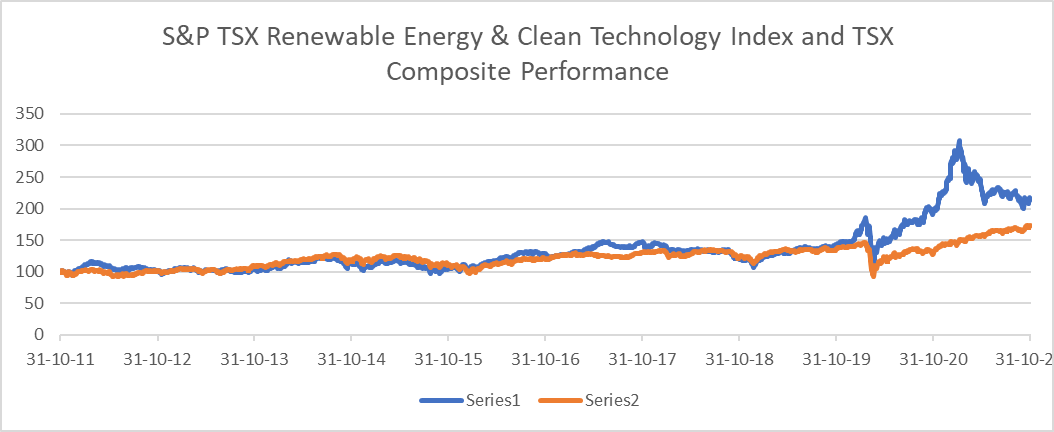
Source: www.spglobal.com
Series1 – S&P TSX Renewable Energy & Clean Technology Index – 10-year return – 212.7%
Series2 – TSX Composite – 10-year return – 173.7%
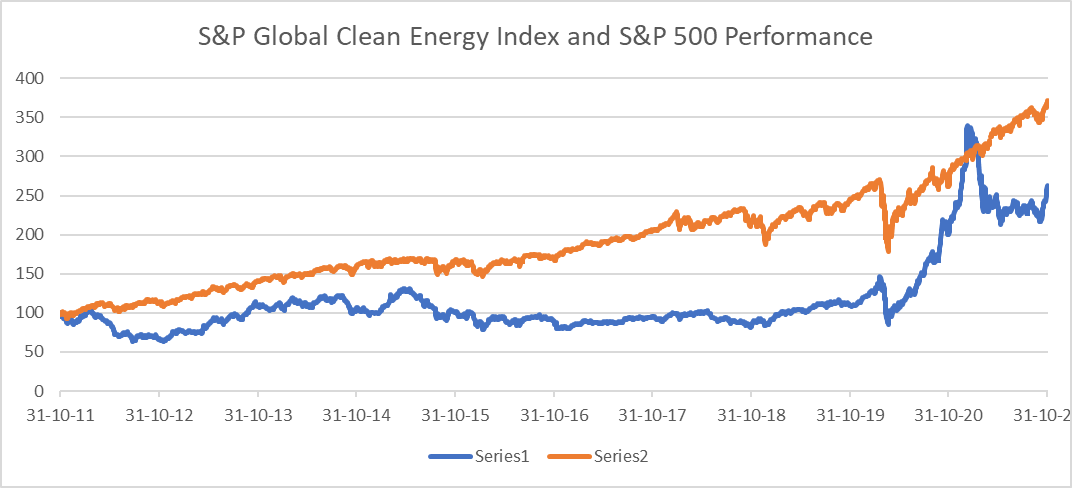
Source: www.spglobal.com
Series1 – S&P Global Clean Energy Index – 10-year return – 257.9%
Series2 – S&P 500 – 10-year return – 367.5%
A better and more useful focus would be on two ETFs available here in Canada and one in the U.S. as a proxy for the indices. Below are the charts of iShares Global Clean Energy ETF (ICLN/NASDAQ) and Harvest Clean Energy ETF (HCLN/TSX). ICLN has been around since 2008 but HCLN has only been around since January 2021. But what both clearly show is that they have broken out of what could be construed as a possible head and shoulders bottom pattern. For ICLN that projects up to around $29 as a minimum and for HCLN that projects up to around $19.50/$20.00. ICLN does pay a small dividend equivalent to about 0.55%.
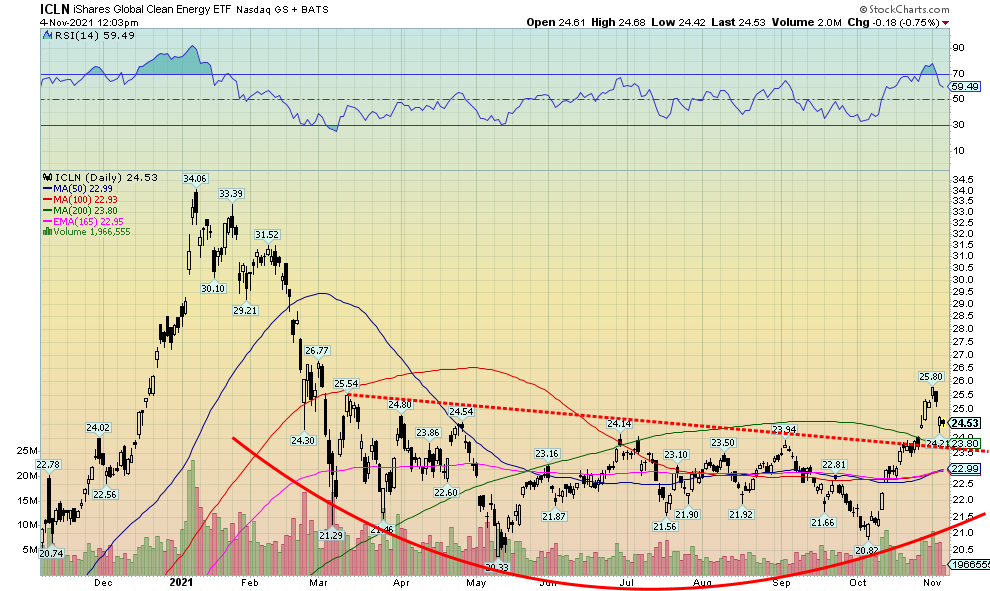
Source: www.stockcharts.com
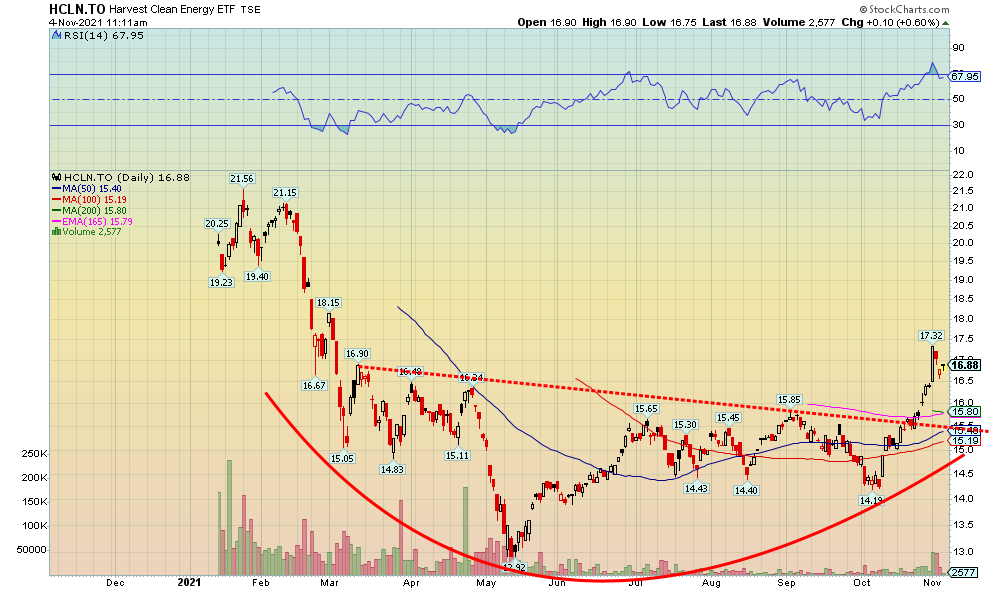
Source: www.stockcharts.com
Besides these ETFs renewables breaking out, we also note a number of car companies that are focusing on manufacturing electric cars are also breaking out. Tesla, a leader, hit new all-time highs again this week. That one never seems to stop going up. But we also note that Ford (F) and Ferrari (RACE) have broken to the upside. Others are showing bullish signs. Investors may also wish to look at cobalt, lithium, and rare earth stocks as their resources are needed for the renewable energy industry.
Could the renewables go into a bubble? Yes. Manias are the stuff of legends. As we note later, the major indices are showing signs of breaking out to the upside just as they did in 1999. And small cap stocks are showing signs of outperforming large cap stocks.
COP26 may run into all sorts of problems in instituting its goals. However, investors may be the biggest beneficiaries.
The Taper
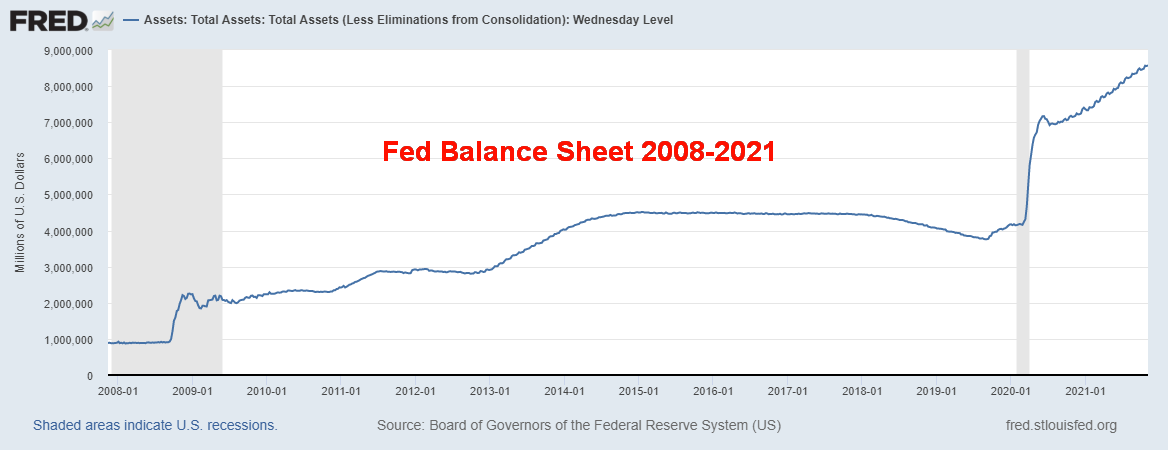
Source: www.stlouisfed.org
As expected, the Fed announced that they will start to taper in November at the rate of $15 billion/month. Currently, the Fed is purchasing $120 billion/month consisting of $80 billion/month of U.S. treasuries and $40 billion/month of mortgage-backed securities (MBS). At that rate, tapering (aka the end of QE), will cease in June 2022. Still, the Fed will add at least another $500 billion to its balance sheet as the purchases don’t end, they just wind down. We expect we will see the taper offset with a more or less commensurate decrease in the daily reverse repo purchases that hit a peak of $1.6 trillion on September 30, 2021. Of late the Fed is still doing $1.3 trillion daily but the amount is starting to fall. We’ll continue to monitor.
The current Fed rate is 0–0.25% and that is not expected to change. In questioning, Fed Governor Jerome Powell pushed back on any thoughts of rate hikes. They acknowledge that inflation is currently above the Fed’s targets but reiterate it is too soon to act on that as supply disruptions may ease, which would also help ease inflation. In that respect the Fed was dovish.
However, the market seems to think that the Fed will start to hike interest rates once they are done with tapering. As a result, what we are seeing is that the back end of the yield curve is falling while the front end of the yield curve is rising. Even that is dovish as it pushed back rate hikes even as the front end steepened. Initial reaction of the U.S. dollar was down and risk on for equities.
But before everyone gets too excited, recall that consumer sentiment has not exactly been robust, trolling along at lows last seen in 2012 when the U.S. was actually improving. Secondly, while they reported 2% growth for Q3 the gain was seen almost exclusively in inventories. Where are the sales? Third, in the U.S. the real merchandise trade deficit for September was a record $80.9 billion. Exports fell while imports leaped to an all-time high. Computers and electronics helped drive imports higher while crude, petroleum products, and semiconductors were amongst the exports that fell.
Separately, the Bank of England (BOE) announced no change in interest rates or tapering. That caught the markets by surprise. The pound fell as a result.
U.S. Balance of Trade and U.S. Imports 1950–2021 (billions of dollars)
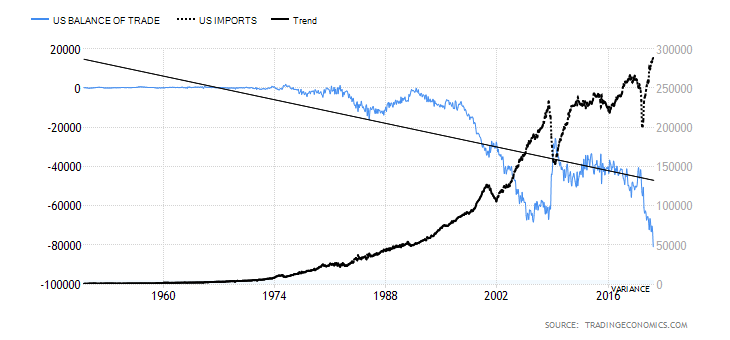
Source: www.tradingeconomics.com, www.bea.gov, www.census.gov
Long End of Yield Curve
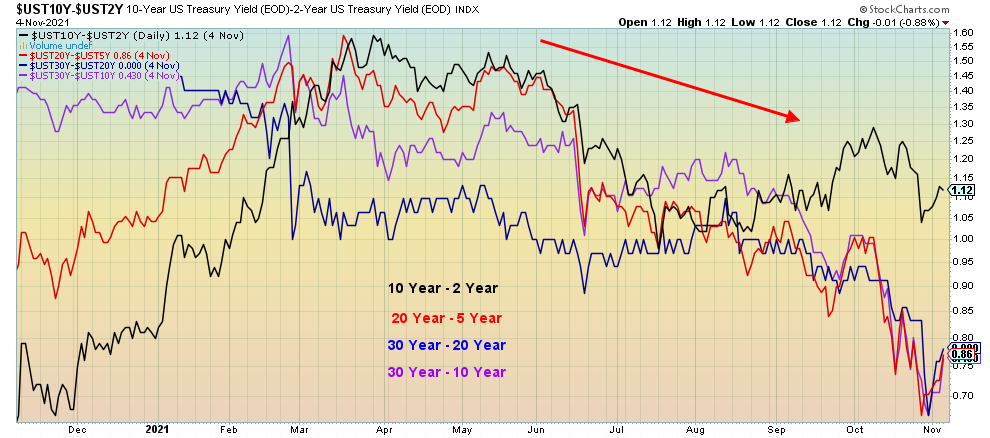
Source: www.stockcharts.com
Short End of Yield Curve
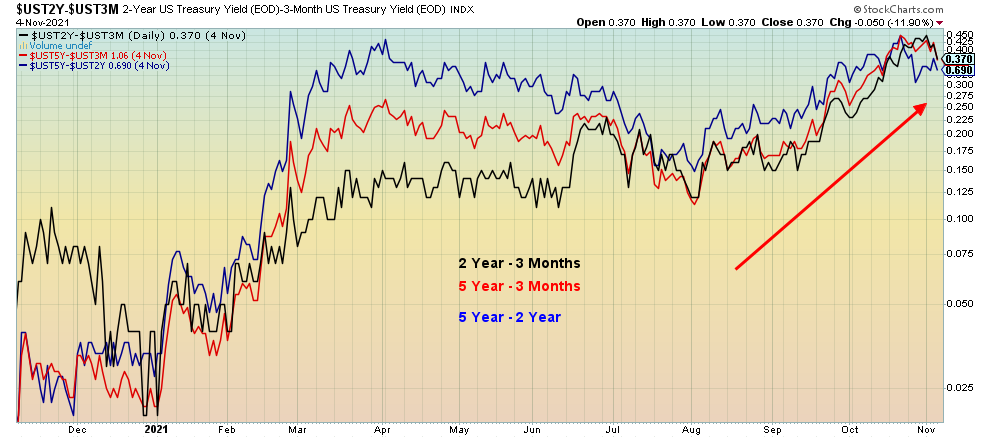
Source: www.stockcharts.com
Chart of the Week
U.S. Jobs Report
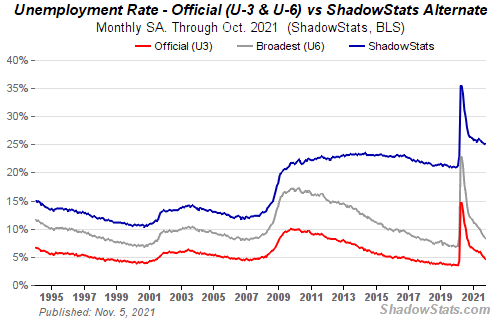
Source: www.shadowstats.com
For the first time in three months the nonfarm payrolls rose above forecasts. The October nonfarm payrolls were reported as 531 thousand, above the 450 thousand forecast. The September nonfarm payrolls were revised to 312 thousand. Altogether, the previous two months were revised upwards by 250 thousand. Helping the rise was a drop in COVID cases and employers offering higher wages and better hours. Biggest gains were in hospitality up 164 thousand, professional services up 100 thousand, manufacturing up 60 thousand, transportation and warehousing up 54 thousand, but education falling 65 thousand. Monthly job growth in 2021 has averaged 582 thousand. While total nonfarm is up 18.2 million since the trough in April 2020 it remains down 4.2 million from the peak in February 2020.
The official unemployment rate (U3) fell to 4.6% while the U6 rate, which is U3 plus persons marginally attached to labour force, plus total part-time for economic reasons, fell to 8.3% from 8.5%. Tellingly, the Shadow Stats (www.shadowstats.com) number, which is U6 plus discouraged workers unemployed over one year and defined out of the labour force in 1994, was unchanged at 25.1%. Speaking of persons not in the labour force, that level slipped slightly to 100,045 thousand down from 100,373 thousand in September. It peaked at 104,066 thousand back in April 2020. Of the those not in the labour force, 55.9 million are retirees and 24.2 million are claiming disability. There were 1,178 thousand included in the not in labour force group who want a job now, down from 1,323 thousand in September and well down from the 1,803 thousand seen in June 2020 at the peak.
The level of employment rose to 148,319 thousand in October from 147,788 thousand in September, reflecting the gain of 531 thousand nonfarm payrolls. The civilian labour force was 161,458 thousand vs. 161,354 thousand while the employment level rose to 154,039 thousand from 153,680 thousand. Both these levels remain down from peaks seen late 2019, early 2020. The total unemployed (official) was 7,419 thousand vs. 7,674 thousand in September. The number employed full-time rose to 128,306 thousand from 128,027 thousand in September but down from the 131,477 thousand seen in December 2019. Part-timers were recorded at 25,762 thousand, representing 17.4% of those employed.
The labour force participation rate was unchanged at 61.6%, well down from the peak 63.4% seen in January 2020. The employment population ratio improved slightly to 58.8% from 58.7% but remains down from the 61.1% seen in February 2020. Those unemployed 27 weeks or longer fell to 2,332 thousand from 2,704 thousand. The average number of weeks unemployed slipped to 26.7 weeks from 28.4 weeks and was well down from the average of 31.6 weeks seen in June 2021.
Arguably, the jobs report helps justify the Fed’s decision to taper. Wages grew 4.9%, but is that keeping up with inflation? The labour force remains tight as evidenced by the labour force participation rate. As long as participation rates remain low it helps lower the unemployment rate (U3). Still, the authorities have to be pleased with the report even though there is in reality nothing earth-shattering here. Participation remains low and the those unemployed for a lengthy period remains high. COVID is still playing havoc as hospitalizations remain elevated and vaccine mandates may result in another spike in unemployment as the unvaccinated are shed from the workforce.
Canada Jobs Report
Canada Employed Persons, Unemployment Rate 2016–2021
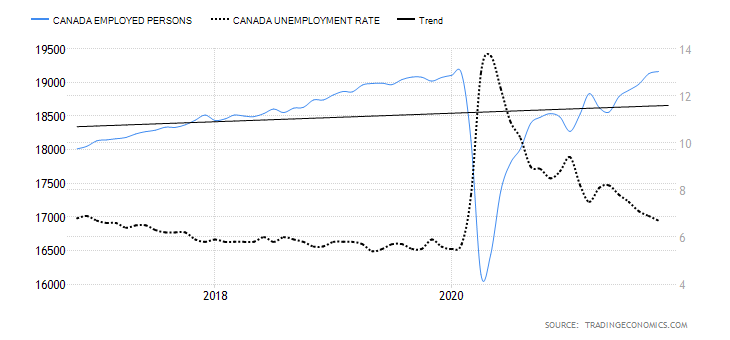
Source: www.tradingeconomics.com, www.statcan.gc.ca
Canada did disappoint on the downside with a gain of 31,200 jobs in October when they expected 50,000. But considering that September’s gain of 157,100 jobs was well above expectations, it still leaves Canada well ahead. It was the fifth consecutive month of expansion. Not only has Canada fully recovered all the jobs lost before the pandemic but they are now slightly ahead. The unemployment rate fell to 6.7% from 6.9%. But then the labour force participation rate slipped to 65.3% from 65.5%. A lower labour force participation rate translates into a lower unemployment rate. Full-time employment rose by 36,400 while part-time employment fell again by 5,200, the second consecutive monthly decline. The R8 unemployment rate, Canada’s highest measurement of unemployment, which includes discouraged searchers and involuntary part-time employment slipped to 8.1% from 8.3%.
Employment increases were seen for retail trade +72,000, but surprisingly accommodation and food services fell by 27,000. Ontario and New Brunswick saw gains while Manitoba and Saskatchewan saw declines. Private sector employment grew by 70,000 while the self-employed fell by 38,000. That is an interesting number in that the number of people working less than half their usual hours fell by 9.7% but remains 14.5% higher than in February 2020. The number of people unemployed 27 weeks or longer remained relatively unchanged at 379.7 thousand.
All this is good as the recovery continues. However, there are still labour shortages, although some companies are offering higher wages and better hours to attract workers. But wage gains remain mostly suppressed and that ought to keep the BofC from hiking interest rates too soon. Higher wages do result in inflation which is passed on to the consumer. None of this did much for interest rates or the Canadian dollar; both remained relatively unchanged. The TSX was higher following the U.S. stock market gains.
All in all, probably not a bad report even if it was slightly below expectations, but it was more than offset by the previous month.
MARKETS AND TRENDS
|
|
|
|
% Gains (Losses) Trends
|
|||||
|
|
Close Dec 31/20 |
Close Nov 5/21 |
Week |
YTD |
Daily (Short Term) |
Weekly (Intermediate) |
Monthly (Long Term) |
|
|
Stock Market Indices |
|
|
|
|
|
|
|
|
|
S&P 500 |
3,756.07 |
4,697.53 (new highs) |
2.0% |
25.1% |
up |
up |
up |
|
|
Dow Jones Industrials |
30,606.48 |
36,327.95 (new highs) |
1.4% |
18.7% |
up |
up |
up |
|
|
Dow Jones Transports |
12,506.93 |
16,843.98 (new highs) |
5.9% |
34.7% |
up |
up |
up |
|
|
NASDAQ |
12,888.28 |
15,971.59 (new highs) |
3.1% |
23.9% |
up |
up |
up |
|
|
S&P/TSX Composite |
17,433.36 |
21,455.82 (new highs) |
2.0% |
23.1% |
up |
up |
up |
|
|
S&P/TSX Venture (CDNX) |
875.36 |
985.14 |
3.7% |
12.5% |
up |
up |
up |
|
|
S&P 600 |
1,118.93 |
1,465.74 (new highs) |
6.5% |
31.0% |
up |
up |
up |
|
|
MSCI World Index |
2,140.71 |
2,394.47 |
0.6% |
11.9% |
up |
up |
up |
|
|
NYSE Bitcoin Index |
28,775.36 |
60,897.17 |
(0.5)% |
111.6% |
up |
up |
up |
|
|
|
|
|
|
|
|
|
|
|
|
Gold Mining Stock Indices |
|
|
|
|
|
|
|
|
|
Gold Bugs Index (HUI) |
299.64 |
258.90 |
4.0% |
(13.6)% |
up |
down |
up (weak) |
|
|
TSX Gold Index (TGD) |
315.29 |
284.62 |
4.0% |
(9.7)% |
up |
down |
neutral |
|
|
|
|
|
|
|
|
|
|
|
|
Fixed Income Yields/Spreads |
|
|
|
|
|
|
|
|
|
U.S. 10-Year Treasury Bond yield |
0.91 |
1.45% |
(7.1)% |
59.3% |
|
|
|
|
|
Cdn. 10-Year Bond CGB yield |
0.68 |
1.59% |
(7.6)% |
133.8% |
|
|
|
|
|
Recession Watch Spreads |
|
|
|
|
|
|
|
|
|
U.S. 2-year 10-year Treasury spread |
0.79 |
1.05% |
(1.9)% |
32.9% |
|
|
|
|
|
Cdn 2-year 10-year CGB spread |
0.48 |
0.67% |
4.7% |
39.6% |
|
|
|
|
|
|
|
|
|
|
|
|
|
|
|
Currencies |
|
|
|
|
|
|
|
|
|
US$ Index |
89.89 |
94.32 |
0.2% |
4.9% |
up |
up |
down (weak) |
|
|
Canadian $ |
0.7830 |
0.8027 |
(0.7)% |
2.5% |
up (weak) |
neutral |
up |
|
|
Euro |
122.39 |
115.67 |
flat |
(5.5)% |
down |
down |
neutral |
|
|
Swiss Franc |
113.14 |
109.65 |
0.4% |
(3.1)% |
up |
neutral |
up |
|
|
British Pound |
136.72 |
134.92 |
(1.5)% |
(1.3)% |
down |
down |
up |
|
|
Japanese Yen |
96.87 |
88.2 |
0.5% |
(9.0)% |
down |
down |
down |
|
|
|
|
|
|
|
|
|
|
|
|
Precious Metals |
|
|
|
|
|
|
|
|
|
Gold |
1,895.10 |
1,816.80 |
1.8% |
(4.1)% |
up |
neutral |
up |
|
|
Silver |
26.41 |
24.16 |
0.9% |
(8.5)% |
up |
down |
up |
|
|
Platinum |
1,079.20 |
1,035.80 |
2.4% |
(4.0)% |
up |
down |
up |
|
|
|
|
|
|
|
|
|
|
|
|
Base Metals |
|
|
|
|
|
|
|
|
|
Palladium |
2,453.80 |
2,027.60 |
2.4% |
(17.4)% |
up (weak) |
down |
neutral |
|
|
Copper |
3.52 |
4.34 |
(0.6)% |
23.3% |
neutral |
up |
up |
|
|
|
|
|
|
|
|
|
|
|
|
Energy |
|
|
|
|
|
|
|
|
|
WTI Oil |
48.52 |
81.27 |
(2.8)% |
67.5% |
up (weak) |
up |
up |
|
|
Natural Gas |
2.54 |
5.52 |
1.7% |
117.3% |
up |
up |
up |
|
Source: www.stockcharts.com, David Chapman
Note: For an explanation of the trends, see the glossary at the end of this article.
New highs/lows refer to new 52-week highs/lows and in some cases all-time highs.
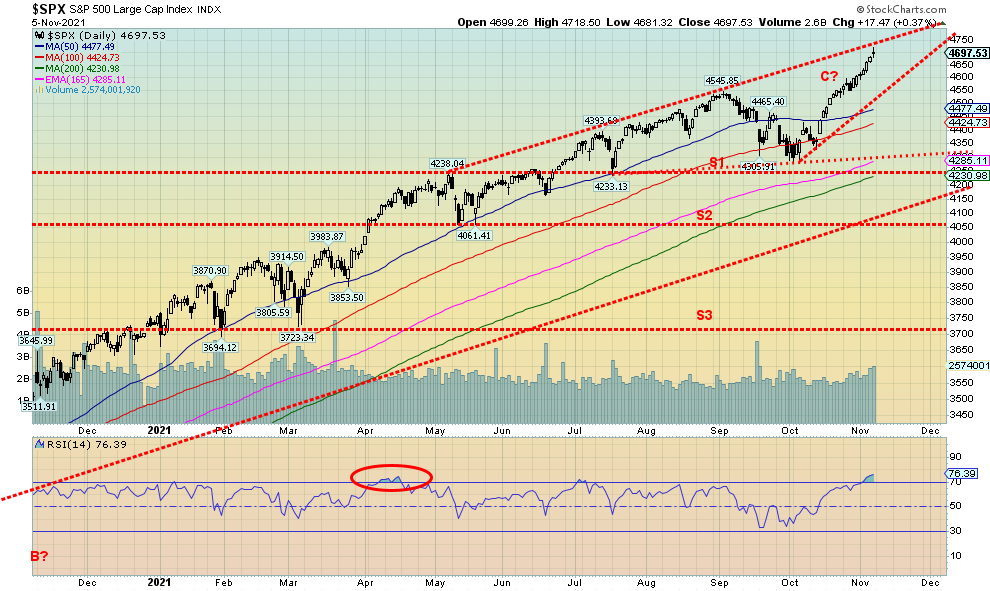
Source: www.stockcharts.com
It was another record week for just about everybody. The question is, who didn’t make new all-time highs this past as opposed to who did. Just about everybody did. Exceptions were the AMEX and the KBW Bank Index. The confirmation that we could be embarking on a major new up-leg and even a blow-off is that the small cap stocks—the S&P 600 and the Russell 2000 along with the Dow Jones Transportations (DJT)—all burst to new all-time highs this past week, confirming the large cap indices. The DJT gained a strong 5.9% this past week while the S&P 600 was up 6.5%. As we show below, the small caps are suggesting they will now outperform the large caps and that is bullish for the market going forward.
The S&P 500 gained 2.0%, the Dow Jones Industrials (DJI) was up 1.4%, and the NASDAQ burst out of its upper channel, gaining 3.1%. In Canada, the TSX Composite hit new all-time highs, up 2.0%. The small cap TSX Venture Exchange (CDNX) led, up 3.7%. In the EU, the London FTSE gained 0.8%, the Paris CAC 40 was up 3.1% and new all-time highs, and the German DAX also made new all-time highs, up 2.3%. In Asia, China’s Shanghai Index (SSEC) faltered, down 1.6% but the Tokyo Nikkei Dow (TKN) gained 2.5%. The MSCI World Index was up 0.6% but did not make new all-time highs. We note below as well that U.S. stocks should outperform global equities. Bitcoin did not make new all-time highs as it fell a small 0.5% but still closed over $60,000. If things are as bullish as we think they are, then Bitcoin too should soon make new all-time highs.
The S&P 500 has reached the top of a bull channel. But as we note with the NASDAQ it broke above its bull channel, suggesting that a potential blow-off could occur. As we also note with the NASDAQ next the timing is right, neatly coinciding with the blow-off move of 1999–2000. Of course, none of this is guaranteed but we like the looks of it. Yes, the Fed is going to taper but in essence they have been doing that for months through the reverse repo market. And the Fed indicated it won’t be hiking interest rates any time soon. That’s music to the stock market, and to the gold market as well, which also may be embarking on a strong up move (see gold later on).
There is a plethora of positive signs around and this could make for a rather exciting market going forward for the next few months. After all, November to January is the strongest three months of the year. The early signs are encouraging. As well, there are lot of bears out there who think the market is about to collapse because it is overbought. Except it can get more overbought. We saw that 1999–2000. Remember to use a trailing stop.
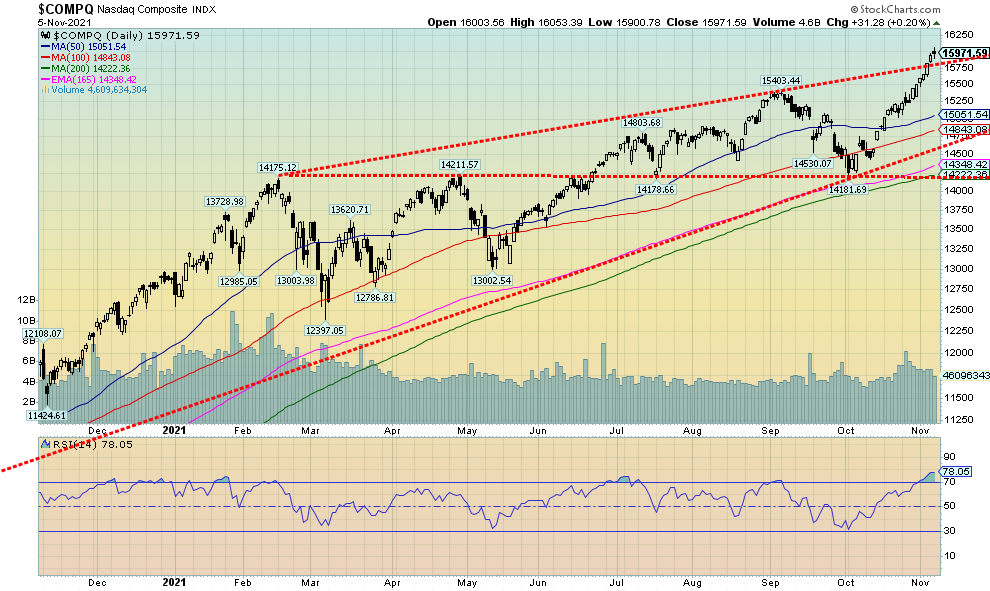
Source: www.stockcharts.com
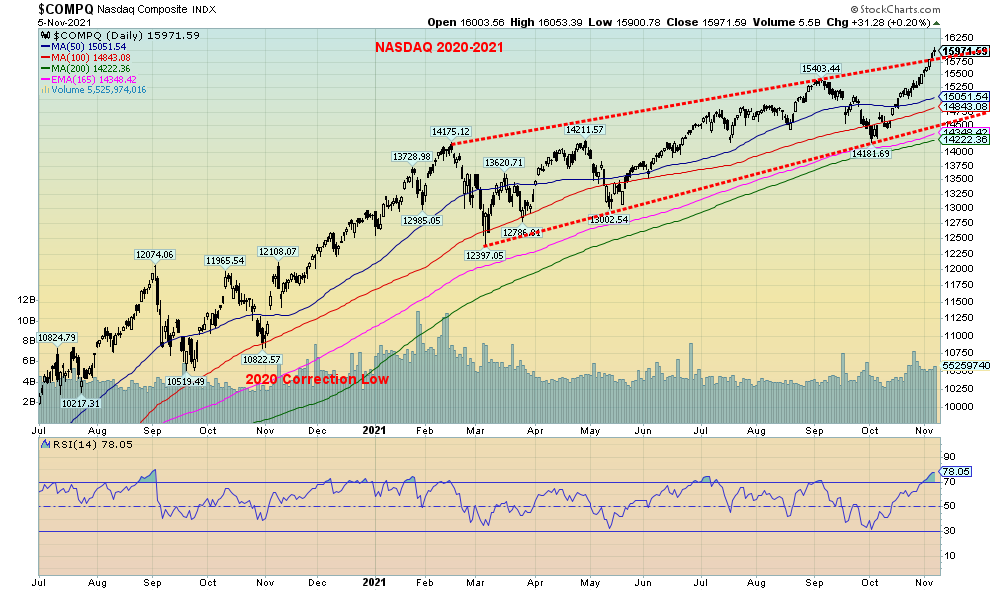
The NASDAQ continued its strong rise, bursting above the upper channel. Despite the RSI now reaching almost 80, this chart is suggesting that the NASDAQ could move higher going forward. The long upward correcting formation between January 2021 and October 2021 now appears to be complete. Arguably, we could call this an ascending triangle with potential targets for the NASDAQ up to 18,750. Naturally, the FAANGs would have to help take the NASDAQ higher. This past week four of them made new all-time highs. They were Google +0.7% on the week, Microsoft +1.3%, Tesla +9.7%, and Nvidia +16.3%. Is there anything stopping Tesla? Other FAANGs also had a good week. Facebook, or should we now say Meta, gained 5.4%. Guess investors like the new name. Apple was up 1.0%, Amazon +4.3%, Netflix faltered, losing 6.5%, and Twitter also faltered, off 0.8%. The Chinese FAANGs continue to have issues with Baidu down 2.5% and Alibaba off 3.8%. But the real surprise was the NASDAQ breaking over what appeared to be the top of a channel. The last time we saw a pattern like that was 1999. The NASDAQ had consolidated from January 1999 to October 1999 with a rising pattern not dissimilar to what we are seeing today. When it broke out in November 1999 we were then witness to the incredible run to March 2000 when the NASDAQ gained 95%. A similar move today would take the NASDAQ to 27,600. Okay, don’t get too excited. Past performance, etc. Throughout the incredible November 1999 to March 2000 runup the RSI was consistently over 70. Overbought was meaningless. Trailing stops, however, are important.

Source: www.stockcharts.com
Source: www.stockcharts.com
Here’s a picture of the 1999–2000 NASDAQ. Compare that with the picture of the 2021 NASDAQ. Note similar tops in January 1999 and January 2021. The rising consolidation pattern that followed broke out in November just as it appears (not guaranteed) the NASDAQ is doing today. Before the start of the rise the 1998 market bottomed in October as did the corrective period noted in 2020.
Source: www.stockcharts.com
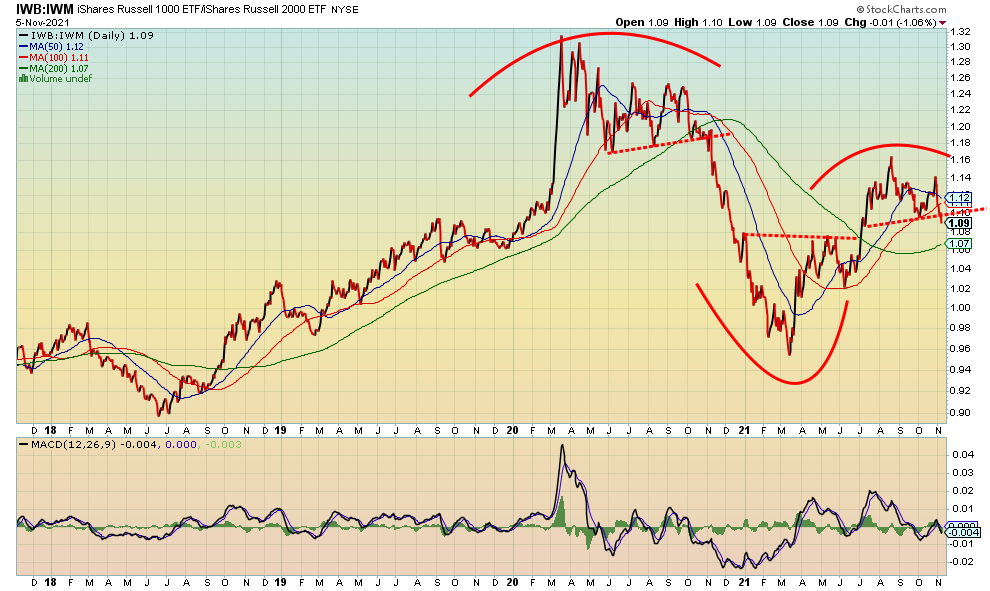
This is a chart of the Russell 1000 (large cap)/Russell 2000 (small cap) ratio. We appear to be breaking down from a small topping pattern, suggesting that going forward small cap stocks (Russell 2000) should outperform large cap stocks (Russell 1000). Notice that also happened in 2020 coming out of the pandemic and, sure enough, the Russell 2000 enjoyed a very good run until the ratio bottomed in March 2021 and the Russell 1000 started to outperform the Russell 2000. The MACD indicator has also turned down.
Source: www.stockcharts.com
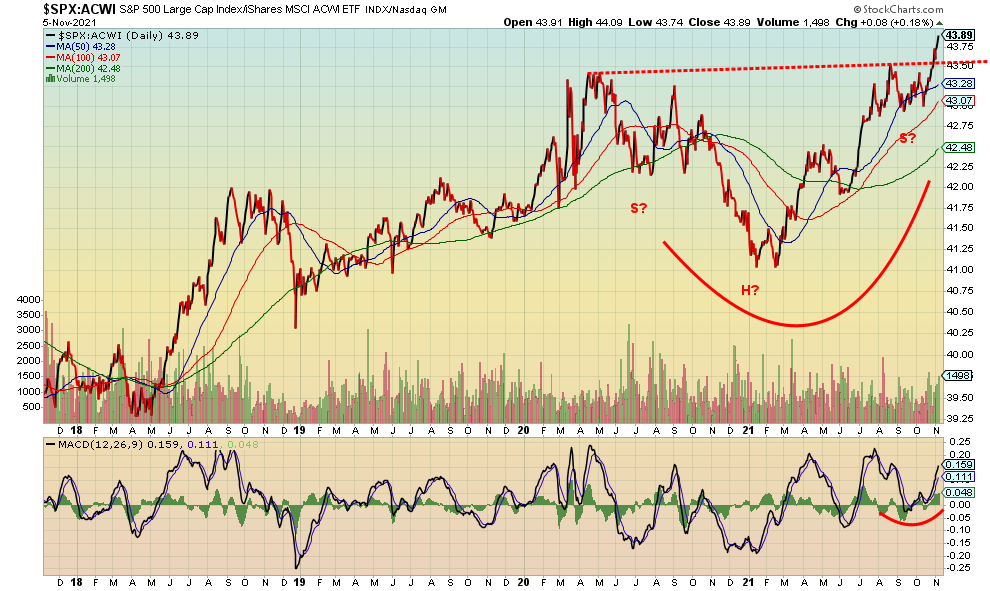
Here’s another ratio chart. This time it is the S&P 500 vs. the MSCI World Index ETF. The ratio appears to have formed a large (2-year) inverse head and shoulders pattern and is now breaking out in favour of the S&P 500. What it suggests is that U.S. stocks could outperform global equities going forward. Minimum targets appear to be up to around 46.
Source: www.stockcharts.com
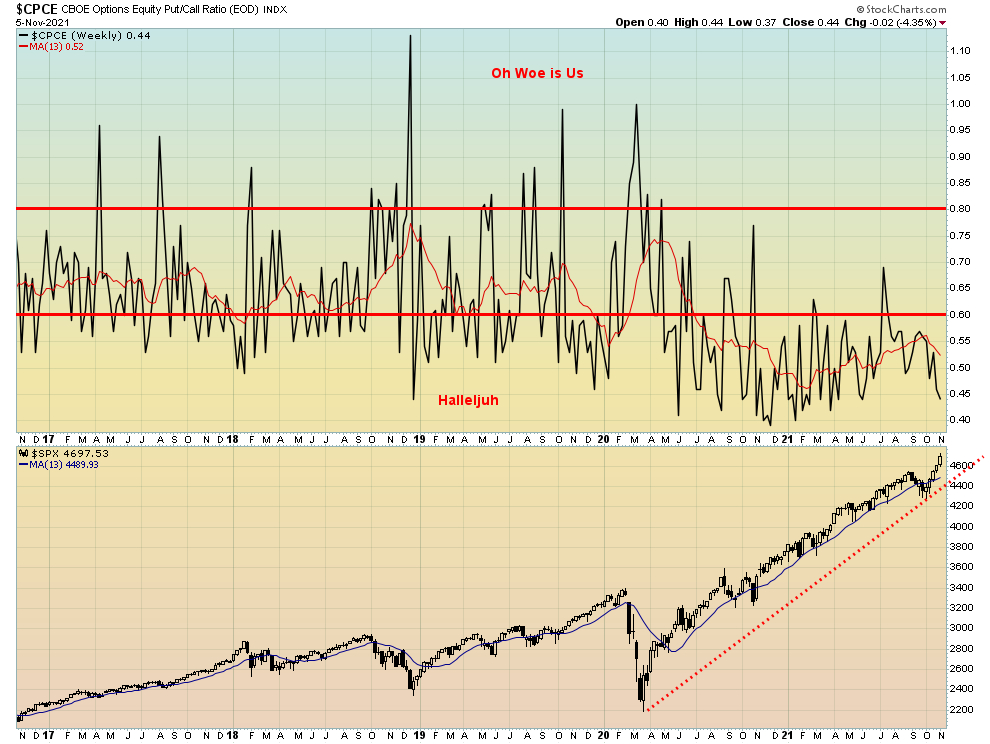
The put/call ratio remains a very bullish 0.44. Not a record low but still quite bullish. The record low was 0.35 back in November 2020. We could construe this as a divergence, given the S&P 500 made new highs but the put/call ratio did not make new lows. For the record, the VIX Volatility Index rose on Friday following the job numbers, diverging with the new highs recorded by the S&P 500. The VIX did not make new lows this past week. The VIX moves inversely to the S&P 500. The NYSE Advance-Decline line did continue higher, confirming the highs for the S&P 500. Lagging and diverging are the S&P 500 Bullish Percent Index as well as the number of stocks trading above their respective 50-and-200-day MAs. These are mixed signals, but none of them suggest for sure that we have topped in the markets.
Source: www.stockcharts.com
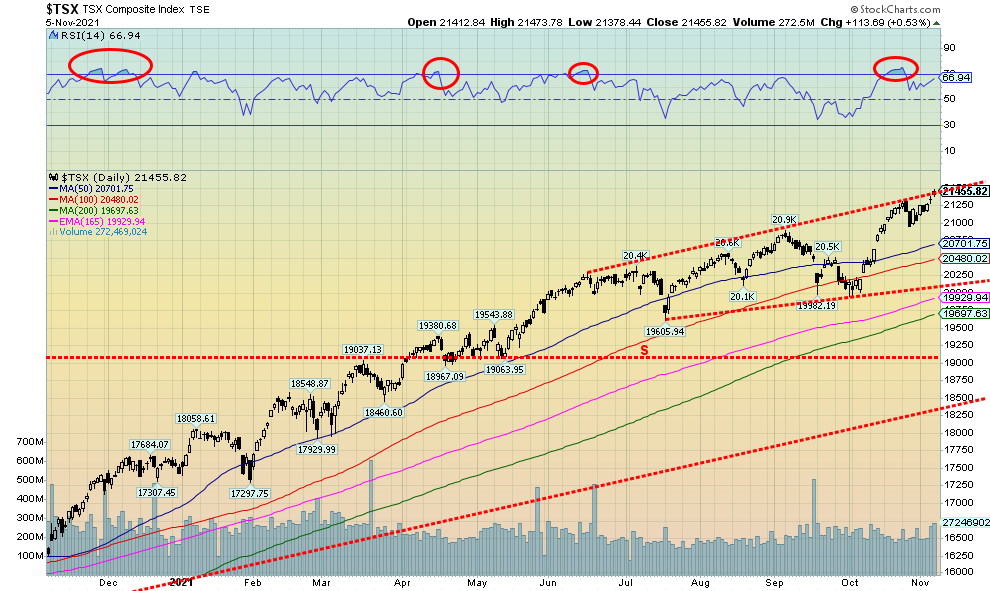
Another week, another record high. Does anything stop this market? Well, we have reached the top of what appears as a channel; however, we also appear to be trying to poke our way through. The TSX Composite gained 2.0% this past week to another record high. The small cap TSX Venture Exchange (CDNX) was up 3.7% and is now up 12.5% so far in 2021. Thirteen of the fourteen sub-indices saw gains on the week with the only exception being Information Technology (TKK) that fell a small 0.2%. Five of the indices made new all-time highs. The leader was Consumer Discretionary (TCD), up a strong 5.2%. Consumer Staples (TCS) was up about 5% but did not make new highs. Energy gained 4% to new highs and Financials (TFS) was up 2.0% also to new highs as dreams of higher dividends for banks, etc. came into play. The other new highs were Industrials (TIN) up 1.3% and Real Estate (TRE) up 1.5%. Golds (TGD) jumped 4.0%, putting in a strong week.
With the TSX Composite hitting the top of the channel we are unsure of the next move. Divergences are looming as the RSI has so far made a lower high even as the TSX made new highs. The first break doesn’t come until under 21,000. A more serious break would be under 20,000. However, if we solidly move above 21,500 then, as we have noted for the other indices, the potential for a blow-off comes into focus. The consolidation period that occurred from June to September has the possible look of an ascending triangle which is bullish. Potential targets are up to 22,800, a move of 6%+ from current levels.
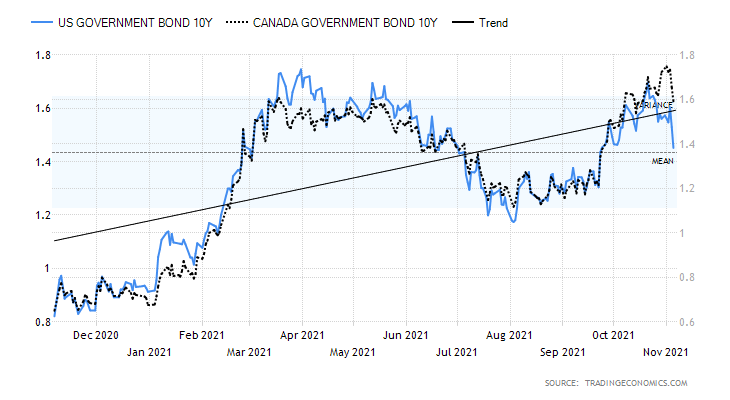
U.S. 10-year Treasury Bond/Canadian 10-year Government Bond (CGB)
Source: www.tradingeconomics.com, www.home.treasury.gov, www.bankofcanada.ca
The Fed’s dovish tones this past week that they will taper but won’t be hiking interest rates any time soon and that inflation remains transitory allowed longer-dated bond yields to fall. The stronger than expected job numbers failed to lift bond yields this past week. The result was the U.S. 10-year treasury note fell to 1.45% from 1.55% and the Canadian 10-year Government of Canada bond (CGB) fell to 1.59% from 1.72%. The signal seems to have quickly gone from sell bonds to buy bonds. If a move above 1.40% had signalled to us that higher yields were now possible, a move back below 1.40% would signal to us that lower yields are now possible. There was a small divergence in that the CGBs saw new highs but the U.S. 10-year did not. There is a possibility that the 10-year has made a double top at 1.74% back in March 2021 and a high of 1.68% in October 2021. The neckline would come in at 1.19% and a solid break could project yields down to 0.64% for the 10-year. First, however, we need to break under 1.40% to give some comfort to lower yields. A move back above 1.60% could start to negate the bullish outlook.
The big story of the week was the FOMC where they announced tapering as expected. But the dovish tone from the Fed on interest rates helped spur bond yields to fall (while prices, that move inversely to yields, rose). Naturally, there are scenarios that see rates continue to rise. That is why taking out 1.40% would help the bull case, but above 1.60% all bets are off and we could then see new highs.
As to the market, besides the job numbers (covered earlier) there were other numbers. The ISM Markit PMI for October came in at 60.8, slightly above expectations of 60.3, while the Markit Composite PMI was also slightly higher at 57.6 vs. 57.3. Both showed strength for manufacturing. Factory orders for September rose 0.2% above consensus of a 0.1% gain; initial jobless claims continued to fall this time at 269 thousand below the expected 275 thousand; and the balance of trade (noted earlier) was a record $80.9 billion deficit as exports fell and imports rose.
What’s key now for the 10-year is that we break under 1.40% to suggest lower yields. However, a move back above 1.60% would be negative and the uptrend would most likely resume.
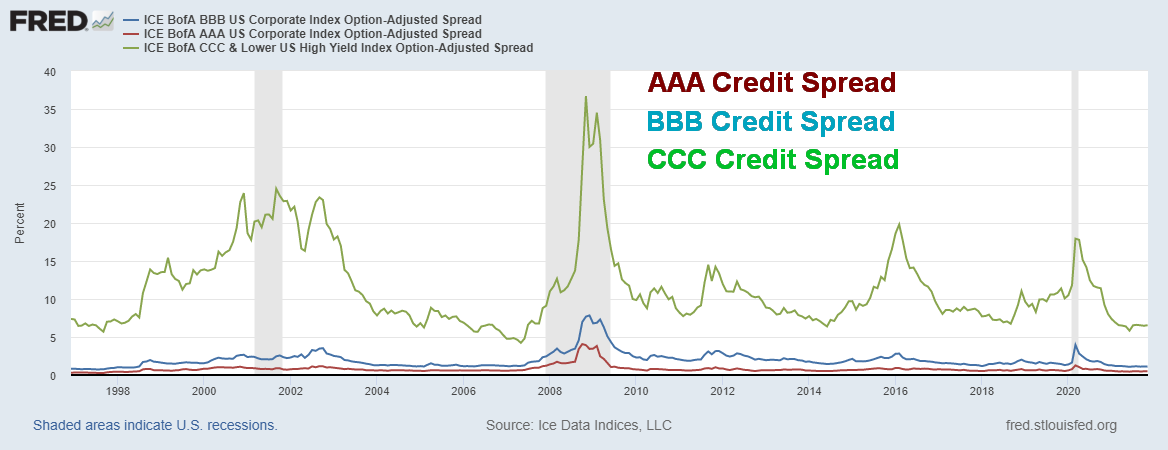
Credit Spreads – AAA, BBB, CCC 1997–2021
Source: www.stlouisfed.org
Credit spreads remain at some of their lowest levels over the past 20+ years. The AAA spread is a skinny 0.48%, well down from the March 2020 high of 1.26%. The BBB spread, the lowest investment grade credit, is down to 1.12% vs. a high of 3.96% back in March 2020. Finally, the CCC spread, reflecting effectively junk bonds, is at 6.55% vs. a high of 17.94% back in March 2020 at the height of the pandemic. None of this tells us exactly when credit spreads might start to widen again but, given they have visited these levels before and then failed to get much lower, the risk here is upside, not spreads narrowing further. Grant you, overall yields could fall if long treasuries continue to decline in rate but it won’t necessarily mean that the spread narrows further.
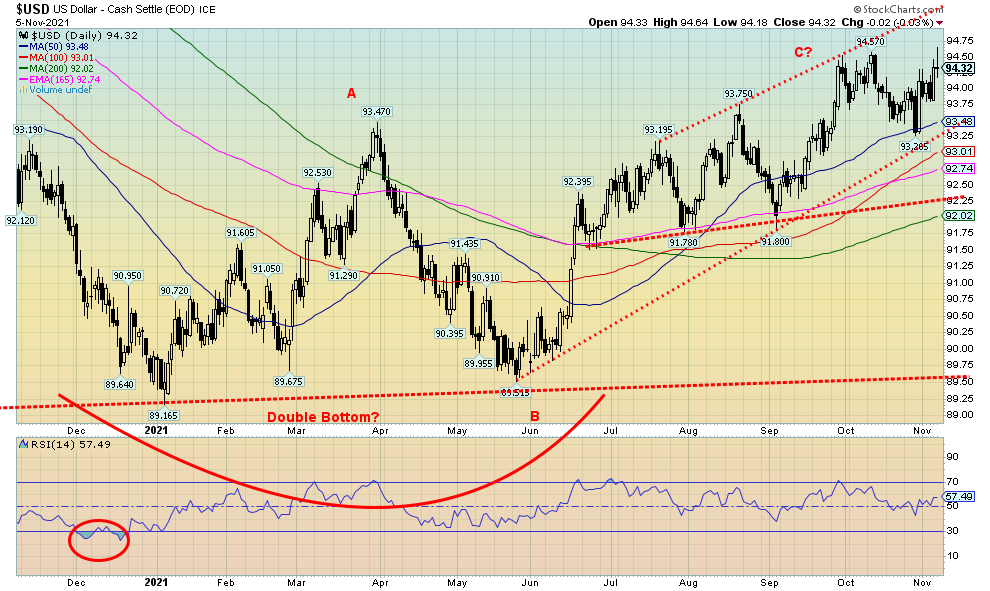
Source: www.stockcharts.com
The US$ Index rallied once again, up towards the 94.60 level. It was the third attempt in the past few weeks. We briefly penetrated the previous 94.57 high with a high Friday at 94.64. However, the US$ Index settled back to close at 94.32 for a gain of 0.2% on the week. The euro was actually flat on the week despite making a small new low for its recent move down. The only reason the US$ Index managed a gain on the week was because the pound took a small beating, losing 1.5% after the BOE announced that they were not hiking rates this week but may consider them going forward. There was some concern that the BOE was losing control of things. The Swiss franc was up 0.4% on the week while the Japanese yen was the strongest, following a prolonged decline up 0.5% on the week. The Canadian dollar fell 0.7% despite the BofC announcing interest rate hikes into 2022 and tapering to get underway. However, the US$ Index making three forays into the same zone on September 30 and October 12 followed by another attempt this past week with a slight new high suggests to us this is three thrusts to a high and the next move should be down. We note this especially since the most recent low was below the earlier low, thus suggesting a downtrend forming. A break now of 93.50 and especially under 93.25 and 93 should propel the US$ Index lower. Under 92/92.25 a more prolonged decline should get underway. While new highs are still possible, we are viewing Friday’s indecisive close at 94.32 as possibly signalling a top.
Source: www.stockcharts.com
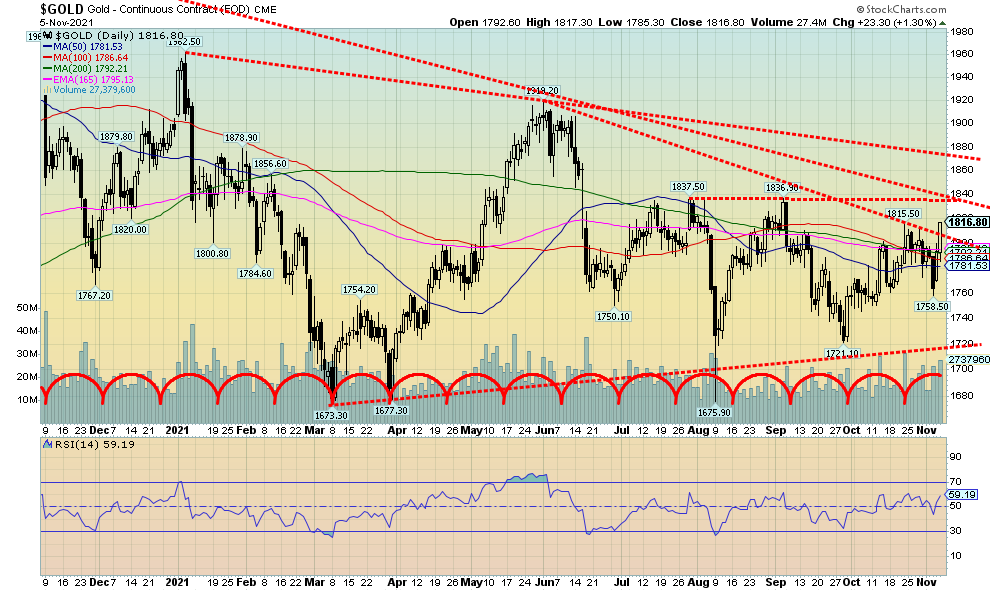
Thanks to the Fed, gold enjoyed a good up week despite the stronger than expected job numbers on Friday. Thanks to the Fed that did the expected and announced the taper. But the Fed gave no indication as to when they might hike interest rates and that was music to gold’s ears. The Fed’s limited reaction to interest rate hikes and inflation meant that gold could be purchased once again. Carry would remain cheap. Gold had its strongest up week in two months as it gained 1.8% on the week. Silver gained 0.9%, platinum was up 1.5%, while the near precious metals were mixed with palladium gaining 2.4% but copper slipping 0.6%. The signal from the Fed was dovish, given they weren’t going to be hiked into interest rate hikes by the stronger than expected job numbers on Friday. The Fed also stuck to its view that inflation is transitory, being pushed up particularly by the supply disruptions. As to interest rates, the 2-year treasury note slipped to 0.39% from a high of 0.50% and the 10-year treasury note dropped to 1.45% from 1.55%. That was music to gold’s ears and to the stock market as well.
Gold even broke above its first downtrend line at $1,808. We are now firmly up into the $1,800/$1,820 zone and our expectations are that we should break above $1,820 this coming week and possibly above $1,840. Further resistance lies above but not until about $1,880. The $1,840 resistance may be the neckline of a bottom pattern. It could project gold up to at least $2,000. Cycles have turned up and we have a nascent uptrend line forming. There appears to be good support down to $1,760 but below that level we could fall further to $1,720. Under $1,700 new lows are possible. We are not expecting that now, given the improving bullish background and cycles turning positive. With an RSI of 59 we have considerable room to move higher without the market becoming overheated.
We remain confident that the March 8, 2021 low of $1,673 was our 31-month low. Cycles divide into two or three, so we’d look for some sort of low in December/January for the 10.3-month low. Half that is five months and the low of August 9 at $1,676 fits that as it was exactly five months from the March low. The next low should be a higher low. If the gold rally gains some steam, we could see a strong move into 2022 for the peak of the 7.8-year cycle.
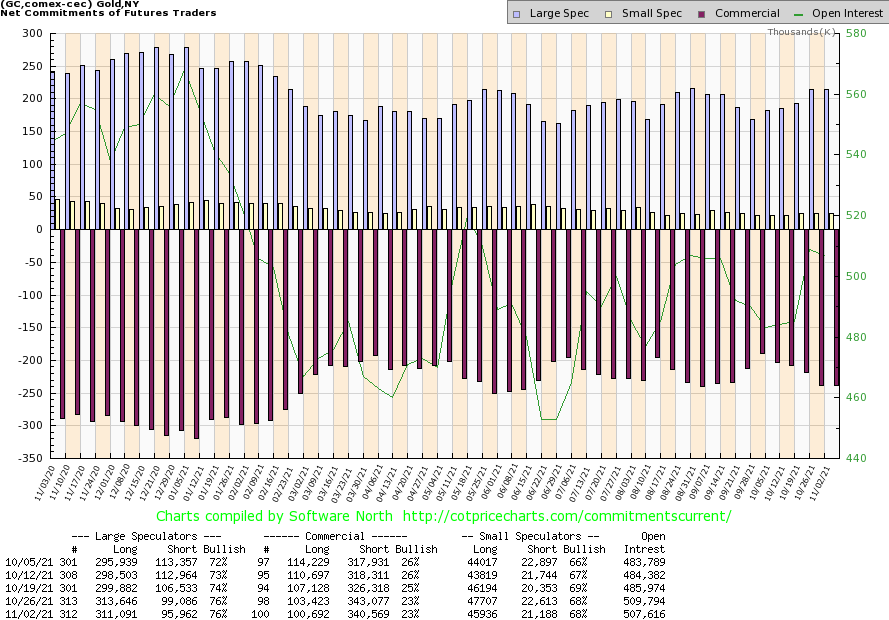
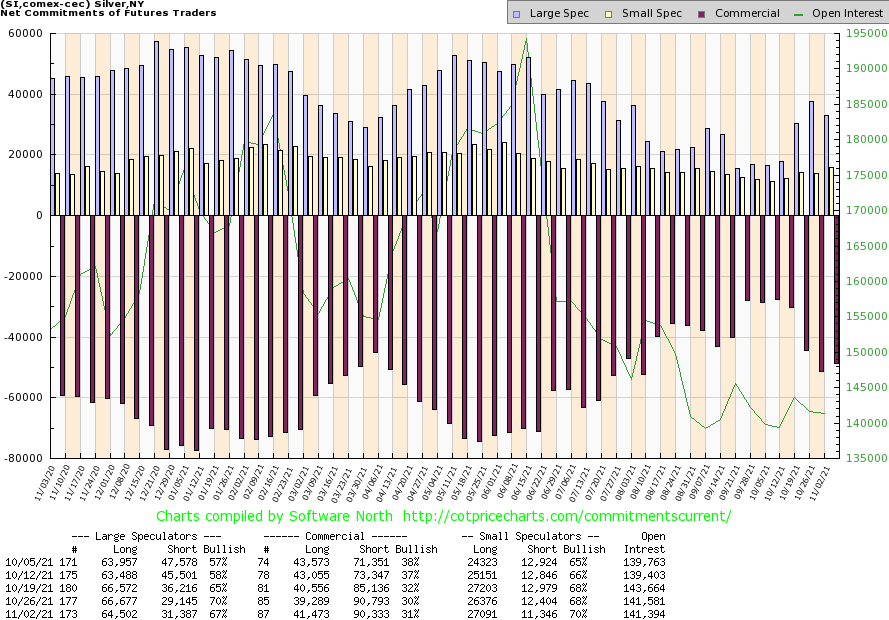
Source: www.cotpricecharts.com
The gold commercial COT (bullion companies and banks) was unchanged this past week at 23%. Long open interest did fall about 3,000 contracts but short open interest also fell down roughly 2,500 contracts. The large speculators COT (hedge funds, managed futures, etc.) was also unchanged at 76%. They too saw both long and short open interest fall. Overall, open interest fell on an up week, suggesting covering of both long and short positions.
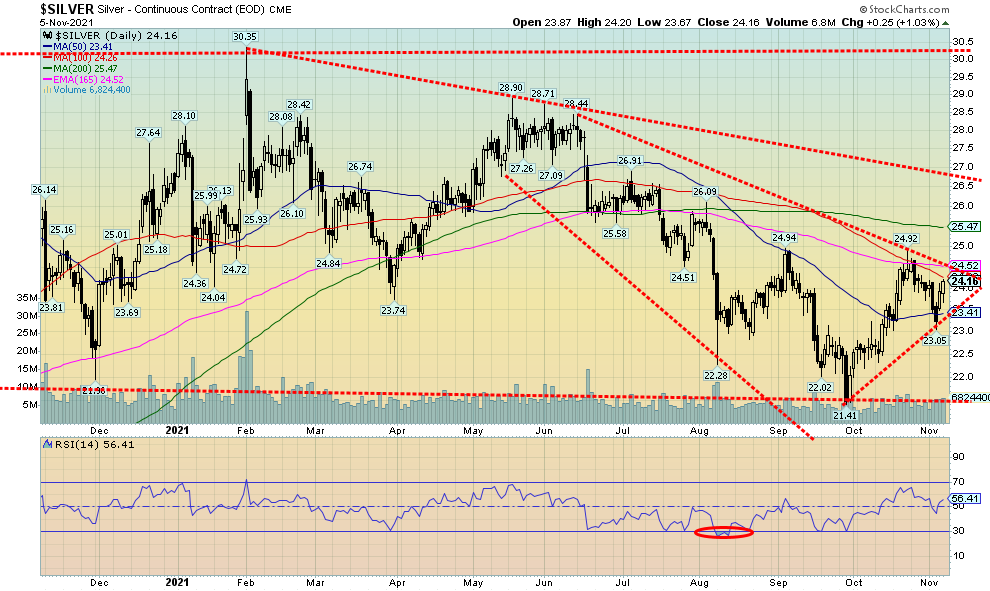
Source: www.stockcharts.com
Silver prices had a good week with a gain of 0.9% and closing once again over $24. That’s the good news. The bad news is that the silver price gain lagged gold that was up 1.8%. We’d have preferred it was the other way around as we like to see silver leading. Nonetheless, silver is up 12.8% from the late September low while gold is only up 5.6%. Silver still leads. That has helped the gold/silver ratio to fall to 75.2. The gold/silver ratio break point is under 70 (see the next chart). Silver has work to do here. We may now be forming a nascent uptrend as witnessed by joining the low at $21.41 and the low of the past week at $23.05. The break point is under $23.40 with final support at the $23.05 low. Above that, silver needs to break above $24.50 and, more importantly, is breaking above $25.50 and $26. Above $26 we’d feel more confident that a low is in and higher prices lie ahead. The final break point is above $27. Above that level, new highs are possible above $30.35.
Source: www.stockcharts.com
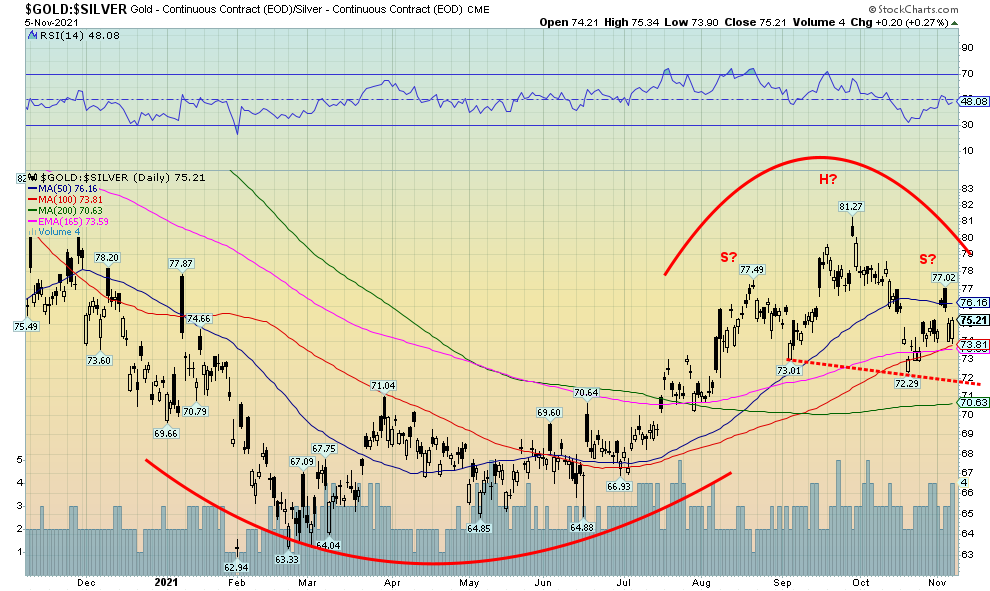
The gold/silver ratio may be forming a potential head and shoulders top. It’s an awkward one with the down sloping neckline but we have seen this pattern work in the past. The break point is under 72 with targets than potentially down to 63. The obvious stop is at the recent high of 77.02. There is clear support at 74 but under that level a fall to 72 should occur. Further support is seen around 70.60. Once under 70, however, we’d feel more confident that we should break to the potential target of 63. At current prices that would presume gold still at $1,817 with silver at $28.80/$29. Admittedly, there is work to be done here to fulfill the potential.
Source: www.cotpricecharts.com
There was a slight improvement this past week for the silver commercial COT as it rose to 31% from 30%. Short open interest was only mildly lower on the week but long open interest was up over 2,000 contracts. We view that has positive. The best part is the large speculators COT that fell to 67% from 70% as they became more bearish. Long open interest fell more than 2,000 contracts while short open interest jumped over 2,000 contracts. We’ll follow the commercials and be encouraged by the improvement.
Source: www.stockcharts.com
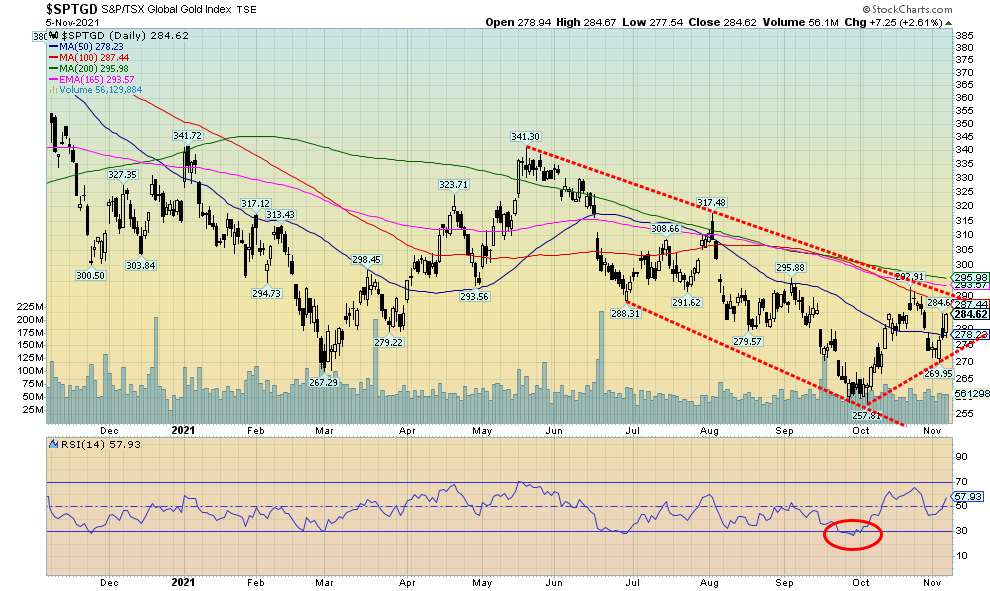
Gold stocks had a good week. On Friday the indices leaped as gold prices soared. The result was that both the TSX Gold Index (TGD) and the Gold Bugs Index (HUI) gained 4% on the week. Some individual stocks fared even better. Despite the good rise on the week the gold stocks remain below recent highs. For the TGD that is seen near 293. The TGD has considerable resistance up to 290/295. Once through 295, however, the gold stocks could start to move higher. Volume has not necessarily picked up just yet, but once through 295 it should rise. Given the low this week for the TGD near 270 we now have a nascent uptrend in play. Support is now down to 275 and there is only danger on a break back under 270. We could argue that a small head and shoulders bottom has formed. The left shoulder is the low at 279.57 while the right shoulder low is at 269.95. The right shoulder is not supposed to be lower than the left shoulder. The neckline would be at around 290. Given a break of 290 and especially above 295 targets could be up to 325/330. The stop would be at 270.
Source: www.stockcharts.com
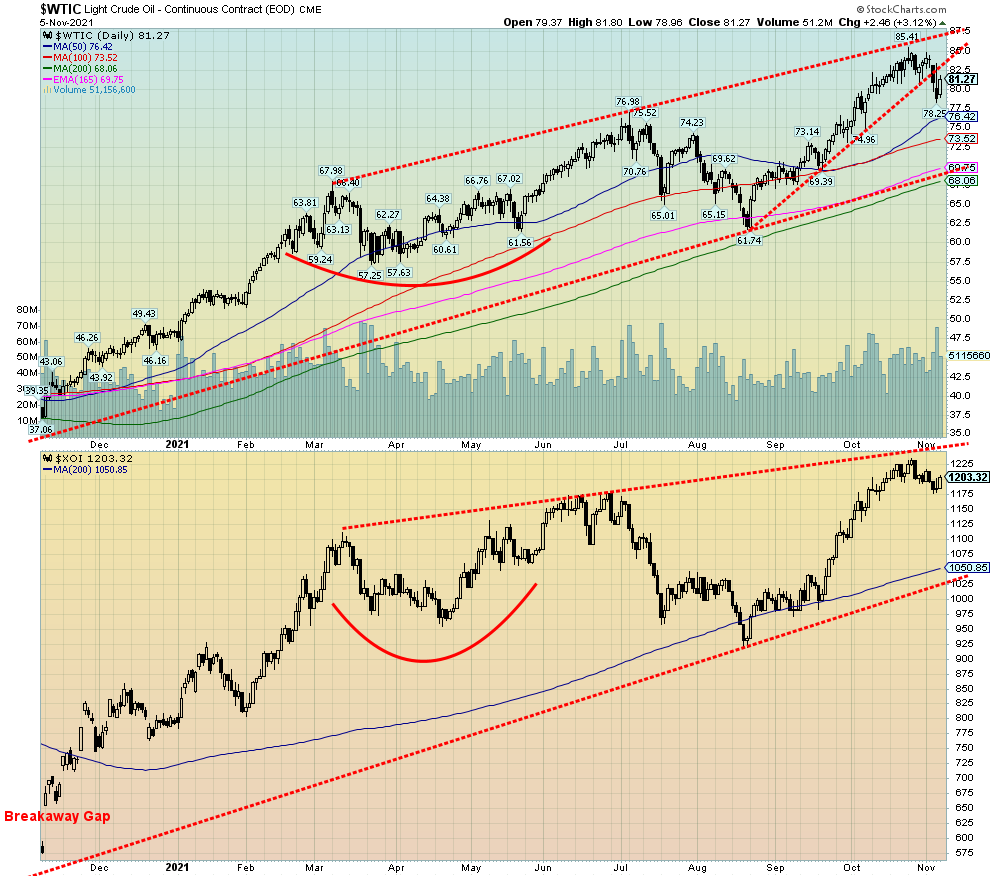
The question has come up. Has oil topped? For the second consecutive week WTI oil slipped, this time by 2.8%. Natural gas (NG) did not go along as it gained 1.7%. The energy stocks also did not bite as the ARCA Oil & Gas Index (XOI) was up about 0.6% while the TSX Energy Index (TEN) roared to another 52-week high with a gain of 2.7%. While OPEC plus met, they did not bite and increase production. What changed was that the high prices are starting to kick in for U.S. shale producers as they have announced plans to increase production. A number of firms have benefitted from the higher prices with higher profits and now they are prepared to take the next step and up production. Finally, the Biden administration has tapped into the Special Petroleum Reserves (SPR) to help put a bit of a lid on gasoline prices. All of this is more than enough to offset OPEC’s decision to not open their taps further. OPEC’s decision means that, as a worst case, they will continue their 400,000 bpd monthly increments. All this is against the backdrop of oil importers wanting more product.
An interesting aside from the COP26 was that the U.S. and the U.K. along with another 18 countries will no longer finance oil and gas projects abroad. However, that is weakened considerably, considering the Asian countries have not agreed to go along with that.
The overall picture for oil is now at least mildly bearish. WTI oil has broken what may be an ascending wedge triangle. That potentially projects WTI oil to fall to the bottom of the up-channel line, currently near $70. The pattern, however, does not show up in the energy stocks as witnessed by the TEN making new highs and the XOI not yet responding to lower oil prices. Oil prices did bounce back on Friday following the release of the October job numbers, suggesting that WTI oil was responding to the potential for increased demand given more workers working.
We’ll see how oil responds when it reaches the lower channel of the wedge pattern. That is currently near $83. A move above $84 would suggest that new highs were probable. A breakdown under $77.50 would, however, suggest lower prices down to test $73/$73.50. As for the XOI right now, it has good support down to around 1,110/1,120. The TEN only loses some altitude under 155 for a possible fall to good support near 135/145.
Copyright David Chapman, 2021
|
Charts and commentary by David Chapman Chief Strategist, Enriched Investing Inc. Phone: 416-523-5454 Email: david@davidchapman.com dchapman@enrichedinvesting.com Twitter: @Davcha12 November 8, 2021 |
|
GLOSSARY Trends Daily – Short-term trend (For swing traders) Weekly – Intermediate-term trend (For long-term trend followers) Monthly – Long-term secular trend (For long-term trend followers) Up – The trend is up. Down – The trend is down Neutral – Indicators are mostly neutral. A trend change might be in the offing. Weak – The trend is still up or down but it is weakening. It is also a sign that the trend might change. Topping – Indicators are suggesting that while the trend remains up there are considerable signs that suggest that the market is topping. Bottoming – Indicators are suggesting that while the trend is down there are considerable signs that suggest that the market is bottoming.
|
Disclaimer David Chapman is not a registered advisory service and is not an exempt market dealer (EMD) nor a licensed financial advisor. We do not and cannot give individualised market advice. David Chapman has worked in the financial industry for over 40 years including large financial corporations, banks, and investment dealers. The information in this newsletter is intended only for informational and educational purposes. It should not be considered a solicitation of an offer or sale of any security. Every effort is made to provide accurate and complete information. However, we cannot guarantee that there will be no errors. We make no claims, promises or guarantees about the accuracy, completeness, or adequacy of the contents of this commentary and expressly disclaim liability for errors and omissions in the contents of this commentary. David Chapman will always use his best efforts to ensure the accuracy and timeliness of all information. The reader assumes all risk when trading in securities and David Chapman advises consulting a licensed professional financial advisor before proceeding with any trade or idea presented in this newsletter. David Chapman may own shares in companies mentioned in this newsletter. We share our ideas and opinions for informational and educational purposes only and expect the reader to perform due diligence before considering a position in any security. That includes consulting with your own licensed professional financial advisor.
About the author


Website: https://www.enrichedinvesting.com
Disclaimer: David Chapman is not a registered advisory service and is not an exempt market dealer (EMD) nor a licensed financial advisor. We do not and cannot give individualised market advice. David Chapman has worked in the financial industry for over 40 years including large financial corporations, banks, and investment dealers. The information in this newsletter is intended only for informational and educational purposes. It should not be considered a solicitation of an offer or sale of any security. The reader assumes all risk when trading in securities and David Chapman advises consulting a licensed professional financial advisor before proceeding with any trade or idea presented in this newsletter. David Chapman may own shares in companies mentioned in this newsletter. We share our ideas and opinions for informational and educational purposes only and expect the reader to perform due diligence before considering a position in any security. That includes consulting with your own licensed professional financial advisor.