
“The job of central banks: to take away the punch bowl just as the party is getting going.”
—William McChesney Martin, 9th Chairman of the Federal Reserve 1951–1970, President of the NY Stock Exchange 1938–1941; 1906–1998
“We can guarantee cash benefits as far out and whatever size you like, but we cannot guarantee their purchasing power.”
—Alan Greenspan, American economist, 13th Chairman of the Federal Reserve 1987–2006, 10th Chairman of the Council of Economic Advisors 1974–1977, private adviser through Greenspan Associates LLC, speaking on funding of Social Security to Senate Banking Committee 2/15/05; b. 1926
“Markets are constantly in a state of uncertainty and flux and money is made by discounting the obvious and betting on the unexpected.”
—George Soros, Hungarian-American businessman and philanthropist, formed Double Eagle Hedge Fund, 1969, later Soros Fund Management, 1970, Double Eagle was renamed Quantum Fund; known as the man who broke the Bank of England, 1992; b. 1930
McChesney Martin’s words always seemed prophetic. Since 1950 the Fed has embarked on hiking interest rates 13 times, with this being the thirteenth. On 11 of those occasions the rate hikes resulted in a recession. The other time brought a slowdown but not an official recession. The jury is out on whether this one will turn into a recession or merely a slowdown.
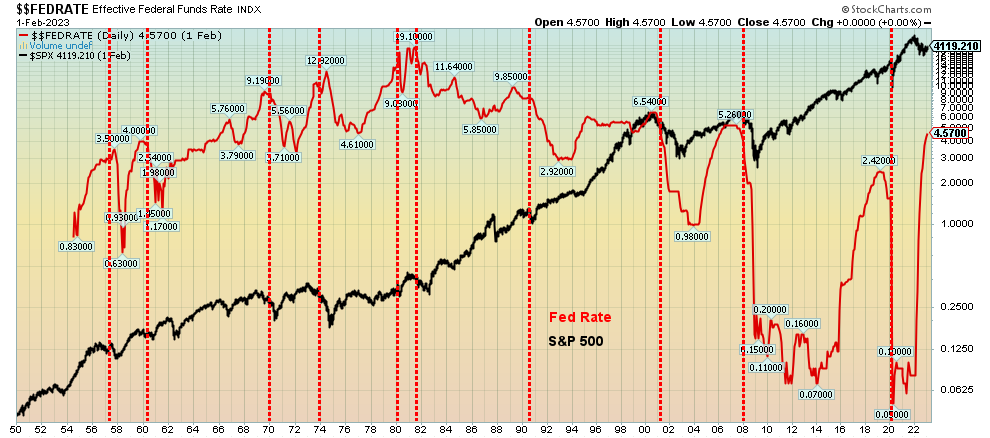
Source: www.stockcharts.com
Our chart above shows the S&P 500 overlaid with the Fed Funds Effective Rate. Each vertical line marks the beginning of a recession. Since 1950 there have been 11 recessions. Each official recession lasted anywhere from two months (the 2020 pandemic recession) to one year, six months (the Great Recession 2007–2009). In terms of steepness of decline of GDP, the pandemic recession of 2020 saw the economy retract 19.2% while the shallowest was the dot.com/high-tech recession of 2001 that saw only a 0.3% decline. What will this one bring? Nothing, or merely a shallow one as many are predicting? Or a hard landing and a steep recession as some are suggesting?
A rise in the Fed funds rate was usually preceded by or at least accompanied by a rise in the inflation rate. Rates normally rise in response to the inflation. Inflation and rising interest rates go together. Almost invariably, the stock market falls as rates rise. By the time the recession is getting underway, the stock market decline is already in motion and it rarely bottoms before the recession is over.
The worst decline was the Great Recession when the S&P 500 fell 56.8%. Periods of low interest rates encouraged a rise in the stock market. After the Great Recession and especially after the pandemic recession, interest rates were held at or near zero. But, as we have noted many times, the low interest rate environment along with quantitative easing (QE) and a rising money supply did not result in investments in the economy. Instead, it encouraged an extended period of speculation in the stock market and the housing market, along with extreme speculation in meme stocks, cryptos, and more. It also encouraged massive borrowing binge, as we saw total U.S. debt explode from $54 trillion at the end of the Great Recession to $94 trillion today. Globally, debt more than doubled from roughly $140 trillion to over $300 trillion today and that’s not counting trillions more in debt hidden amongst derivatives. U.S. Federal debt jumped from $9.9 trillion to $31.6 trillion today. In Canada, it was the same as Government of Canada debt went from about $500 billion to almost $1.1 trillion today.
Fed Funds and CPI 1950–2023
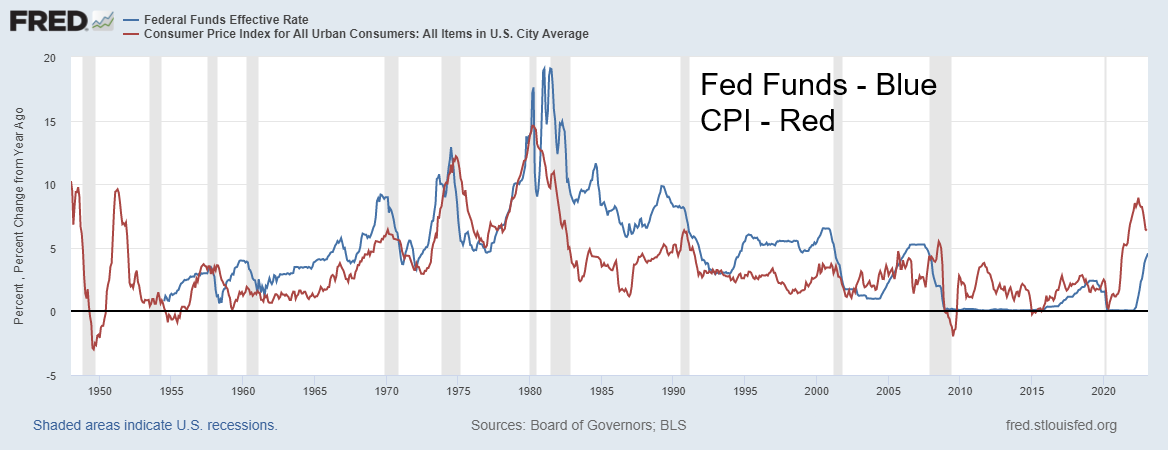
Source: www.stlouisfed.org
So, what will the Fed do at the March 21–22 FOMC? Fed Chairman Jerome Powell spoke on March 7–8. He was far more hawkish than everyone expected. Disinflation is slow to come. Inflation could remain higher for longer than most expect. The stock markets and gold tanked while the US$ Index soared. The two-year treasury note jumped over 5% before pulling back again on fears of, well, you know, a recession. Bond yields ticked higher, then they too fell. In Canada, the two-year is currently 3.98%. Still, that’s the highest rates seen since 2007. It comes as a bit of a shock to the market as this is not what they are used to.
With so much debt outstanding, we keep wondering when an unexpected debt collapse could hit. Could the collapse of SVB Bank be the start? (See Chart of the Week for SVB Bank and the job numbers). Delinquency rates (for car loans, student loans, HELOCs, credit cards, mortgages, etc.) are rising but are still not at dangerous points—yet. But bank loan books are swollen with consumer debt, especially mortgages. The Fed, without saying so, is also worried about a debt collapse. Sovereign debt is a particular area of concern, given the number of countries that are on the brink, but the corporate world also gorged on debt over the past decade or so. Consumers gorged on debt as well, but they alone would not be able to spark a global debt crisis unless that brought down financial institutions. Then there is the world of derivatives with potentially trillions of dollars of debt not included in official figures.
Powell’s second day of testimony got a bit testier. While reiterating the need to continue rate hikes, rate decisions will be made on the “totality of data.” He appeared annoyed at suggestions they will hike 50 bp March 21-22. The market was instantly ramping up how high the Fed would hike. It was 25 bp but some started talking 50 bp and that the end goal could be a 7% Fed rate (currently it is 4.75%). At 7%, Powell would be getting close to pulling a Volcker, by pushing rates above the rate of inflation. We don’t believe that will happen as we are sticking with the 1974–1975 scenario where interest rates remained below the rate of inflation—which at least temporarily brought down the rate of inflation and helped spark the 1973–1975 recession.
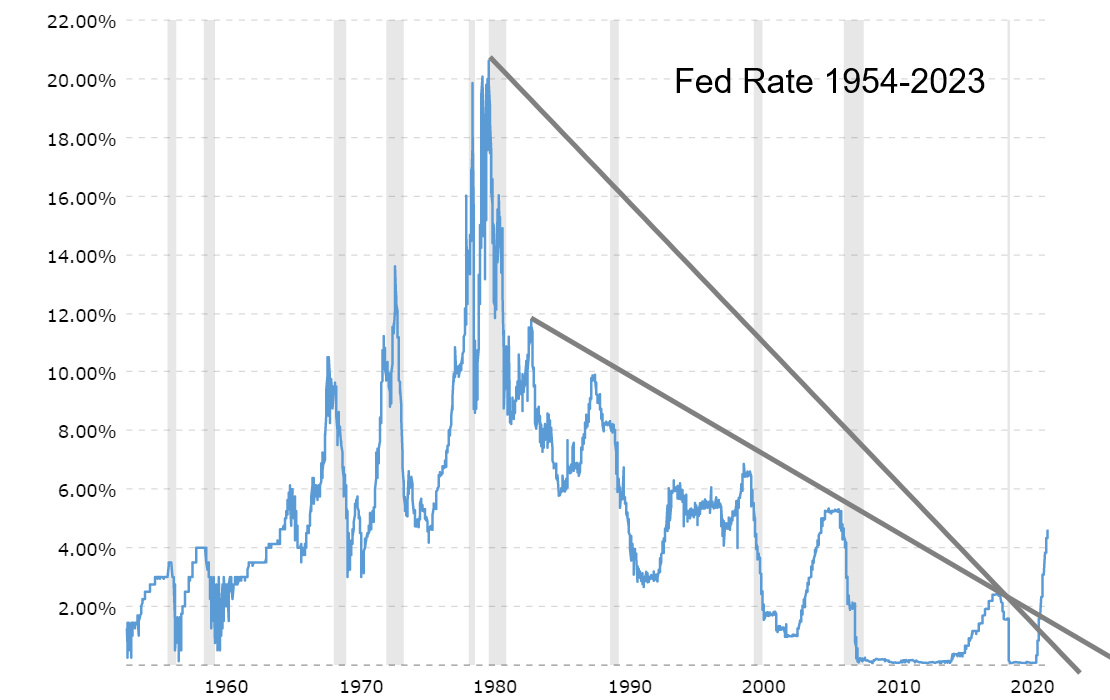
Source: www.macrotrends.net
One thing is clear, however, that we have broken a 41-year downtrend for interest rates. We see that not only here but also with the 10-year treasury note. Are the days of forever-low interest rates over? It’s a question we should consider. And what impact will that have on the market as it tries to adjust.
So, will the Fed hike 50 bp or only 25 bp March 21–22? But will events like the SVB collapse cause the Fed to pivot? So far, Powell has downplayed the impact of rising interest rates on jobs. His job is price stability (monetary policy). Dealing with a recession and rising unemployment is the responsibility of the government (fiscal policy). Yet, as we have seen there, there is little sign of an impending huge rise in job losses (February’s job numbers are the subject of Chart of Week). Regardless of all the talk, the expectation remains that the hike will be 25 bp. Not a pause like Canada.
Economic numbers during the week were a mixed bag. Factory orders fell, but not as much as expected, consumer credit came in below expectations, job openings remain highly elevated, coming in above expectations and jobless claims rose above 200,000 for the first time in eight weeks and above expectations. However, Challenger job cuts were well below expectations. And then the February job numbers came in once again above expectations. But, despite it all, gold was acting positively as fear of bank failures suddenly surfaced and took center stage.
The chart below shows once again Fed Funds vs. the CPI. It is slightly different than our first one in that it shows the actual rate hikes. The first Fed rate hike didn’t come until March 2022 when rising inflation was already well on its way. Why did the Fed wait so long? The Ukraine war started in late February 2022. War is always inflationary. So, did the Fed hike rates to combat the inflation already under way or did they hike rates in response to the beginning of a war that the Fed knew would be ultimately inflationary? The line marks the start of the war. Stock markets had topped a month earlier. But even with inflation coming down, the Fed has continued its rate hikes. There is no sign that the war will end anytime soon. Not surprisingly, the Bank of Canada (BofC) became the first central bank to pause. But could continued inflation along with other central banks hiking rates cause the BofC to reconsider? Central banks are data driven. With the Fed poised to raise again, some pressure was put on the Canadian dollar as the interest rate differential rises. And that in turn was positive for gold priced in Canadian dollars.
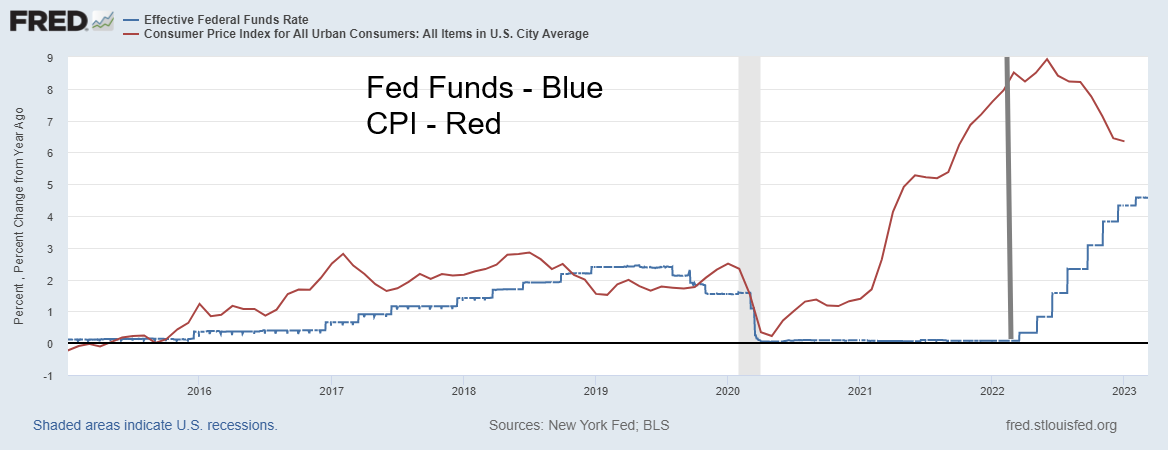
Source: www.stlouisfed.org
Wars are expensive. Recall that it was expenditures on the Vietnam War that sparked the inflation of the 1970s. Inflation soared as well during World War I and World War II. Vietnam, along with the Arab oil embargo in 1973 and again in 1979, helped further spark inflation. Even though the U.S. is not actually fighting the Ukraine war, it is noteworthy that the U.S. has already appropriated $122 billion in military and humanitarian aid to Ukraine in 2022 alone. And more is planned. The entire annual Russian military budget is estimated to be between $75 billion and $84 billion.
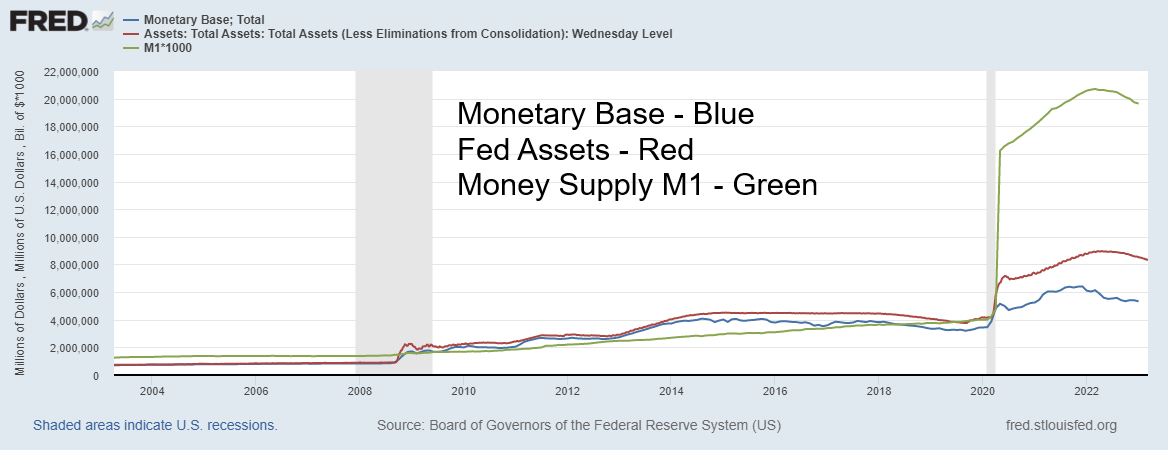
Monetary Base, Fed Assets, M1 – 2003–2023
Source: www.stlouisfed.org
Above is a picture of the punch bowl being taken away in the form of falling money supply, falling assets of the Fed and a falling monetary base. If you combine hiking interest rates while at the same time pulling money out of the financial system, it is going to have a negative effect. And that negative effect is that asset prices are falling—stocks, houses, cryptos, memes, you name it. Since peaking, the monetary base has declined by $1 trillion, Fed assets have fallen by roughly $700 billion as they roll off assets, and money supply M1 has fallen by $1.6 trillion. The monetary base topped back in December 2021 while the other two peaked in April 2022. But it had already been signaled in advance that the Fed would start to roll off their holdings and that money supply would begin to contract. Punch bowl gone.
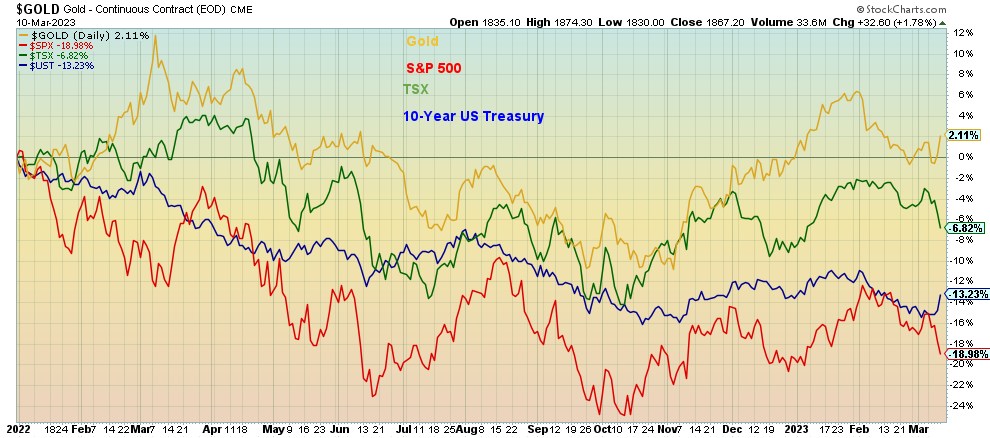
The stock market peaked on January 4, 2022. Since then, the S&P 500 has fallen roughly 19% and the TSX is off almost 7%. Bonds, as measured by the U.S. 10-year treasury note, are also down as they are off over 13% without counting the coupon. But gold is up a small 2.0%, proving once again gold’s safe haven status. Gold in currencies other than the U.S. dollar is up even more. That is what happens when the punch bowl is pulled.
This week brings us the February CPI and PPI, retail sales, some manufacturing PMIs, and the preliminary Michigan Sentiment Index. Our chart of the performance of selected markets since January 2022 is on the next page.
Performance Selected Markets January 2022 to Present
Source: www.stockcharts.com
Chart of the Week
Job Numbers and SVB Bank
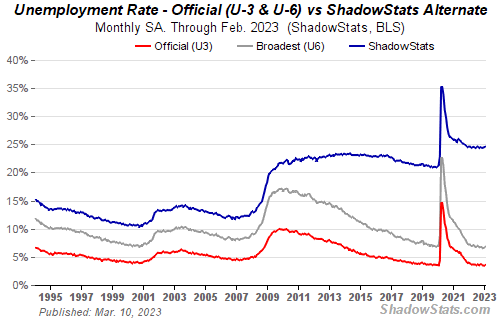
U.S. Job Numbers
Source: www.shadowstats.com
Forget about the Fed pausing. U.S. job numbers continue to surprise to the upside. The February nonfarm payrolls came in up 311,000. The market had expected only 200,000–225,000. But the unemployment rate (U3) rose to 3.6% from 3.4%. Maybe it’s because the civilian labour force expanded by 419,000. Also, the labour force participation rate (LFPR) jumped to 62.5% from 62.4%. More people participating translates into a higher unemployment rate. Even the U6 unemployment rate (U3 plus short-term discouraged workers) jumped to 6.8% from 6.6%. Shadow Stats (www.shadowstats.com) unemployment, which is U6 plus long-term discouraged workers and those defined out of the work force in 1994, rose to 24.6% from 24.5%. All are at a six-month high. Is this the first sign of softening? Traders didn’t get any joy with revisions of earlier reports as the two prior months were revised downward by only 34,000 jobs.
The bulk of the jobs went in the private sector (265 thousand) while full-time employment jumped 607,000 with part-time falling 311,000. If there were any thoughts about a retracting job market, the February numbers dispelled that. The service sector attracted 254,000 fewer jobs than the 335,000 in January. There were also fewer job leavers. The high-tech sector continues to shed jobs, but it slowed last month. That sector has seen declines for three consecutive months.
The employment-population ratio remained unchanged at 60.2% while the average number of weeks unemployed slipped to 19.3 from 20.4. The number of people unemployed 27-weeks or longer also fell, down 54,000. Numbers not in the labour force (NILF) fell as well, down 269,000. The largest component of NILF is retirees which is at 57.8 million.
The jobs market remains quite strong. There remain over 10 million job openings, off record highs but still higher than at any point in time in the past. Participation rates, particularly from the key 25–54-year-old category remains very high at 83.1% vs. 82.7% in January. None of this is going to stop the Fed from hiking rates on March 21–22. A 25 bp hike is highly expected, even as the odds of a 50 bp hike have fallen. You can’t have a recession if the job market is going to remain strong. We are now seeing forecasts of recession possibilities being pushed out into 2025. All this despite the longest stretch of a negative yield curve we’ve ever seen.
Average weekly hours fell to 34.5 from 34.6 while hourly earnings jumped up 4.6% year-over-year (y-o-y) from 4.4% the previous month. But that was below expectations of a 4.7% gain. All that is still below the rate of inflation, but it is rising.
The employment-population ratio remained unchanged at 60.2% while the average number of weeks unemployed slipped to 19.3 from 20.4. The number of people unemployed 27-weeks or longer also fell, down 54,000. Numbers for those not in the labour force (NILF) fell as well, down 269,000. The largest component of NILF is retirees which is at 57.8 million.
The Collapse of SVB Bank
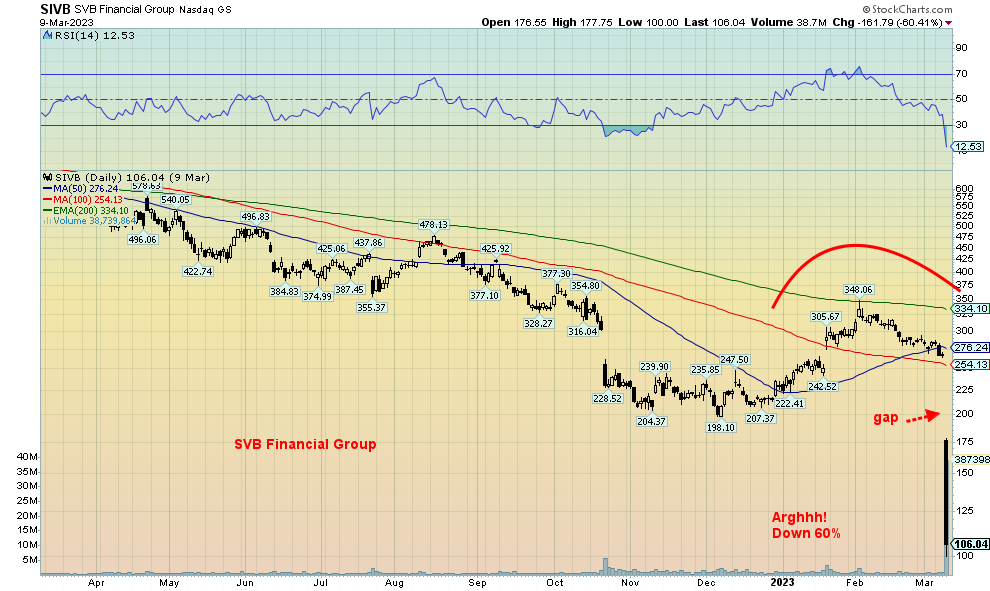
Could job losses, interest rate hikes, and poor results in Silicon Valley be contributing to the downfall of SVB Bank? Well partly. SVB Bank has suddenly become the story of the week. A dramatic two-day decline of some 60% will do that and a potential huge bankruptcy in the financial sector will do that. Oh yes, and SVB topped in November 2021 at $763. The decline? Now over 86% with likely more to come.
SVB Bank (SIVB/NASDAQ) is/was? the 18th largest bank in the U.S. with assets of $211 billion. SVB is the largest bank failure since Washington Mutual in 2008 and now the second-largest banking collapse in U.S. history. Are tech sector woes spreading to Wall Street? SVB has been halted and is seeking a buyer. Indeed, it might be imperative that the government finds a buyer to stem further volatility on Wall Street.
The SVB Bank story has suddenly become the topic of the week and there are already endless commentaries concerning its collapse. We feel like a “Johnny-come-lately” to the story. But it bears repeating.
The fear is that the collapse of SVB Bank could spark contagion. Right now, SVB has been taken over by banking regulators. Numerous Silicon Valley companies bank with SVB and they have payroll obligations next week. But what if they can’t access their funds? They need a real buyer, not a government regulator. There had been a bank run until that was halted with the seizure. Deposits are now frozen.
So, what caused this? Any number of reasons but a classic bank problem appears to be at the center of the problem. In a rising interest rate environment and a steep negative yield curve SVB’s book had lent long and were funding short. The long end of their book had numerous securities that were marked-to-market. In a rising interest environment, the losses on these securities were mounting. When nervous depositors started pulling funds out of the bank (borrow short) SVB was forced to sell securities taking losses that soon imperiled (wiped out?) their capital.
Could SVB be a Lehman Brothers moment? Not likely, as compared to the money center banks, it is not that large. We are not talking Citibank here, a bank in the category of “too big to fail”. But the collapse has negatively impacted bank shares. TSX Financials (TFS) fell over 5% this past week. That it has come out of the blue is no surprise. However, we knew the odds of a collapse of some sort were rising just because of rising interest rates. Every period like this in the past has resulted in a financial crisis and a major collapse. Franklin National, Penn Central, Savings & Loans (S&L), Enron, Lehman Brothers; their names resonate and they were at the center of earlier financial crisis.
But is there the fear of contagion? Cryptos went wild after the SVB collapse. And last week two more crypto banks collapsed: Circle Financial USDC Stablecoin and Silvergate Capital. Unlike real banks, crypto banks do not have a Federal Deposit Insurance Corporation (FDIC) to back them up. So far, the fallout is not as severe as when FTX collapsed. But USDC held $3.3 billion of its reserves with SVB. (https://www.bloomberg.com/news/articles/2023-03-11/usd-coin-stablecoin-falls-further-from-peg-on-svb-exposure-risk?sref=5lk0w2FC#xj4y7vzkg). Janet Yellen (Treasury Secretary) gathered banking regulators together, including the Fed and the FDIC. Is SVB a “black swan” event?
SVB Bank serviced the Silicon Valley high-tech companies, often acting as seed capital for startups. Silicon Valley workers and many venture capital firms plus others banked with SVB. SVB was an important player as venture capital firms were dependent on its loans. The fear now is of contagion, although for the most part many other banks have much higher capital ratios and their balance sheets are stronger, thanks to regulation that came out after the financial collapse of 2008 and the Great Recession. SVB Bank also had offices in Toronto, Canada and was a provider of funds for venture firms in the Canadian high-tech industry.
SVB Bank could face a bail-in, which means that large depositors like Roku, the huge internet TV provider that had $487 million with SVB (roughly 26% of its funds), could be facing huge losses. Venture capital firms could collapse with many facing bankruptcy and their workers facing unemployment if they can’t meet payrolls. This whole affair has popped up suddenly and there were few warnings beforehand. Are there ever? There were rumblings of downgrades before this.
SVB Bank could face a bail-in, which that means that large depositors like Roku, the huge internet TV provider that had $487 million with SVB (roughly 26% of its funds), could be facing huge losses. FDIC insurance only covers up to $250,000. Venture capital firms could collapse with many facing bankruptcy and their workers facing unemployment if they can’t meet payrolls. This whole affair has popped up suddenly and there were few warnings beforehand. Are there ever? There were rumblings of downgrades before this.
SVB Bank – On its way to Zero?
Source: www.stockcharts.com
All in all, this has the stock market reeling. Gold, on the other hand, is doing the opposite and is, of course, considered a safe haven. Bond yields have plunged as the 10-year dropped to 3.69% after being over 4% earlier. Bonds are also considered a safe haven. The US$ Index plunged.
Is this the start of something bigger? Recall the 2008 financial crisis started with the sudden collapse of a couple of obscure sub-prime funds with Bear Stearns in July 2007. All that led eventually to the Lehman Brothers moment. Oh yes, and Bear Stearns also disappeared. SBV is now joining them.
Canada job numbers
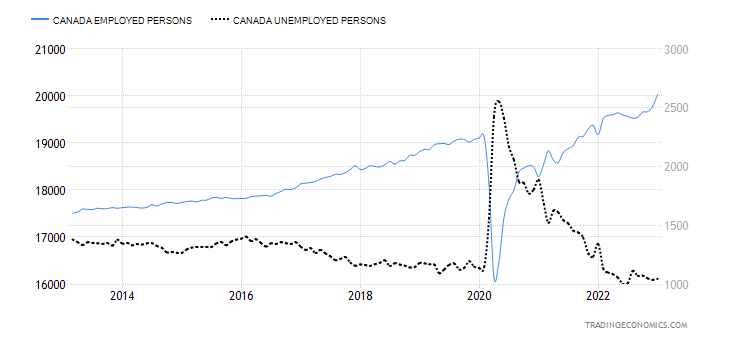
Canada Employed Persons, Unemployed Persons 2013–2023
Source: www.tradingeconomics.com, www.statcan.gc.ca
Despite signs of a softening economy elsewhere, Canada’s job market continues to outperform. Canada created 21,800 jobs in February, once again above the expected 10,000 increase. However, it’s no surprise it was down from the 150,000 jobs in January. The unemployment rate remained steady at 5%. Job increases were seen in health care, public administration, and utilities. Full-time employment leaped 31,100 while part-time employment contracted 9,300. The private sector grew by 39,000 with the drops coming in the public sector and self-employed. The R8 unemployment number (the highest level of unemployment reported by Canada which includes discouraged workers and the waiting group of involuntary part-time workers) slipped to 7.3% from 7.4%. All in all, another good employment report for Canada.
So, what is this going to do to the Bank of Canada (BofC)? Will this end the pause? Or will the events in the U.S. of a regional bank going under change the equation? Bond yields fell in Canada as the 10-year Government of
Canada bond (CGB) has slipped to 2.99% after peaking recently at 3.49%. Gold in Cdn$ has climbed well over $2,500 last at $2,578. Its all-time high is $2,796, set in 2020.
The labour force participation rate (LFPR) remained steady at 65.7%. That’s higher level than the U.S. LFPR leads to a higher level for unemployment. Indeed, while the number of people employed rose 262,000 in January (latest available), the number of people unemployed also rose, up over 9,000.
Markets & Trends
|
|
|
|
% Gains (Losses) Trends |
|
||||
|
|
Close Dec 31/22 |
Close Mar 10/23 |
Week |
YTD |
Daily (Short Term) |
Weekly (Intermediate) |
Monthly (Long Term) |
|
|
Stock Market Indices |
|
|
|
|
|
|
|
|
|
`S&P 500 |
3,839.50 |
3,861.59 |
(4.6)% |
0.6% |
down |
neutral |
neutral |
|
|
Dow Jones Industrials |
33,147.25 |
31,909.646 |
(4.4)% |
(3.7)% |
down |
neutral |
neutral |
|
|
Dow Jones Transport |
13,391.91 |
14,209.01 |
(6.0)% |
6.1% |
down |
up |
up |
|
|
NASDAQ |
10,466.48 |
11,138.89 |
(4.7)% |
6.4% |
down |
neutral |
neutral |
|
|
S&P/TSX Composite |
19,384.92 |
19,774.92 |
(3.9)% |
2.0% |
down |
up (weak) |
up |
|
|
S&P/TSX Venture (CDNX) |
570.27 |
611.49 |
(4.9)% |
7.2% |
down |
neutral |
down (weak) |
|
|
S&P 600 (small) |
1,157.53 |
1,172.34 |
(7.7)% |
1.3% |
down |
neutral |
neutral |
|
|
MSCI World Index |
1,977.74 |
2,078.26 |
0.2% |
5.1% |
down |
up |
neutral |
|
|
Bitcoin |
16,535.23 |
19,944.06 |
(10.8)% |
20.6% |
down |
neutral |
up |
|
|
|
|
|
|
|
|
|
|
|
|
Gold Mining Stock Indices |
|
|
|
|
|
|
|
|
|
Gold Bugs Index (HUI) |
229.75 |
213.77 |
(5.5)% |
(7.0)% |
down |
neutral |
down |
|
|
TSX Gold Index (TGD) |
277.68 |
265.59 |
(3.2)% |
(4.4)% |
down |
neutral |
down |
|
|
|
|
|
|
|
|
|
|
|
|
% |
|
|
|
|
|
|
|
|
|
U.S. 10-Year Treasury Bond yield |
3.88% |
3.69% |
(6.8)% |
(4.9)% |
|
|
|
|
|
Cdn. 10-Year Bond CGB yield |
3.29% |
2.99% |
(10.8)% |
(9.1)% |
|
|
|
|
|
Recession Watch Spreads |
|
|
|
|
|
|
|
|
|
U.S. 2-year 10-year Treasury spread |
(0.55)% |
(0.89)% |
1.1% |
(61.8)% |
|
|
|
|
|
Cdn 2-year 10-year CGB spread |
(0.76)% |
(0.99)% |
(12.5)% |
(30.3)% |
|
|
|
|
|
|
|
|
|
|
|
|
|
|
|
Currencies |
|
|
|
|
|
|
|
|
|
US$ Index |
103.27 |
104.15 |
(0.3)% |
0.9 |
up |
down (weak) |
up |
|
|
Canadian $ |
73.92 |
72.42 |
(1.6)% |
(2.0)% |
down |
down |
down |
|
|
Euro |
107.04 |
106.38 |
0.1% |
(0.6)% |
down |
up |
down |
|
|
Swiss Franc |
108.15 |
108.52 |
1.6% |
0.3% |
up (weak) |
up |
neutral |
|
|
British Pound |
120.96 |
120.27 |
(0.2)% |
(0.6)% |
down (weak) |
down |
down |
|
|
Japanese Yen |
76.27 |
74.13 |
0.7% |
(2.8)% |
down |
neutral |
down |
|
|
|
|
|
|
|
|
|
|
|
|
|
|
|
|
|
|
|
|
|
|
Precious Metals |
|
|
|
|
|
|
|
|
|
Gold |
1,826.20 |
1867.20 |
0.7% |
2.3% |
down (weak) |
up |
up |
|
|
Silver |
24.04 |
20.51 |
(3.4)% |
(14.7)% |
down |
neutral |
down (weak) |
|
|
Platinum |
1,082.90 |
962.20 |
(1.8)% |
(11.2)% |
down (weak) |
neutral |
up |
|
|
|
|
|
|
|
|
|
|
|
|
Base Metals |
|
|
|
|
|
|
|
|
|
Palladium |
1,798.00 |
1,362.30 |
(6.0)% |
(24.2)% |
down |
down |
down |
|
|
Copper |
3.81 |
4.03 |
(1.0)% |
5.8% |
down |
up |
up (weak) |
|
|
|
|
|
|
|
|
|
|
|
|
Energy |
|
|
|
|
|
|
|
|
|
WTI Oil |
80.26 |
76.68 |
(3.8)% |
(4.5)% |
down |
down |
up (weak) |
|
|
Nat Gas |
4.48 |
2.43 |
(19.3)% |
(45.8)% |
down |
down |
down (weak) |
|
Source: www.stockcharts.com
Note: For an explanation of the trends, see the glossary at the end of this article.
New highs/lows refer to new 52-week highs/lows and, in some cases, all-time highs.
Source: www.stockcharts.com
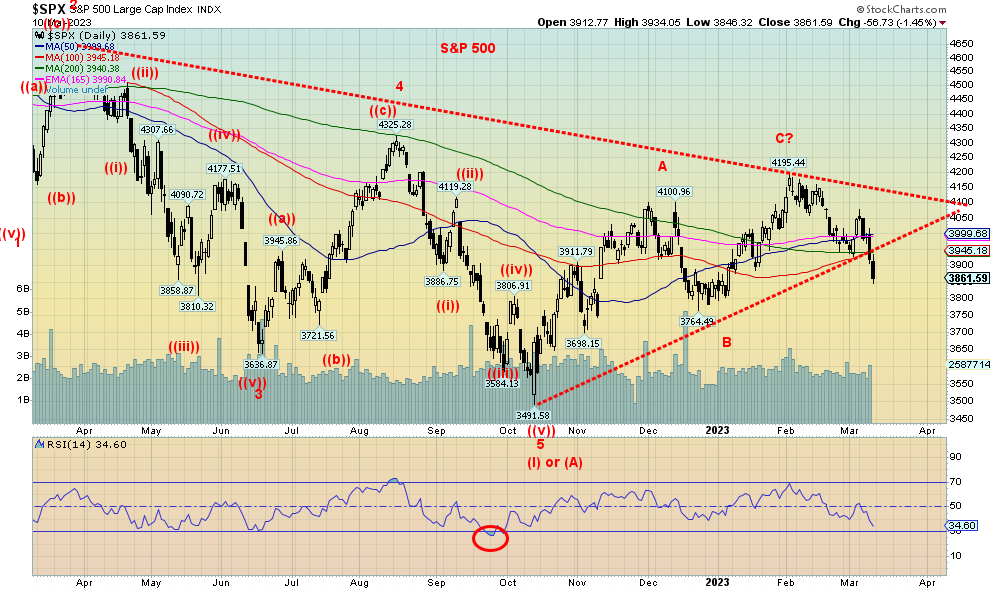
It was the week of a hawkish Jay Powell and SVB Bank. Good jobs report? Who cares? As long as Fed Chair Jerome Powell is hawkish about interest rates and much remains unknown about the collapse of SVB Bank, we are not sure where the market is going. While the Treasury, Fed, FDIC, and bank officials are meeting on the weekend to discuss the collapse of SVB Bank, their biggest concern would be contagion and finding a buyer. Would the Fed suddenly come in and cut rates, flooding the system with liquidity? No, that’s highly unlikely. SVB is big but not that big, even if its bankruptcy will have a significant negative effect on Silicon Valley in California. The state may also come and help. Nonetheless, as we can see, the S&P 500 broke down under its up-trend line, signaling that we may have topped for the time being. Next up is that December low near 3,764 and if that falls, we can start looking at the October low of 3,491.
It was a miserable week of red ink. The S&P 500 fell 4.6% and most of the year’s gains have been wiped out. The Dow Jones Industrials (DJI) dropped 4.4% and the DJI is down on the year by 3.7%. So much for the January effect. The Dow Jones Transportations (DJT) was down 6.0% and the NASDAQ dropped 4.7%. The S&P 400 (Mid) fell 7.4% and the S&P 600 (Small) dropped 7.7%. With those two leading, it doesn’t bode well as they tend to lead both up and down.
In Canada, the TSX Composite fell 3.9% and the TSX Venture Exchange (CDNX) was down 4.9%. In the EU, the London FTSE fell 2.5%, the Paris CAC 40 dropped 1.7%, while the German Dax was off about 1.0% and the EuroNext fell 2.0%. In Asia, China’s Shanghai Index (SSEC) fell about 3.0%, while the Tokyo Nikkei Dow (TKN) bucked the trend, falling sharply on Friday but still managing a gain of 0.8% on the week. Hong Kong’s Hang Send (HSI) was down 6.1% and the MSCI World Index was up 0.2%, but that’s only to March 9.
The cryptos took a hit, as we noted, with some crypto banks collapsing last week in the wake of the SVB collapse. The NY Bitcoin Index fell 10.8%. Bitcoin dropped roughly the same and at one point traded under $20,000 before rebounding. Cryptos for the most part fell, with many down over 15%.
We can’t say the market looks very good. On Friday we started hearing rumblings that the market could crash on Monday. Yes, it could, depending on what happens with SVB Bank on the weekend. However, one thing we know won’t happen is that the U.S. Treasury and Fed are unlikely to act as they did when Lehman Brothers collapsed. This is not (yet) a pivot moment. It depends on the fallout. Many banks are much better capitalized today than they were in 2008. The Lehman Brothers collapse was almost three times the size of the SVB Bank collapse ($620 billion vs. $210 billion). The SVB Bank collapse is more like the Washington Mutual collapse and therefore more localized. The FDIC is prepared to play a role and there could be bail-ins rather than bail-outs.
Still, all of this is a sign that all is not well. Regardless of how we shake out this coming week, especially with the key CPI and PPI coming out, the fallout is sure to linger in the markets for some time.
Source: www.stockcharts.com
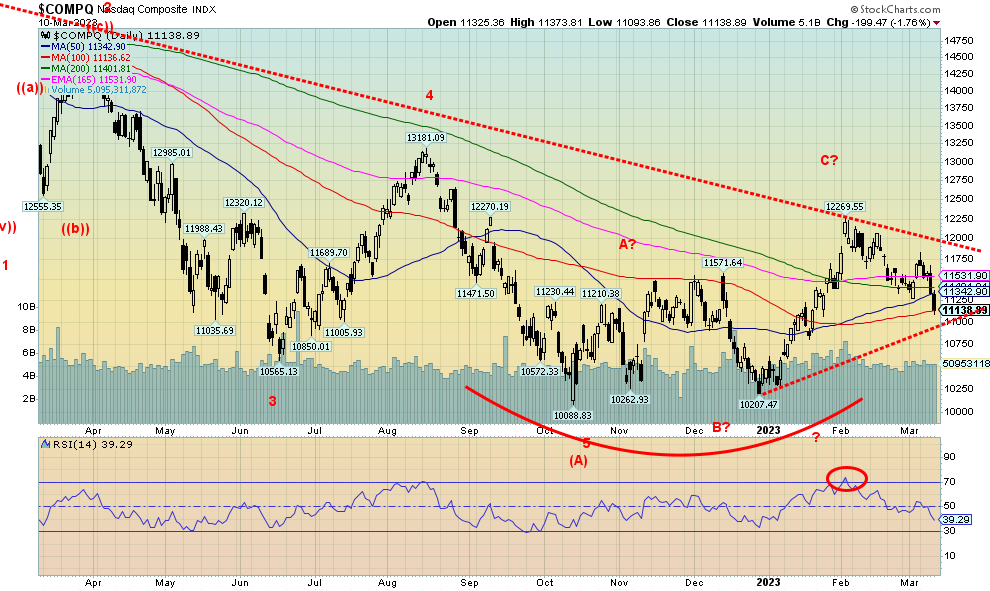
The NASDAQ lost 4.7% while the NY FANG Index dropped 4.4%. The fallout from the collapse of SVB Bank may be just getting underway. Many of the FAANGs are headquartered in Silicon Valley. But what relationship they have with SVB Bank is unknown until more details come out this coming week. Still, the FAANGs didn’t fare well last week with all of them down, led by Baidu off 13.7% and Tesla dropping 12.3%. Netflix fell 7.1%. The smallest loser was Apple, down only 1.7%. While Apple’s headquarters are in Silicon Valley, it’s a huge international company. Some such as Amazon and Meta are not in Silicon Valley, but in Washington and Massachusetts. And, of course, Baidu and Alibaba are centered in China. The NASDAQ has fallen but hasn’t yet broken down. That doesn’t come until the NASDAQ breaks under 11,000. The NASDAQ really doesn’t get into trouble until it breaks under 10,600, as below that new lows become possible. Regaining 11,750 would be positive and above 12,000 we’d be breaking out.
Source: www.stockcharts.com
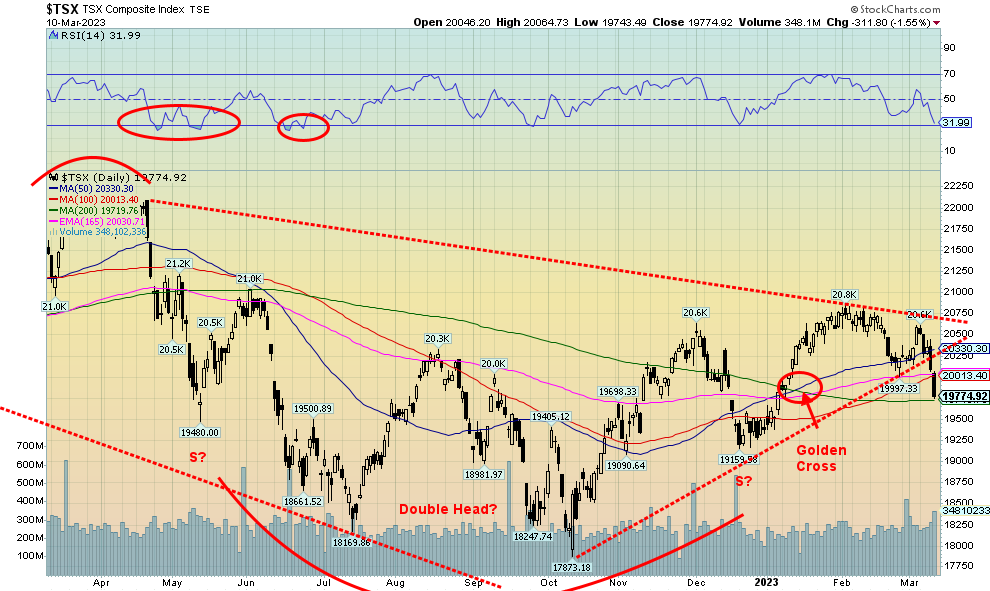
The TSX joined the SVB Bank panic on Friday, falling 1.6% and losing 3.9% on the week. The TSX Venture Exchange (CDNX) wasn’t spared as it fell 4.9% on the week. Not one TSX sub-index was up on the week. It was 14 for 14 down on the week. Leading the way was Metals & Mining (TGM), down 7.2%. Health Care (THC) fell 7.1%, Financials (TFS) dropped 5.1%, and Materials (TMT) was off 5.8%. Energy (TEN) fell 4.1% and Real Estate (TRE) dropped 4.0%. The big winner, or should we say, the smallest loser, was Utilities (TUT), down only 1.4%. The TSX broke its uptrend line and finished the week about on its 200-day MA near 19,700. A firm breakdown under 19,700 could send the index down the recent lows of 19,159. A break of that December low would be trouble and we’d be looking at the October lows of 17,873. A breakdown under 18,860 would suggest that new lows were possible. Only a move now back above 20,500 could change this scenario. However, the expectation is that the fallout from the collapse of SVB bank could continue to impact markets this coming week.
U.S. 10-year Treasury Bond/Canadian 10-year Government Bond (CGB)
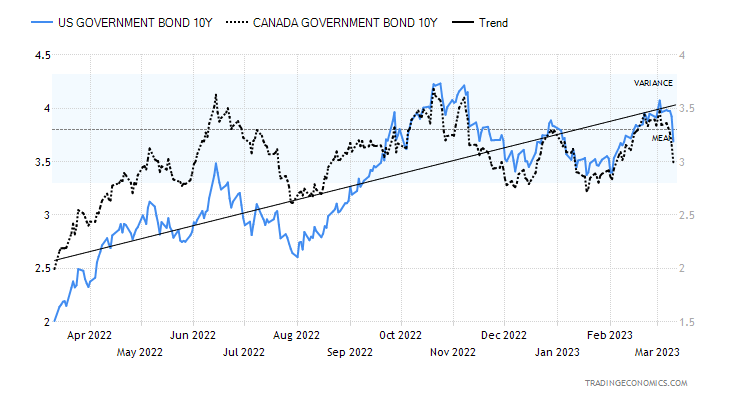
Source: www.tradingeconomics.com, www.home.treasury.gov, www.bankofcanada.ca
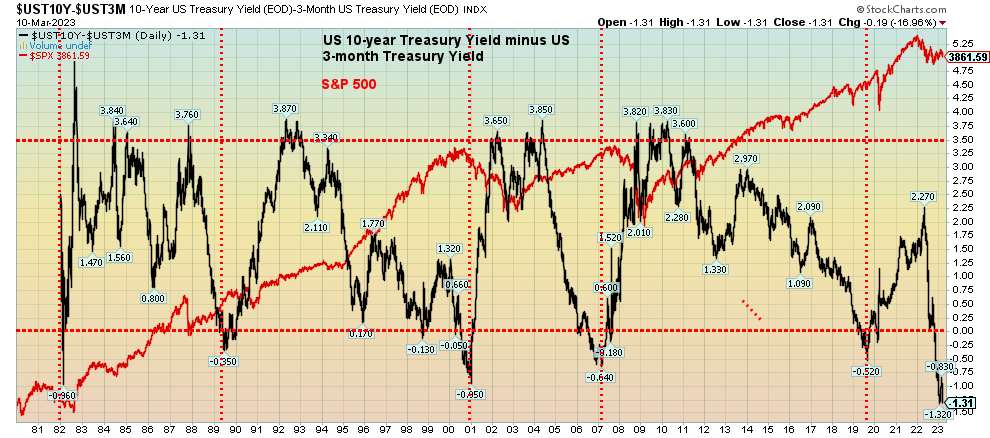
As we have already noted, the collapse of SVB Bank sparked a rally in bonds as U.S. treasury bonds/notes/bills acted as a safe haven along with gold. After peaking at 4.07% on March 2, the 10-year U.S. treasury note yield fell to 3.70% on the back of the SVB collapse. Many thought that the breakout over 4% would spark new high yields. We’ve gone the opposite way. This is now looking like a correction to the first decline in yields when the 10-year fell from 4.23% to 3.40% October/December 2022. A break now under 3.55% could suggest new lows under 3.40%. We’d need to return to back above 4% to suggest higher yields. The yield on the Canadian Government of Canada bond (CGB) also fell to 2.99% after peaking at 3.48%. The inverted yield spreads persist with the 2–10 spread remaining largely unchanged at negative 89 bp. The Canadian 2–10 spread is at negative 99 bp. But what is really stunning is the 3-month–10 year spread that has fallen to negative 131 bp. We haven’t seen it this low since the 1970s. That chart on the next page says it all. But, as we have noted before, a recession doesn’t start until the yield curve begins to normalize. We’re seeing few signs of that. Some forecasts for a recession are actually being pushed out until 2025, although many expect one to start this year. That one is coming is not in doubt; the question is when and how steep.
As we have noted, next week brings us the CPI (Tuesday) and the PPI (Wednesday). The CPI is expected to be up 0.4% in February vs. 0.5% in January. Y-o-y inflation is expected to be 6% vs. 6.4% the previous month. Anything better could spark more bond-buying.
Source: www.stockcharts.com
The rest of the page is blank
Source: www.stockcharts.com
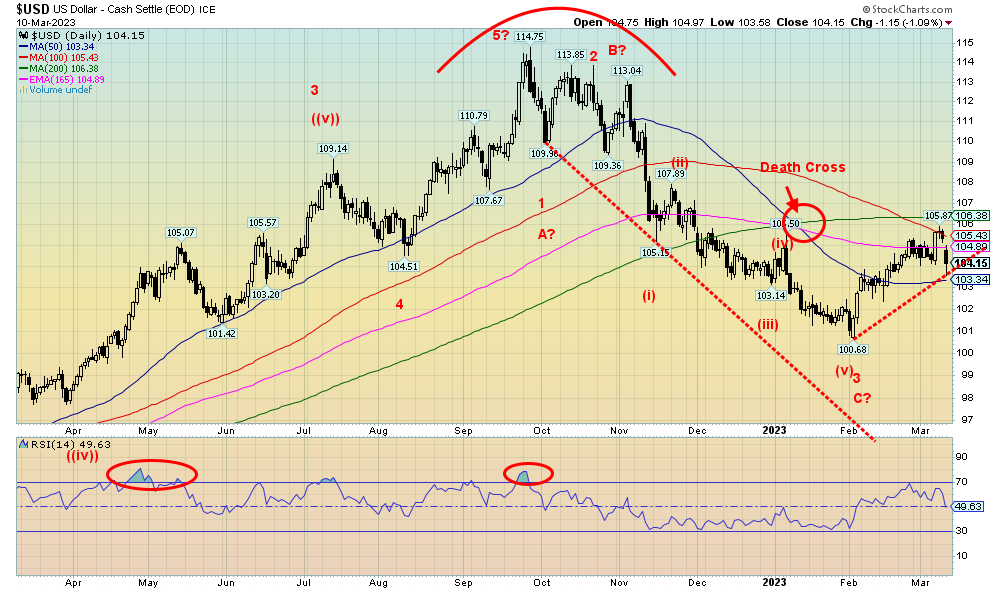
While the stronger-than-expected jobs report should have helped push the US$ Index higher, the collapse of SVB Bank did the opposite and the US$ Index fell. The index lost 0.3% this past week. The euro was essentially flat, up 0.05%, the Swiss franc proved to be a safe haven and rose 1.6%, but the sinking U.K. economy which is a mess saw the pound sterling fall 0.2%. The Japanese yen gained 0.7%, acting as another safe haven, but the Canadian dollar fell a sharp 1.6%. The Canadian dollar was not helped by thoughts the Fed will hike rates while the BofC stands still. As well, energy prices fell this past week, which also hurts the Canadian dollar.
The US$ Index hit resistance just under the 200-day MA near 106.48 (high was 105.87). The index fell, taking out or at least pushing back the uptrend line from the recent lows. However, a breakdown under 103 would signal lower prices. That in turn would be good for gold. However, a return to the upside and breakout above 106.50 would do the opposite and focus us on potential targets next up to 108. The US$ Index is still on a death cross and it hasn’t yet been whipsawed. While fallout from the SVB collapse helped push the US$ Index lower, we note that the Bear Stearns collapse in 2007 sparked a flight to safety of U.S. dollars. It wasn’t until after the Lehman Brothers debacle when they announced zero-percent interest rates and oodles of QE that it sparked a U.S. dollar collapse and a gold rally.
Source: www.stockcharts.com
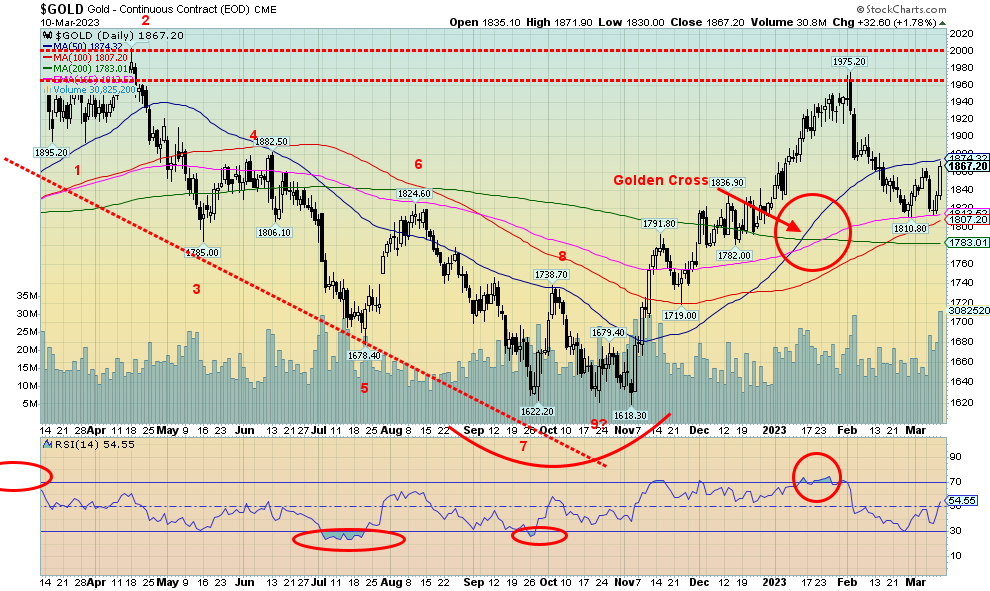
Gold leaped on Friday as the US$ Index fell, bond yields fell, and the market worried about fall-out from the collapse of SVB Bank. Gold closed the day up $32.60 in futures, but was higher again in cash as it closed up $37. Gold also closed over $1,850, suggesting that a low might be in. We’ll need to see follow-through and close over $1,875 to suggest to us that a low may be in. Regardless of this, gold has a lot of work to do to regain $1,900 and break above $1,975. Further resistance would be seen at $2,000. Above $1,900 would suggest new highs above $1,975 and new highs above $1,975 could suggest new highs above the earlier highs of $2,079/$2,089. Gold found support just above the 100-day MA and well above the 200-day MA near $1,783. That’s why we’ve been emphasizing that a breakdown under $1,775 would be quite negative and send us lower towards $1,700. Under $1,675 new lows are probable.
The collapse of SVB Bank eclipsed the higher-than-expected jobs report. Gold is a safe haven along with U.S. treasury bonds/notes/bills. However, silver is considered more an industrial metal although it exhibits similar traits as gold. On the week gold gained 0.7% but silver fell 3.4%. Platinum dropped 1.8%, palladium, an industrial metal, fell 6.0% on recessionary fears, and copper was off 1.0%. The gold stocks fell with the Gold Bugs Index (HUI), down 5.5%, and the TSX Gold Index (TGD), down 3.2%.
The CFTC is slowly catching up with the COT report. It is now up to February 21. But it should be at March 7. Gold’s last commercial COT was at 32%. It has been improving for the past three weeks as short covering kicks in. Open interest has been declining, supporting short covering. The large speculators COT has been falling. What we are not yet seeing on the COT are signs that the bullion banks are getting long.
Gold is slowly improving. But we really need to get above $1,900 to suggest to us that we are moving higher and that a low might be in. While gold overlooked the strong jobs report, we also note gold was pleased to see some modification in wage increases. This coming week brings us the CPI and PPI for another look at inflation. If they continue to modify, that could help gold regain above $1,900.
Source: www.stockcharts.com
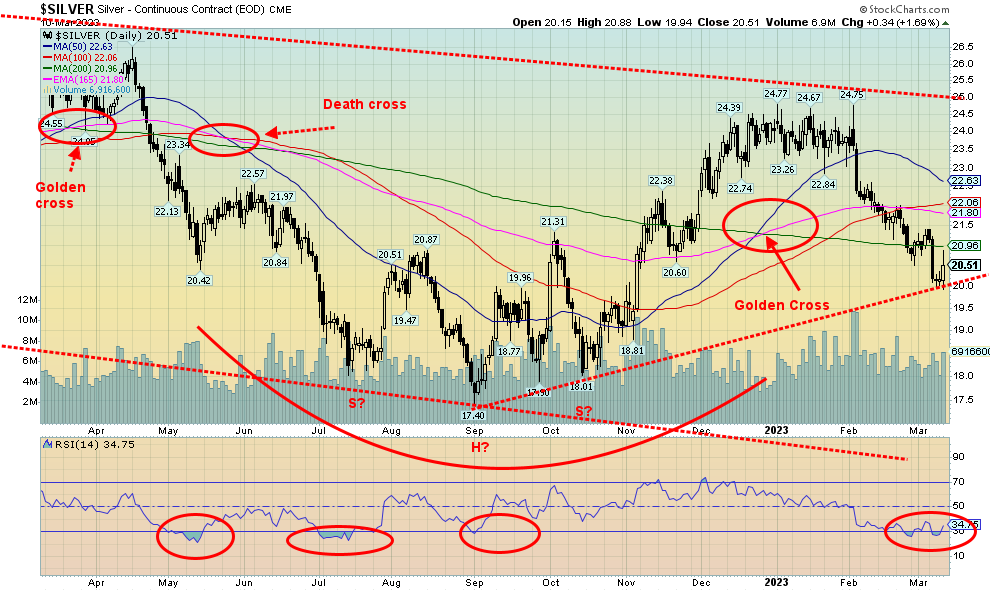
Silver had a nice up day on Friday, along with gold gaining 1.7%. But that didn’t help the week as silver lost 3.4%. Silver was up higher on Friday but faded later in the day and gold managed to eke out a small gain over silver as gold gained 1.8% on Friday. Our preference, of course, is to see silver and the gold stocks leading. But of the three—gold, silver, and gold stocks—gold was the biggest gainer on Friday. Silver came down and is now testing the uptrend line from the September 2022 low. A firm break under 20, however, would be negative and send us lower. Below $18 new lows are highly probable. If gold is considered a safe haven, silver only carries mini-safe haven status. Silver is heavily used in industry and its price often is dependent on supply and demand rather than a rush to a safe haven, unlike gold. Silver is on support but fell below its 200-day MA. It has a lot of work to do and we won’t consider that a low is in until we take out $23. A long-term breakout
occurs above $25. RSI has been quite oversold under 30 but is diverging positively. The commercial COT for silver up to February 21 is at 40%. The commercial COT has been rising steadily for the past five weeks to the last CFTC posting, suggesting short-covering by the bullion banks. Open interest has been falling which supports short-covering. The large speculators COT has been steadily falling as they become more bearish.
Source: www.stockcharts.com
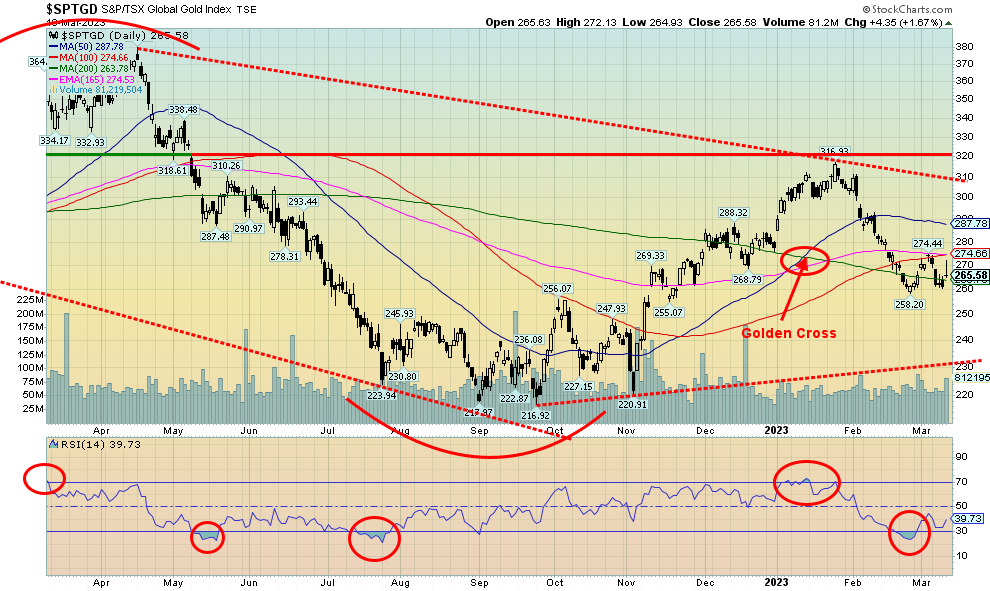
Despite Friday’s big up day for gold and silver, the gold stocks that were higher earlier in the day pulled back as the stock markets sank under the weight of the SVB Bank collapse. Before that, the threat of higher interest rates had weighed on the market and, while gold wound up with a gain on the week, the gold stocks were not so lucky. The TSX Gold Index (TGD) dropped 3.2% and the Gold Bugs Index (HUI) fell 5.5%. Many believe that gold stocks should rise if gold itself is rising. However, if the broader market suffers, gold stocks are liable to suffer as well, regardless of what gold does. Gold stocks, like all stocks, are just paper and they have liability, unlike gold itself which has no liability. What’s key here for the TGD (and the HUI) is we see no new lows below the recent low of 258. If we break that level and especially under 250, we could soon find ourselves testing the September low of 217. A break under 240 would strongly suggest that new lows lie ahead. The recent high was 274 and above that level we could make a run to the 50-day MA near 288. Currently we are resting by the 200-day MA. Long-term support is near 230, but we really don’t want to see us down that low. The TGD doesn’t break out until it is through 310/320. Gold stocks for the most part remain unloved. The Gold Miners Bullish
Percent Index is currently at 34, suggesting we have lots of room to move higher. However, we have lots of room to move lower as well.
Source: www.stockcharts.com
Fed Chairman Jerome Powell’s hawkish comments about potentially higher interest rates for longer sparked concern in the energy markets that it could result in a recession. First, WTI oil looked like it was breaking out and natural gas (NG) appeared to be starting to soar. Except, hold on, we reversed course. Recessionary periods lower the demand for oil and gas. And the next few weeks don’t contain any news that might help
spark a rally, unless something happens in the Gulf.
Iran continues to build its nuclear facilities while Saudi Arabia and Iran, brokered by China, just kissed and made up. That’s bad news for Israel who has openly expressed the desire to eliminate Iran’s nuclear capabilities. Could something happen to distract what many are calling a coup in Israel as the Netanyahu government tightens its grip and social unrest explodes on the streets? Attacking Iran would create a diversion; however, Iran is at the center of the Straits of Hormuz where upwards of 30% of the world’s oil passes through. While this is straight speculation on our part, all of this has been talked about in Middle East and Israeli newspapers.
WTI oil fell 3.8%, Brent crude was off 3.4%, natural gas at the Henry Hub fell a sharp 19.3%, but EU NG at the Dutch Hub leaped 17.5% as concerns rose about LNG terminals shutting in France. Oddly, the week before, it was the opposite as NG at the Henry Hub soared while the Dutch Hub NG fell sharply. The energy stocks didn’t fare well as the ARCA Oil & Gas Index (XOI) dropped 5.5% and the TSX Energy Index (TEN) was off 4.1%.
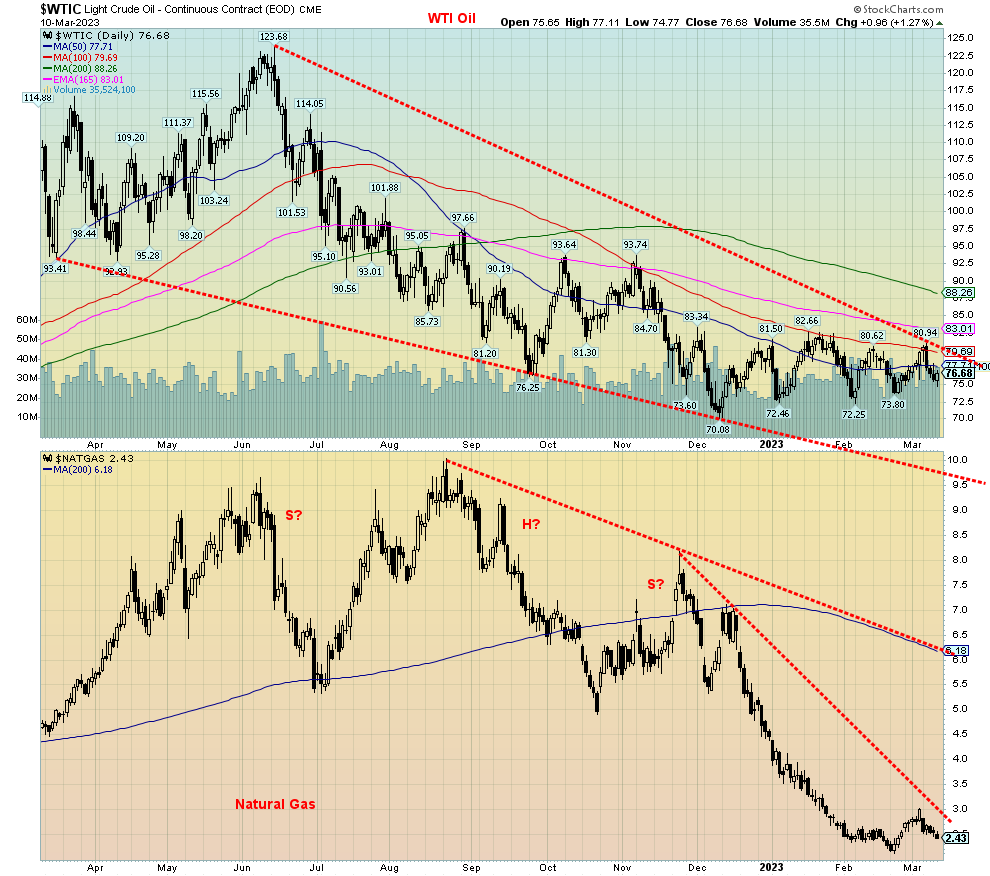
WTI oil is giving us a series of false breakouts—meaning, it breaks the downtrend line but has little follow-through, then it reverses and goes back down. We got as high last time just under $81 before fading. However, we could be forming an ascending triangle with a series of rising lows ($70.08, $72.46, $72.25, and $73.80) and relatively flat highs roughly between $80.60 and $82.60. A firm breakout above the highest point at $82.66 could spark a rise towards potential targets up to $95. Lows noted must hold.
NG could be going back down to test the recent low at $2.11. Otherwise, we need to break out over $3.00 to suggest higher prices. Both oil and NG stocks have been rising, but the rise is beginning to reach the top end from where they have turned down in the past.
WTI oil continues to look like it is trying to create a bottom and NG is retesting the lows. However, with NG we cannot rule out new lows first.
Copyright David Chapman 2023
About the author


Website: https://www.enrichedinvesting.com
Disclaimer: David Chapman is not a registered advisory service and is not an exempt market dealer (EMD) nor a licensed financial advisor. We do not and cannot give individualised market advice. David Chapman has worked in the financial industry for over 40 years including large financial corporations, banks, and investment dealers. The information in this newsletter is intended only for informational and educational purposes. It should not be considered a solicitation of an offer or sale of any security. The reader assumes all risk when trading in securities and David Chapman advises consulting a licensed professional financial advisor before proceeding with any trade or idea presented in this newsletter. David Chapman may own shares in companies mentioned in this newsletter. We share our ideas and opinions for informational and educational purposes only and expect the reader to perform due diligence before considering a position in any security. That includes consulting with your own licensed professional financial advisor.