
It is a sobering fact that the prominence of central banks in this century has coincided with a general tendency towards more inflation, not less. [I]f the overriding objective is price stability, we did better with the nineteenth-century gold standard and passive central banks, with currency boards, or even with ‘free banking.’ The truly unique power of a central bank, after all, is the power to create money, and ultimately the power to create is the power to destroy.
—Paul Volcker, American economist, served two terms as 12th Chair of the Federal Reserve 1979–1987, Chairman of Economic Recovery Advisory Board 2009–2011; 1927–2019
“Over the long run, the price of gold approximates the total amount of money in circulation divided by the size of the gold stock. If the market price of gold moves a long way from this level, it may indicate a buying or selling opportunity.”
—Ray Dalio, American billionaire investor, hedge fund manager, co-chief Bridgewater Associates since 1985, founder of Bridgewater in 1975; b. 1949
"The most contrarian thing of all is not to oppose the crowd but to think for yourself."
—Peter Thiel, German-American billionaire, entrepreneur, philanthropist, co-founder PayPal, Palantir Technologies, and Founders Fund, outside investor in Facebook; b. 1967
Trillionaires and billionaires
Tesla (TSLA) has joined the trillion-dollar club by market cap. It is exalted air space given they are only the sixth to do so. The other companies in the trillion-dollar club are, in order, according to Companies Market Cap (www.companiesmarketcap.com): Apple (AAPL), Microsoft (MSFT), Saudi Aramco (2222.SR), Alphabet aka Google (GOOG), and Amazon (AMZN). With Tesla joining the trillion-dollar club, its biggest shareholder, Elon Musk, has seen his world-leading net worth rise to $278.8 billion according to the Forbes real-time billionaire list (www.forbes.com). Setting aside Saudi Aramco, Tesla’s rise to the trillion-dollar club is the fastest—a total of 4,136 days from the time of its IPO. Saudi Aramco, who went public on December 11, 2019, became a trillion-dollar company after only one day of trading. It took Apple 13,747 days to become a trillion-dollar company—37.7 years.
It’s not easy being a member of the trillion-dollar club. Ask Facebook (FB), or should we say Meta. Facebook fell out of the trillion-dollar club between June and September, thanks to a series of controversies centered around whistleblower Frances Haugen. Tesla’s rise to the trillion-dollar club was helped by an order of 100,000 Tesla cars from car rental company Hertz (HTCC), a company still struggling to come out of bankruptcy. Tesla’s rise is even more amazing considering its earnings don’t even put it in the top 25 of companies generating the most revenue. Its rank is 196. But Tesla is now so big it is by market cap bigger than other top nine carmakers in the world, according to the Financial Times (www.ft.com). Tesla is the carmaker of carmakers.
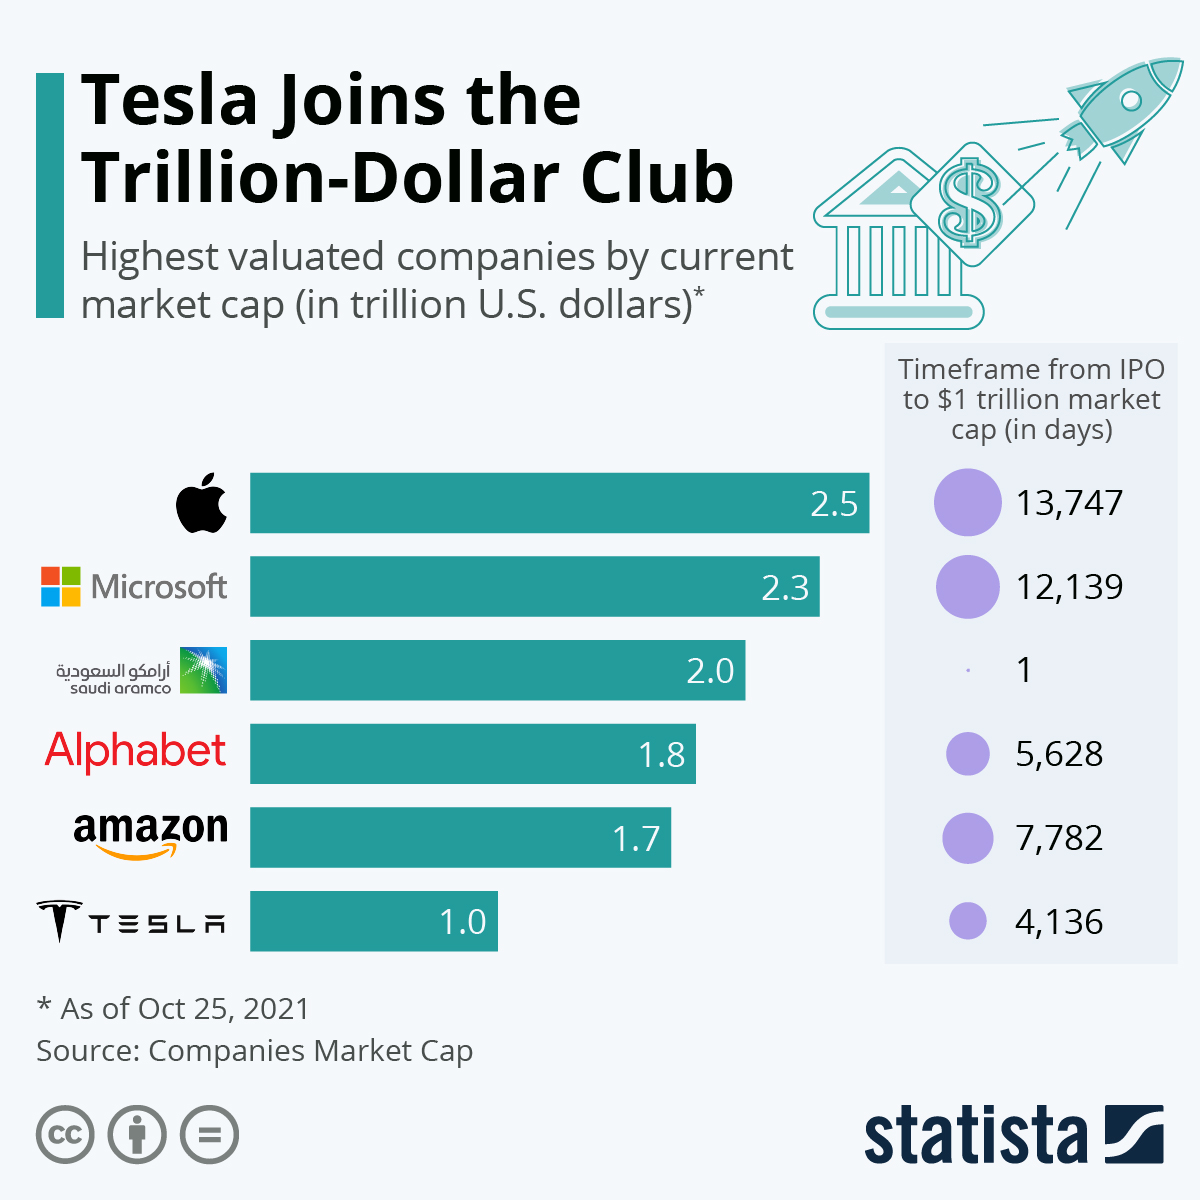
Source: www.statista.com
In joining the trillion-dollar club we are reminded that these companies are now bigger than most countries. If the market cap of a company is to be compared to a country’s GDP, then they are truly economic giants. According to the International Monetary Fund (IMF) (www.imf.org), there are only 17 countries with a GDP greater than $1 trillion. There are now six companies that could join them. Amazon, with a market cap of $2.46 trillion would now rank as the eighth largest country in the world, just behind France and ahead of Italy, Canada, South Korea, and more (all measured in U.S. dollars). Tesla, having just joined the trillion-dollar club, would bring up the rear but that would still make them the twenty-third largest country/company in the world. Tesla may actually be higher with a market cap of $1.062 trillion, which could put it slightly ahead of the Netherlands with a 2021 GDP estimate of $1.012 trillion.
Source: www.stockcharts.com
If one thinks Tesla’s position in the world is amazing, what might be considered even more amazing is the position of the billionaires vs. countries. Elon Musk’s estimated net worth of $278.8 billion would place him at about number 53, ahead of the Czech Republic, Portugal, New Zealand, and Peru. Companies as big as countries. Billionaires as big as countries. According to the Forbes’ billionaire list, there are 11 billionaires worth $100 billion or more. Even the smallest $100 billion-plus billionaire would be larger than Ethiopia, Sri Lanka, and the Dominican Republic. The three rank 66, 67, and 68 in GDP 2021 estimate in the world.
What does it all mean with companies bigger than countries and billionaires bigger than countries? Amazon employs 1.3 million people worldwide. With a market cap of $1.715 trillion that implies a market cap/capita of almost $1.3 million. The typical Amazon warehouse worker makes roughly U.S.$17/hour, in a range $13–$24/hour or based on a 40-hour week just over $35 thousand/year, range $27,000–50, 000/year. Apple with a market cap of $2.461 trillion employs considerably less, about 147,000. That implies potentially a market cap/employee of $16.7 million. The U.S. has a GDP/capita of roughly $68,000; Canada about $50,000. Given that Elon Musk is only one person, his net worth/capita is $278.8 billion. Inequality is a major concern in many countries. If money is power, then Amazon, Apple, and even Tesla and Elon Musk could command more power than most countries.
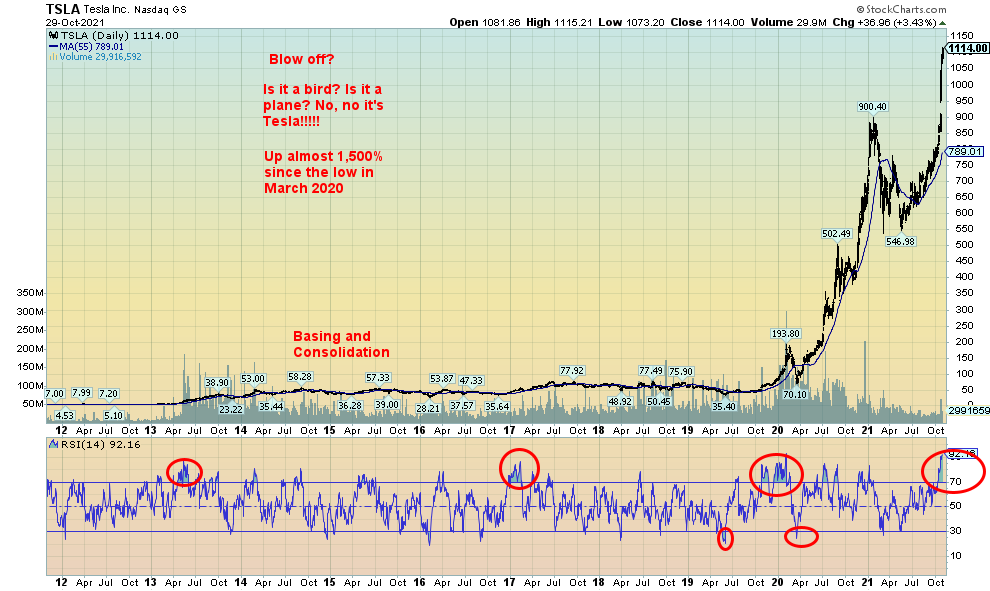
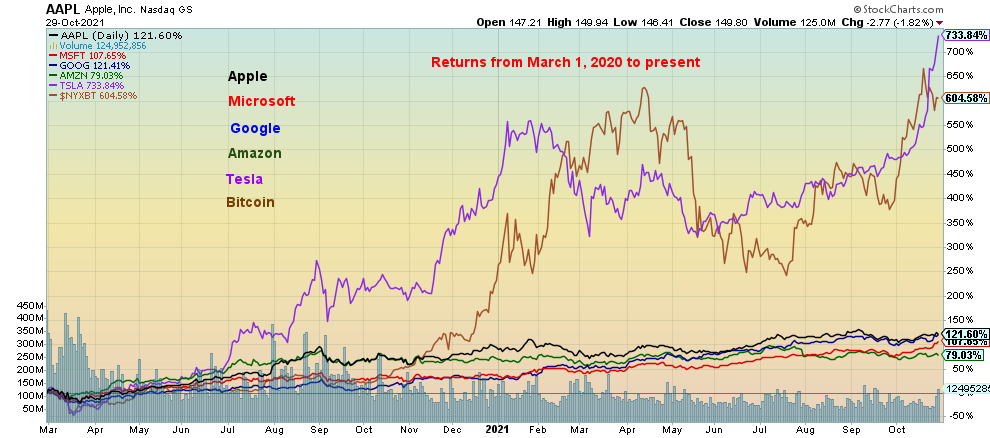
Since March 1, 2020 Tesla has led the trillion-dollar companies with an impressive return of about 734%. Only Bitcoin has come close, up roughly 604%. Google followed with a return of 121% and, as well Apple up 121%, Microsoft up 108%, and Amazon up 79%. By comparison the S&P 500 is up only 56%, the TSX up 29%, and gold up 14%. Is Tesla in a bubble? In looking at Tesla’s chart there is a technical argument suggesting that Tesla could rise even further. That is despite the current 90% + RSI, a somewhat unheard-of level to reach. Potential targets, based on a swing from the January 25, 2021 high at $900.40 to the March 5, 2021 low at $539.49, suggest that Tesla could reach targets up to $1,261, which is not that far away. The caveat is if Tesla were to fall back below the earlier high near $900 then the odds would favour that the big rally is over.
Source: www.stockcharts.com
Tesla in a bubble? Tesla and Elon Musk poster children for inequality? All of the above? But what if Tesla falters? The fall might be as spectacular as the rise. This time is different? Probably not.
Chart of the Week
Source: www.stockcharts.com
It’s Family Feud, Succession, and Game of Thrones all rolled into one. How will it all end? For the past couple of weeks, the ongoing soap opera for control of Rogers Communications (RCI.A, RCI.B) has been a daily saga in our news. Even U.S. news has noted the goings-on. Who’s in charge? Who’s on first? That the feud involves various factions of the family makes for its riveting, soap opera-like atmosphere. Will the TV movie of the week follow?
Rogers Communications is described as a diversified communications and media company. The Company provides wireless communications services and cable television, Internet, information technology (IT), and telephony services to consumers and businesses. Its segments include Wireless, Cable, and Media. Included in the media properties are sports and entertainment, multi-platform shopping, digital media and publishing. Its sports teams include a 37.5% stake in Maple Leaf Sports & Entertainment that holds the Toronto Maple Leafs (NHL), Toronto Raptors (NBA), Toronto FC (MLS), Toronto Argonauts (CFL), and minor pro teams Toronto Marlies (AHL), Raptors 905 (NBA-G), Toronto FC II (USL), and TFC Academy. Plus, they own the Toronto Blue Jays (MLB) along with the sports channels that show all of their games. It’s a vast media and entertainment empire. They were adding to that with their proposed $26 billion purchase of Shaw Communications (SJR.A, SJR.B).
By most accounts, Rogers is a solid company. The problem is its share structure. The Rogers family trust owns 97% of the class A (RCI.A) voting shares. They also own 9.89% of the class B shares (RCI.B) that pay dividends but do not have voting rights. Family members make up a disproportionate share of the board seats. The result is, with the death of the patriarch Ted Rogers, a family feud for control of the company has broken out in a very public manner. Note entrenched boards, inferior classes of shareholders, lack of accountability around the board table, and few checks and balances as the board is elected by the controlling shareholder, the family trust. Mother, brother, and sisters are effectively at each other’s throat. Game of Thrones, step aside.
Despite the dual class share structure, few companies have descended to this level of acrimony. The last one we remember was Magna International (MG). Rogers, along with BCE Inc. (BCE) and Telus Corp. (T), are the big three of telecommunications in Canada. Rogers Communications is a sound company (24,000 employees), but the family feud is threatening to undo a lot of good will. Both sides are claiming control and dismissing the other side as illegitimate. In other words—who’s in charge? Nobody!
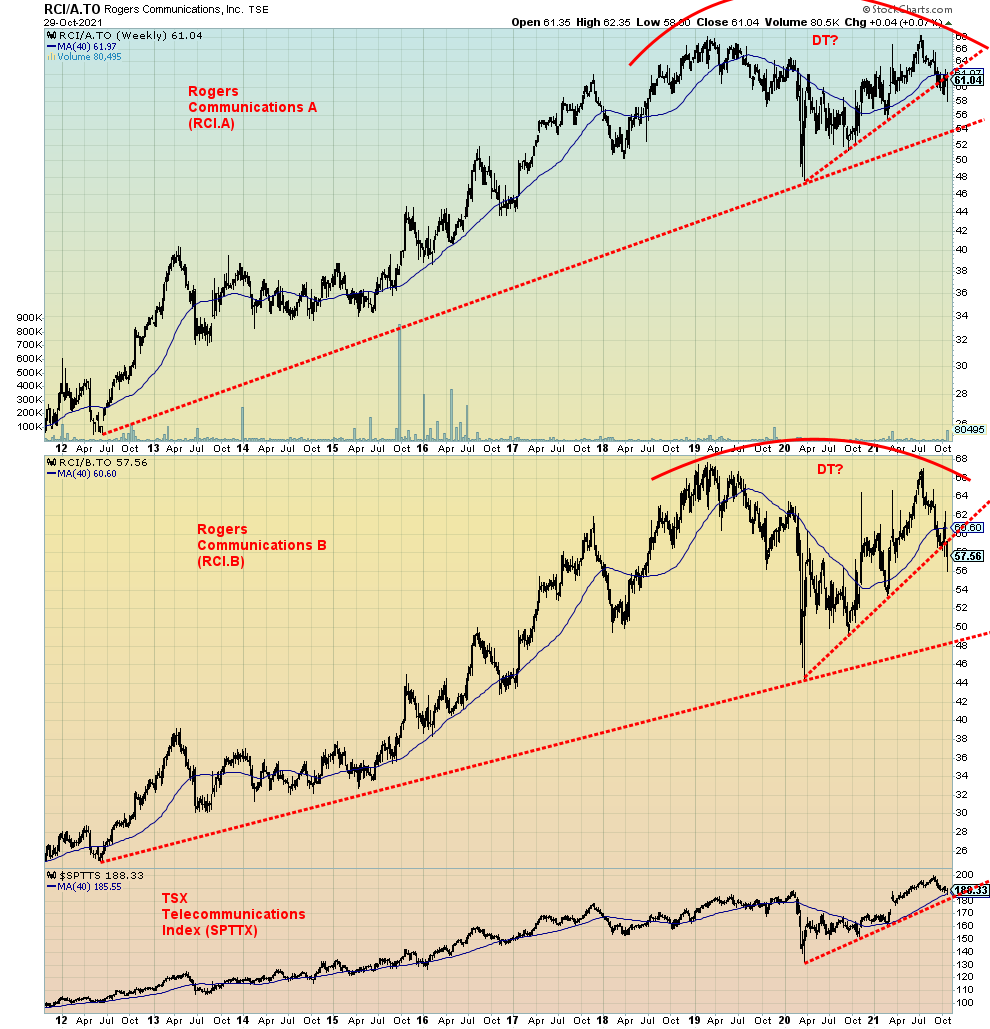
Our task is to look at the technicals to see if they give any clues as to future direction. Both the A and B shares for Rogers are down only about 11% to 14% from their recent high seen in July 2021. Indeed, the stock has been trying to bounce back. Volume on the recent sell-off was high while the bounce-back has seen sharply reduced volume. Daily indicators are not particularly oversold, indicating there is more downside potential. The biggest thing that is noticeable is the potential double top on the charts. That could prove to be problematic if the A shares were to break down under $55 and the B shares under $51.25. That would put the March 2020 low in the crosshairs. For the A shares that is at $48.10, for the B $41.50. Potential downside targets could then become $35 for the A shares and $28 for the B shares. Not pretty.
If the A shares were to regain back above $63 and the B shares above $62.50, then it might suggest that the worst is over. But, given the current boardroom family feud wars, Rogers does not look like a safe bet at this time. Indicators reaching deep oversold levels could, however, present a potential good entry point. At current levels Rogers does offer an attractive 3.3% dividend yield. Given that the company itself appears solid by most accounts that in itself is not bad. However, given all the controversy, investors may wish to look elsewhere in the telecommunications sector. BCE, for example, is like the Energizer Bunny and pays a 5.4% yield.
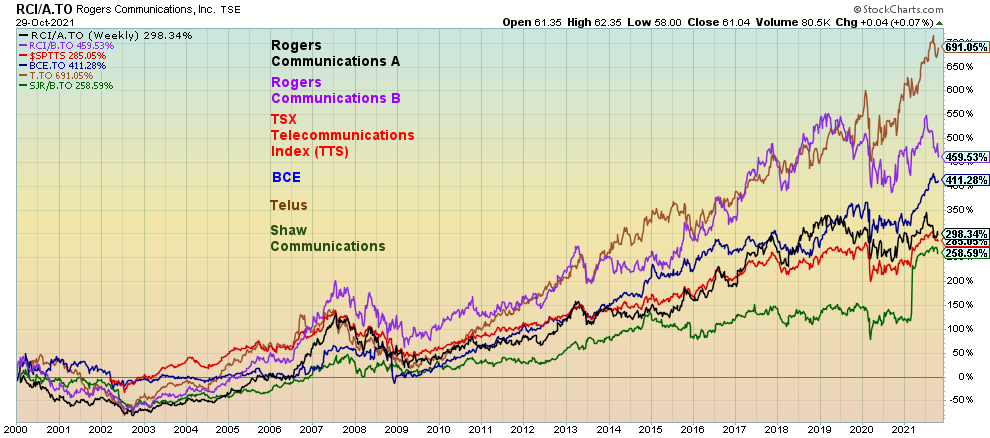
The TSX Telecommunications Index (TTS) has been a strong performer in this century, returning 287%. Leading the way has been Telus Corp., up 691%. Rogers Communications B has returned 459% while the A shares are up 298%, but both are clearly down from their peak return seen in 2018. The weakest of this group has been Shaw Communications, up 259% with the bulk of the improvement coming when it was learned that Rogers was going to take them over. As to that deal now, well, the current family feud could in a worst case see the deal unravel with potentially negative consequences for both sides.
Source: www.stockcharts.com
MARKETS AND TRENDS
|
|
|
|
% Gains (Losses) Trends
|
|||||
|
|
Close Dec 31/20 |
Close Oct 29/21 |
Week |
YTD |
Daily (Short Term) |
Weekly (Intermediate) |
Monthly (Long Term) |
|
|
Stock Market Indices |
|
|
|
|
|
|
|
|
|
S&P 500 |
3,756.07 |
4,605.36 (new highs) |
1.3% |
22.6% |
up |
up |
up |
|
|
Dow Jones Industrials |
30,606.48 |
35,819.36 (new highs) |
0.4% |
17.0% |
up |
up |
up |
|
|
Dow Jones Transports |
12,506.93 |
15,906.58 |
0.9% |
27.2% |
up |
up |
up |
|
|
NASDAQ |
12,888.28 |
15,498.39 (new highs) |
2.7% |
20.3% |
up |
up |
up |
|
|
S&P/TSX Composite |
17,433.36 |
21,037.37 (new highs) |
(0.8)% |
20.7% |
up |
up |
up |
|
|
S&P/TSX Venture (CDNX) |
875.36 |
950.43 |
0.2% |
8.6% |
up |
neutral |
up |
|
|
S&P 600 |
1,118.93 |
1,376.46 |
(0.3)% |
23.0% |
up |
up |
up |
|
|
MSCI World Index |
2,140.71 |
2,279.27 |
0.9% |
11.1% |
up |
up |
up |
|
|
NYSE Bitcoin Index |
28,775.36 |
61,189.21 |
(0.6)% |
112.6% |
up |
up |
up |
|
|
|
|
|
|
|
|
|
|
|
|
Gold Mining Stock Indices |
|
|
|
|
|
|
|
|
|
Gold Bugs Index (HUI) |
299.64 |
248.89 |
(4.2)% |
(16.9)% |
up (weak) |
down |
neutral |
|
|
TSX Gold Index (TGD) |
315.29 |
273.61 |
(4.3)% |
(13.2)% |
neutral |
down |
neutral |
|
|
|
|
|
|
|
|
|
|
|
|
Fixed Income Yields/Spreads |
|
|
|
|
|
|
|
|
|
U.S. 10-Year Treasury Bond yield |
0.91 |
1.56% |
(4.9)% |
71.4% |
|
|
|
|
|
Cdn. 10-Year Bond CGB yield |
0.68 |
1.72% |
4.2% |
152.9% |
|
|
|
|
|
Recession Watch Spreads |
|
|
|
|
|
|
|
|
|
U.S. 2-year 10-year Treasury spread |
0.79 |
1.07% |
(9.3)% |
35.4% |
|
|
|
|
|
Cdn 2-year 10-year CGB spread |
0.48 |
0.64% |
(16.9)% |
33.3% |
|
|
|
|
|
|
|
|
|
|
|
|
|
|
|
Currencies |
|
|
|
|
|
|
|
|
|
US$ Index |
89.89 |
94.12 |
0.5% |
4.7% |
up (weak) |
up |
down (weak) |
|
|
Canadian $ |
0.7830 |
0.8081 |
(0.1)% |
3.2% |
up |
up (weak) |
up |
|
|
Euro |
122.39 |
115.64 |
(0.7)% |
(5.5)% |
down |
down |
up |
|
|
Swiss Franc |
113.14 |
109.26 |
0.1% |
(3.4)% |
up |
neutral |
up |
|
|
British Pound |
136.72 |
136.92 |
(0.8)% |
0.2% |
neutral |
down |
up |
|
|
Japanese Yen |
96.87 |
87.74 |
(0.4)% |
(9.4)% |
down |
down |
down |
|
|
|
|
|
|
|
|
|
|
|
|
Precious Metals |
|
|
|
|
|
|
|
|
|
Gold |
1,895.10 |
1,783.90 |
(0.1)% |
(7.3)% |
up (weak) |
neutral |
up |
|
|
Silver |
26.41 |
23.95 |
(2.0)% |
(9.3)% |
up |
down |
up |
|
|
Platinum |
1,079.20 |
1,020.70 |
(3.0)% |
(5.4)% |
up |
down |
up |
|
|
|
|
|
|
|
|
|
|
|
|
Base Metals |
|
|
|
|
|
|
|
|
|
Palladium |
2,453.80 |
1,980.30 |
(2.7)% |
(19.3)% |
down (weak) |
down |
neutral |
|
|
Copper |
3.52 |
4.37 |
(2.9)% |
24.1% |
neutral |
up |
up |
|
|
|
|
|
|
|
|
|
|
|
|
Energy |
|
|
|
|
|
|
|
|
|
WTI Oil |
48.52 |
83.57 (new highs) |
(0.2)% |
72.2% |
up |
up |
up |
|
|
Natural Gas |
2.54 |
5.43 |
(0.6)% |
113.8% |
up |
up |
up |
|
Source: www.stockcharts.com, David Chapman
Note: For an explanation of the trends, see the glossary at the end of this article.
New highs/lows refer to new 52-week highs/lows and in some cases all-time highs.
Source: www.stockcharts.com
“I want to, I want to, I want to take you higher, I wanna take you higher…” (with apologies to Sly and the Family Stone). Or maybe it should be “Fly me to the moon” (sorry Frank Sinatra). Markets just keep chugging higher and even we wonder whether we are set up for a blow-off top. After all, the period from November to January is considered the best three months of the year. November ranks number 2, December ranks number 3, and January number 4. November also marks the start of the best six months. Since 1950 $1 would have grown to $103 before dividends etc. As to the bad months May to October, $1 would only have grown to $2.38 before dividends etc.
The best month of the year is April that also concludes the best six months. Buy when it snows, sell when it goes. We also have the Thanksgiving rally just after Thanksgiving (only 17 losing years in the past 68) and the Santa Claus rally which usually occurs in the latter part of December into early January. To keep us sober, we do remember December 2018—that’s when the S&P 500 fell 20% from September to December before a strong rally got underway that took us to February 2020 with one corrective period in between (May/June 2019).
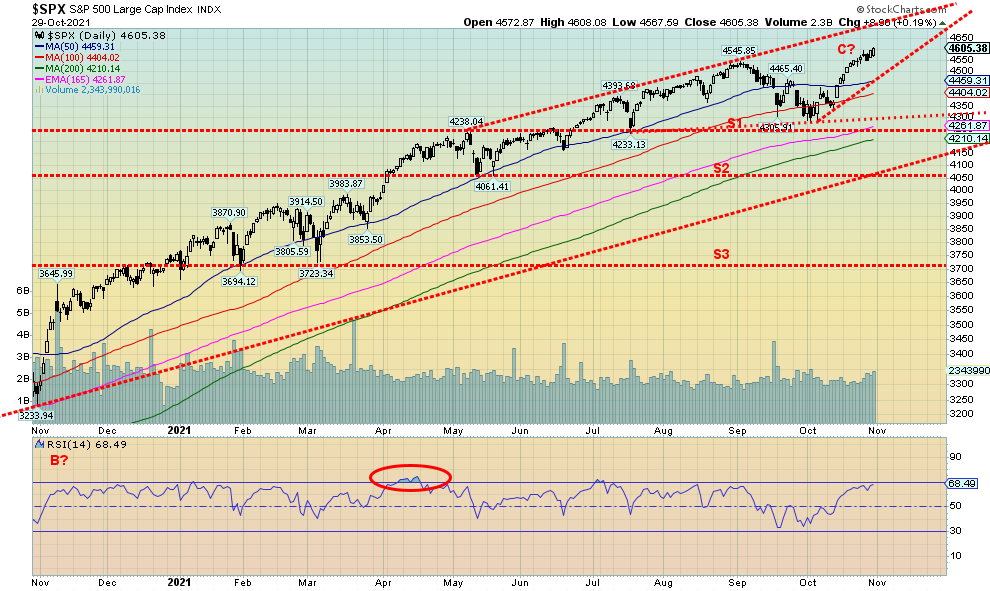
This past week the S&P 500 soared once again to new all-time highs, gaining 1.3%. The Dow Jones Industrials (DJI) also made new all-time highs, up 0.4%. The Dow Jones Transportations (DJT) gained 0.9% but has so far not made new all-time highs. However, it is getting close, being one of the stronger indices of late. The NASDAQ gained 2.7% to new all-time highs. The small cap S&P 600 did not make new all-time highs and actually fell 0.3%. Others making all-time highs included the Value Line Index, the NYSE Composite, the AMEX, the Dow Jones Composite (DJC), NASDAQ 100, S&P 100 (OEX), S&P 400 (MID), the Wilshire 5000, and the Russell 1000 and 3000. The TSX Composite joined the parade to new all-time highs but then reversed and closed down 0.8%. The small cap TSX Venture Exchange (CDNX) gained a small 0.2%.
In the EU, the London FTSE gained a small 0.1%, the Paris CAC 40 was up 1.4%, and the German DAX gained 0.9%. In Asia, China’s Shanghai Exchange (SSEC) fell 1.0%, but the Tokyo Nikkei Dow (TKN) gained 0.3%. None of them made all-time highs.
One reason we think we could see a melt-up is that the recent rally was an impulse wave. That implies higher prices to us. The question becomes—where does it end? That’s harder to predict, but given the positive seasonals we could be sharply higher into January. We could be starting to form a wedge triangle but so far that is inconclusive. The top of the channel for the S&P 500 is currently up around 4,700. Support is down to around 4,460. A break of that level could spark a sharper sell-off. However, we see little evidence that might occur. Below that there is good support to 4,300 and 4,250.
This week brings us the FOMC on November 2–3 and on Friday the employment numbers (discussed under bonds). Things could get interesting.
Source: www.stockcharts.com
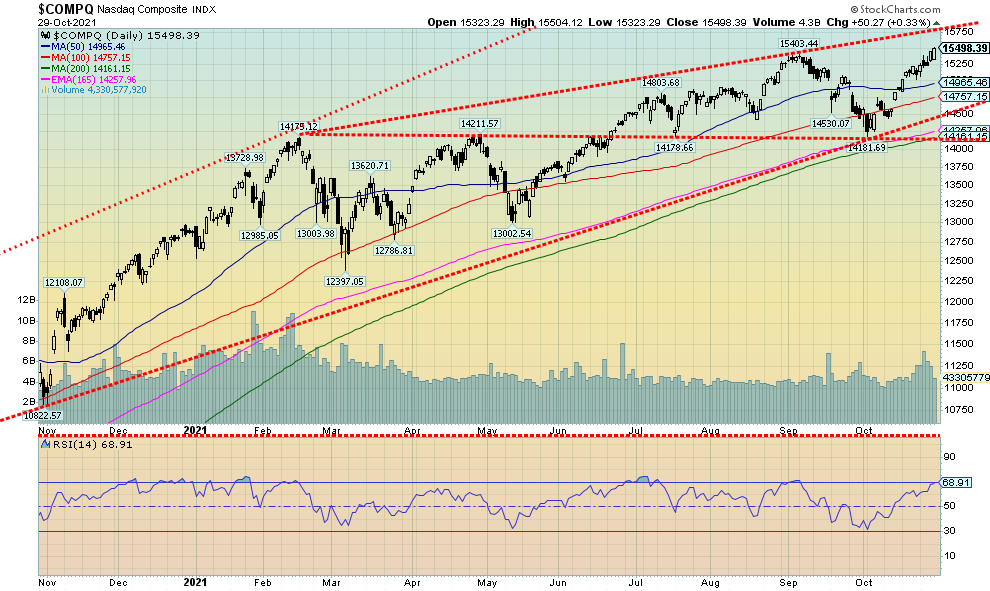
The NASDAQ followed the S&P 500 and the DJI to new all-time highs this past week with its gain of 2.7%. The NASDAQ is now up 20.3% on the year. The big leaders have been the FAANGs-plus. This week five of them made new all-time or 52-week highs. They were Netflix +3.8%, Google +7.0%, Microsoft +7.3%, Tesla +22.5%, and Nvidia +12.5%. Also gaining were Apple +0.8% and Amazon +1.1%. Significantly, Facebook, or should we now say Meta, fell 0.3%. Joining the down parade were Twitter -14.0%, Baidu -8.7%, and Alibaba -7.2%. The latter two are Chinese-based companies and all of them have had problems of late. The NASDAQ has room to run higher to the top of the channel, currently near 15,750. Support ranges down to 15,000 while major support ranges down to 14,500. Under 14,100 would spell trouble.
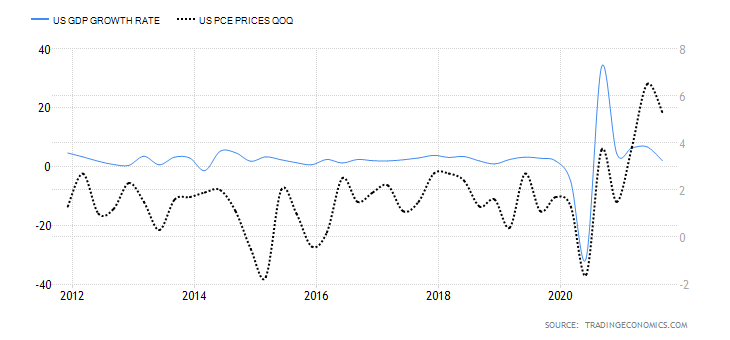
GDP Growth Rate, PCE Prices 2012–2021
Source: www.tradingeconomics.com, www.bea.gov
Q3 GDP growth disappointed while personal consumption expenditures (PCE) rose faster than consensus. Q3 (advance) GDP came in at 2% while the market had expected at least 2.7%. The previous quarter Q2 was reported at 6.7%. The Economist’s 2021 GDP forecast is still at 6%, but one now wonders whether economists will start to revise GDP forecasts downward. Nonetheless, GDP is now pointed downward and returning to levels consistently seen in the past decade before the pandemic recession. Not so prices as PCE prices Q3 advance came in at 5.3%, well above the forecast of 4.2%. The previous quarter saw prices rise 6.5% so the lower number this past quarter was welcomed. Core PCE prices Q3 advance (less food and energy) rose 4.5% which was as expected and again was lower than Q2 that came in at 6.1%. The Fed pays more attention to the core PCE. Nonetheless, lower than expected GDP plus higher than expected PCE prices (inflation) still spells potential stagflation to us.
Elsewhere, personal income for September fell 1% which was sharply below the consensus of a 0.2% gain while personal spending rose 0.6% as expected. Income down, spending up. That is unlikely to continue. The Michigan Consumer Sentiment Index (final) for October was 71.7, slightly above the consensus of 71.4 but below September’s 72.8. In July, the Michigan Consumer Sentiment Index was at 81.2 and peaked last April at 88.8. The conclusion for us is that the numbers still point to a weaker than expected economy that could fall back into recession even as inflation rises. In other words, stagflation. Note, we do not say hyperinflation as some love to pronounce. In no way shape or form is this hyperinflation. Hyperinflation might be money supply M1 that has soared 300% since 2019.
M1 Money Supply 2000–2021
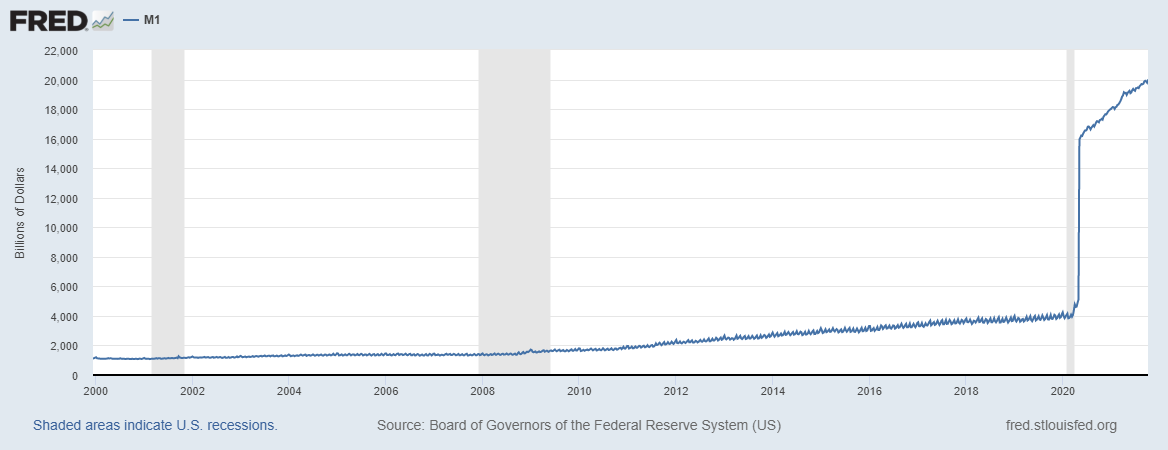
Source: www.stlouisfed.org
Velocity of M1 Money Stock 2000–2021
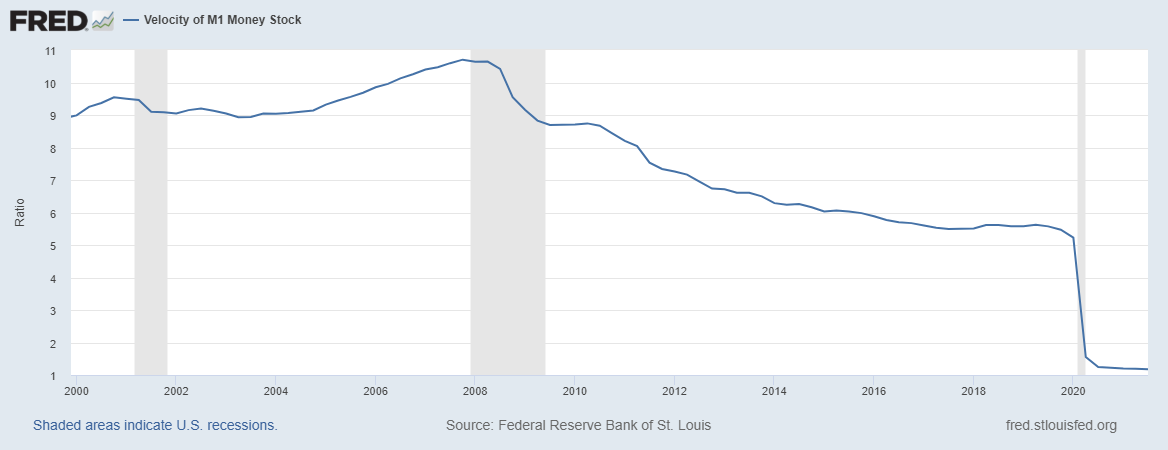
Source: www.stlouisfed.org
Money supply and the velocity of money stock have been going in opposite directions for years. U.S. money supply M1 is currency outside the U.S. Treasury, Federal Reserve Banks and vaults of depository institutions, demand deposits at commercial banks, other checkable deposits (CDs), demand deposits at thrift institutions, depository institutions, and drafts at credit unions. The velocity of money stock M1 (MV) is the frequency of which one unit of currency is used to purchase domestic goods and services within a given time period. If MV is increasing, more transactions are occurring between individuals. The opposite is true if MV is falling.
So M1 is soaring, up a mind-boggling 371% since the start of 2020—money printing at its most inflationary. Meanwhile, MV has fallen 78% in the same time period. What this tells us is that there is a lot of money sloshing around but not much of it is being exchanged. Savings are up 12% in the same time period (but down 80% from its peak in April 2020); however, we also note that the stock market has gone up almost 43% and housing prices have soared 27%. Personal spending is up only about 9% following a huge dip in February to April 2020. All that money has to go somewhere and the stock market and housing appear to have benefitted.
Source: www.stockcharts.com
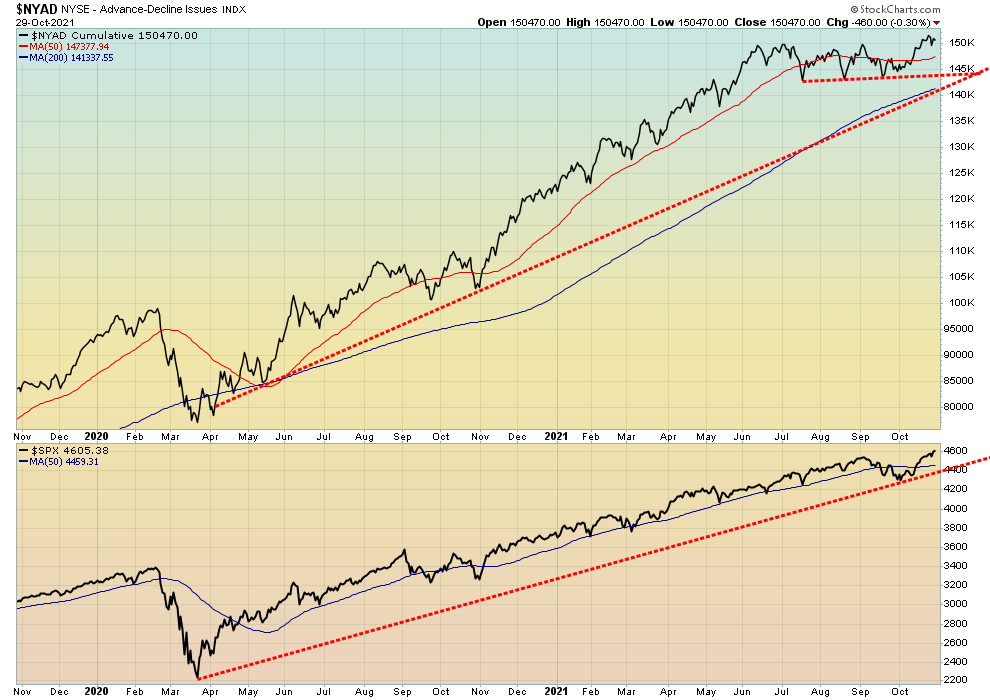
The NYSE advance/decline line surged to new all-time highs this past week, confirming the new all-time high of the S&P 500. With the two in sync once again we can’t say we could be making a top. The previous period where the AD line was diverging with the S&P 500 resulted in a feeble 6% correction, nowhere near the 10% correction many of us were looking for. With the two confirming, we expect once again higher prices going forward.
Source: www.stockcharts.com
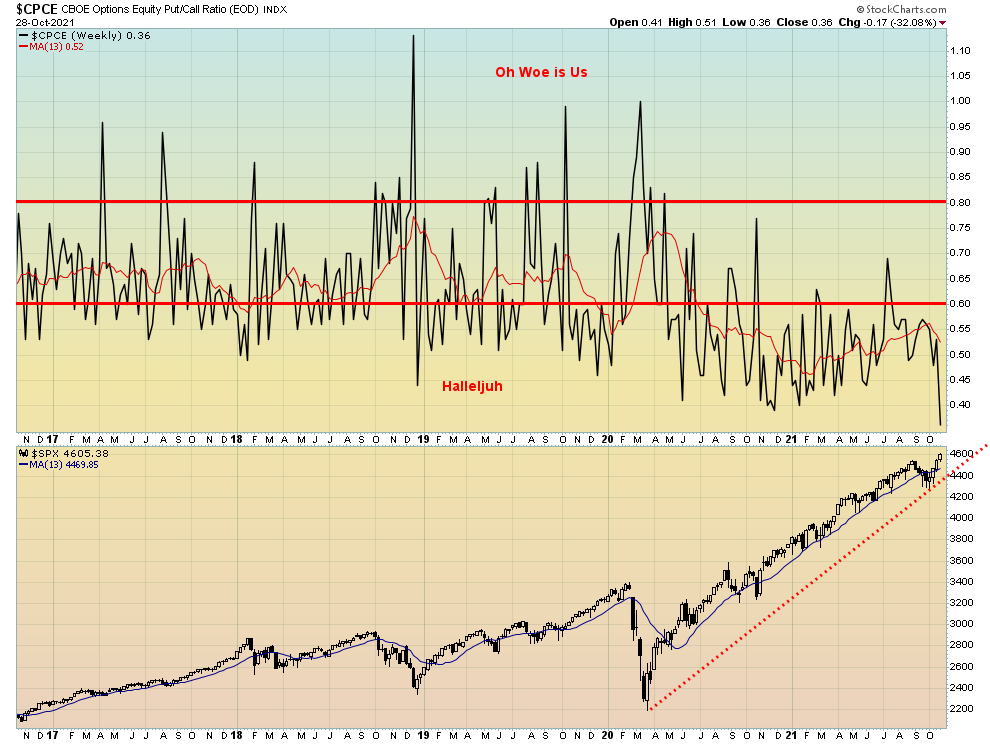
All we can say is “boy, is the market bullish.” Maybe too bullish. The put/call ratio fell to a record low this past week at 0.36. It is also coinciding with yet another all-time high for the S&P 500. We have never seen such a prolonged period where the put/call ratio has remained mostly under 0.60. Complacency on steroids?
Source: www.stockcharts.com
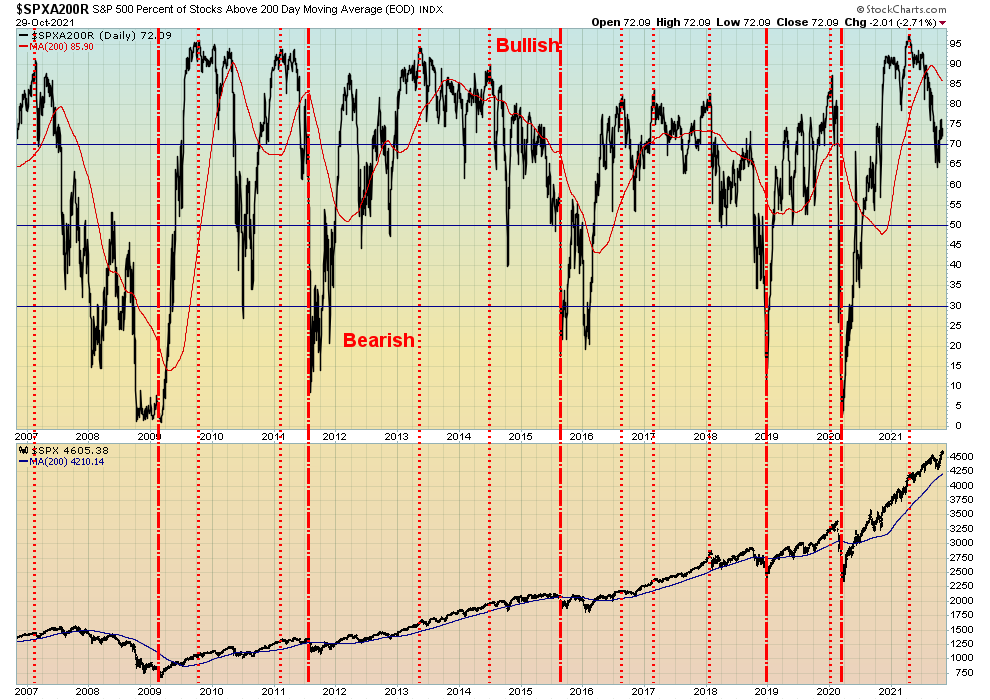
The percentage of stocks trading above the 200-day MA slipped this past week to 72.1%, down from 76.35% the previous week. That’s still bullish, but given new highs again in the index it is a bit of a divergence. The S&P 500 Bullish Percent Index (BPSPX) was at 66.2%, down slightly from the previous week’s 66.4%. Above 80% is getting into very bullish territory and that area often coincides with important tops.
Source: www.stockcharts.com
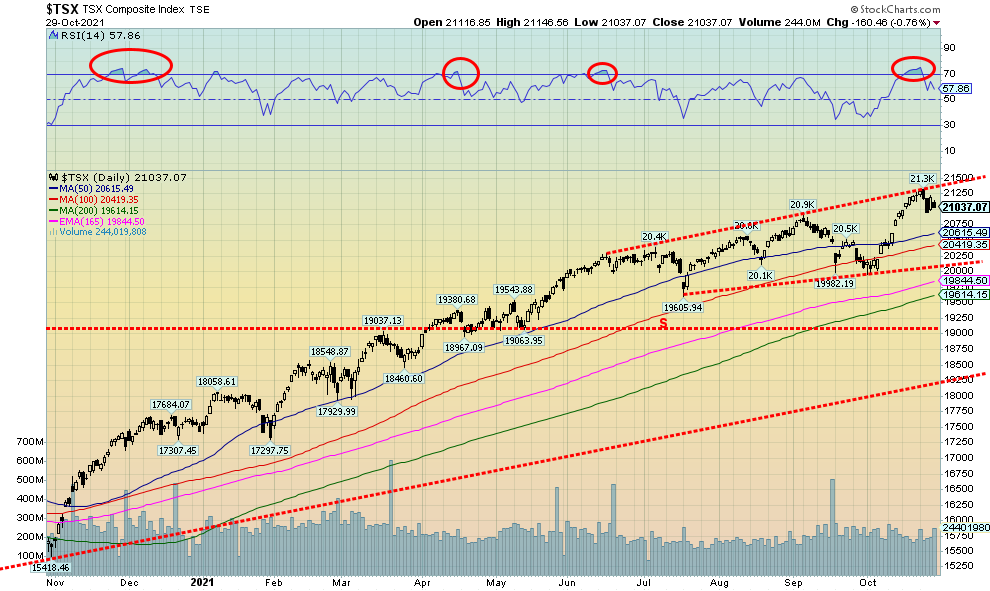
Once again, the TSX Composite made new all-time highs, hitting 21,307. However, the TSX then reversed and closed lower, down 0.8% on the week. So, does that portend a top? Not necessarily. It was a reversal week but it was not a key reversal week. We could experience some weakness into early November before resuming the uptrend. Only two of the 14 sub-indices were up on the week even as four of the sub-indices hit new all-time highs. Energy (TEN) continues to shine thanks to Suncor (SU) gaining 3.6% on the week to new 52-week highs. The only other gainer was Income Trusts (TCM) also making new highs, up 0.8% on the week. Making new highs then reversing and closing lower were Financials (TFS), down 1.2% and Real Estate (TRE), down 0.1%. The big loser was Health Care (THC), down 4.6% followed by Golds (TGD), down 4.3%. Other significant losers were Metals and Mining (TGM) off 3.2%, Consumer Discretionary (TCD) -2.4%, Consumer Staples (TCS) -2.2%, and Materials (TMT) -2.4%. Oddly, the small cap TSX Venture Exchange (CDNX) eked out a gain of 0.2%. The TSX Composite hit the top of a rising channel coming from the June high connecting with the September high. Clear support is down to 20,600 and then down to just above 20,000. A breakdown under 20,000 would signal the rally is over. But as we note earlier, we are moving into what are usually the best three months of the year from November to January. However, initially at least, we can’t rule out a correction into early November before resuming an uptrend. There is some support at 21,000 but more important is down to 20,600.
U.S. 10-year Treasury Bond/Canadian 10-year Government Bond (CGB)
Source: www.tradingeconomics.com, www.home.treasury.gov, www.bankofcanada.ca
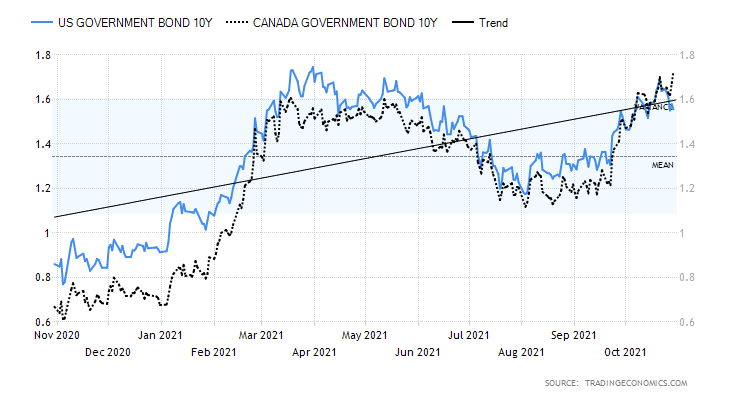
All eyes will be on the Fed this coming week as the FOMC meets with wide expectations that they will announce tapering and provide some guidance for interest rate hikes into 2022. After all, if other central banks are tapering and hiking rates (see Canada next), the Fed is expected to follow, emphasizing the improving economy and rising inflation. So, if the expectation is tapering and interest rate hikes, why did the U.S. 10-year treasury note fall this past week to 1.56%, down from a recent peak of 1.68% and from last week’s close at 1.64%? Maybe things are not as robust as everyone makes them out to be? After all, for this past week housing prices surged 18.5% year over year, new home sales were robust, above expectations, manufacturing indices came in above expectations, PCE prices surged, and consumer spending was above expectations. However, Q3 GDP disappointed, pending home sales fell, durable goods were weak, personal income fell, and the trade balance was weaker than expected.
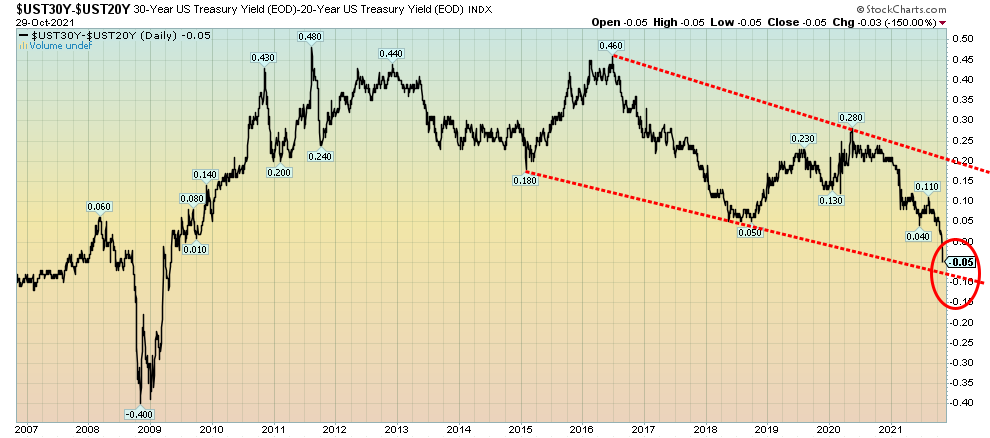
This coming week is not only the FOMC on November 2–3 but also the October employment numbers on Friday, November 5. The consensus expectation for nonfarm payrolls is 300,000 jobs following September’s anaemic rise of 194,000. Watch for September revisions. The unemployment rate is expected to remain unchanged at 4.8% (U3). As usual, we’ll cover the October employment report in next week’s Scoop. The wide expectation is for interest rates to rise further. The 2-year note has gone from a low of 0.14% in August to this week’s close at 0.50%, a jump of 257%. As a result, the 2–10 spread has narrowed over the past few weeks from 1.57% in March 2021 to 1.07% now. What is really interesting is that the 30-year—20-year spread has gone negative for the first time since 2009. It is noteworthy that the 20–30 spread went negative in 2006, a good year before the recession of 2007–2009 got underway (see chart on next page). Is this a warning?
20-year—30-year Spread Differential
Source: www.stockcharts.com
Government of Canada 10-year Bond (CGB) vs. Core Inflation
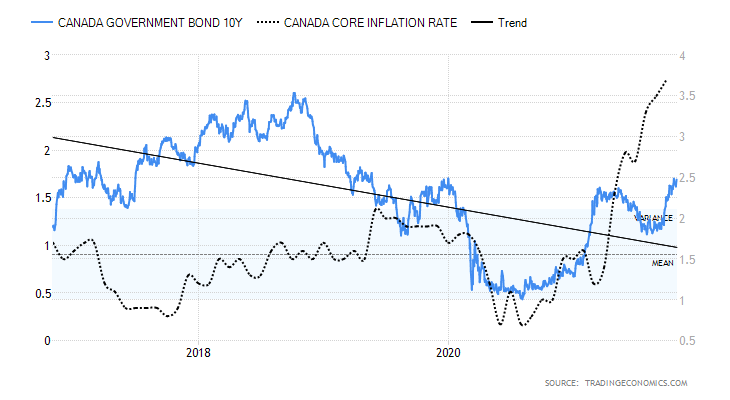
Source: www.tradingeconomics.com, www.statcan.gc.ca, www.bankofcanada.ca
Bank of Canada (BofC) Governor Tiff Macklem announced this week that they will be ending their quantitative easing program and pulling forward when they will start to raise rates. That sparked a rise in the 10-year and as well the 2-year. Surprisingly, the TD Bank noted that they expect the BofC to raise rates three times in 2022, likely starting in Q2. Rates could hit 1% by year end from the current 0.25%. Canada recorded 0.4% GDP growth in August after a 0.1% decline in July. Consensus was for a rise of 0.7%, so really that should have been a disappointment. Canada’s Producer Price Index (PPI) rose 1% in September and is up 14.9% year over year. Our chart above shows the Government of Canada 10-year bond (CGB) compared to the core inflation rate. The most recent core inflation rate for September year over year was 3.7%. Compare that to the current rate on the 10-year at 1.74%. That’s up from a rate of 1.11% in August 2021. The 2-year rise has been more dramatic, having jumped to 1.08%, up from 0.39% only a month ago. Both remain below the rate of inflation. Canadian bond yields are at their highest levels since last March when the 10-year topped out at 1.60%. The U.S. 10-year has still not taken out its recent highs. The announcement to start tapering caught many by surprise as, while Canada has recovered the jobs that were lost during the pandemic crash, GDP growth has not been as robust as elsewhere. Supply chain disruptions and the Delta variant continue to play havoc. Supply chain disruptions could play havoc with the upcoming Christmas season.
Canada releases its employment report this coming Friday. Expectations are for a rise of 120,000 jobs with at minimum 50,000. This would follow on the heels of the very robust September number of 157.1 thousand jobs. Again, full-time employment is expected to dominate with part-time employment falling again. The unemployment rate is expected to remain unchanged at 6.9%. Canada also releases its balance of trade on Thursday, looking for a trade surplus of $2.1 billion.
China’s Junk Bond Index
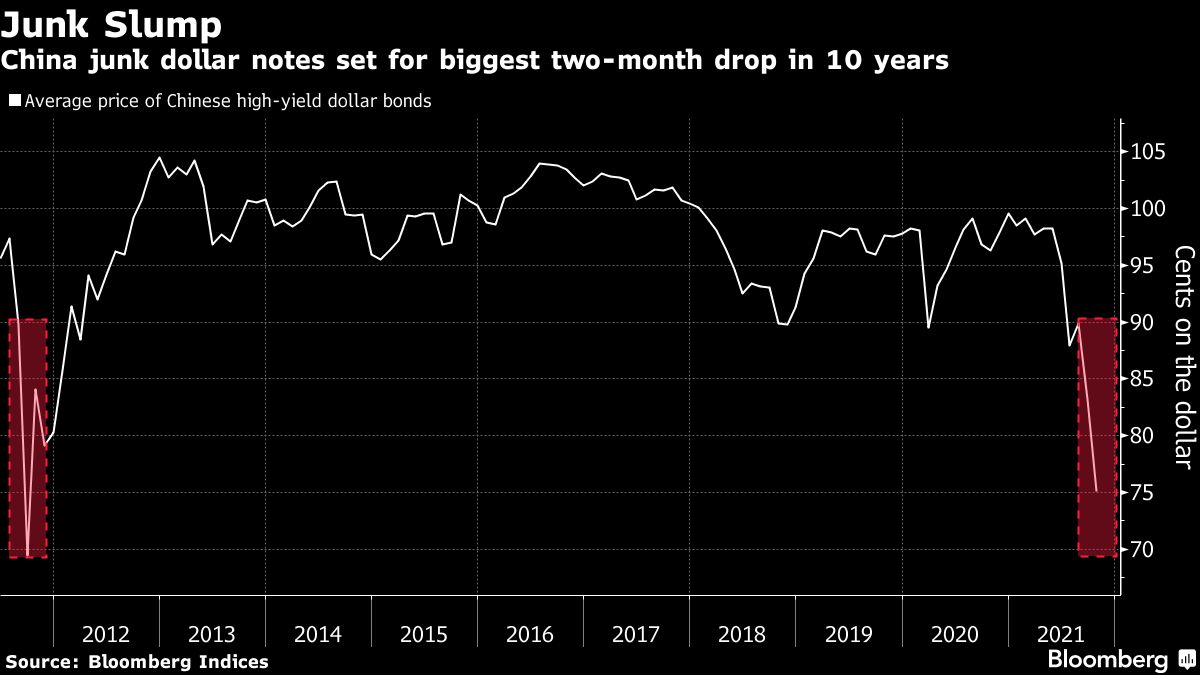
Source: www.bloomberglaw.com
China’s junk dollar bonds have taken their biggest tumble in the past two months as the Evergrande collapse weighs on the market. Evergrande may be averting default so far, but that is not stopping the bonds from being sold off. Some other Chinese realtors have gone under. Not only is this the biggest drop in the past two months but it is the biggest drop in a decade (2011). Trouble is brewing.
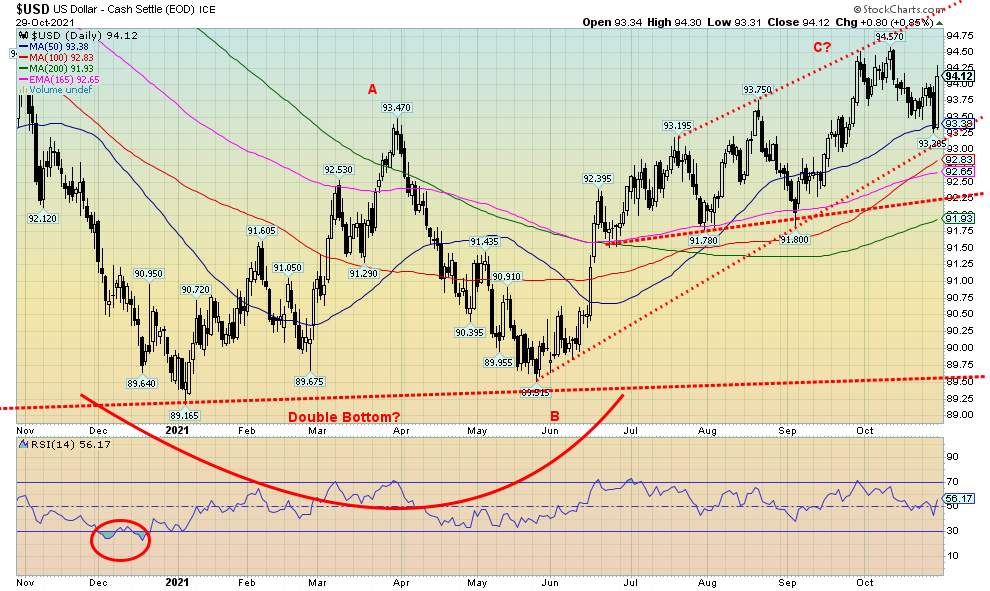
Source: www.stockcharts.com
The US$ Index went through a wild week. It fell falling sharply into Thursday and then turned around and rallied strong on Friday to end the week up 0.5% when it appeared the US$ Index was headed for a loss. No surprise that with one exception the other currencies fell. The euro was down 0.7% while the Swiss franc was the lone survivor, gaining about 0.1%. The pound sterling fell 0.8% while the Japanese yen continued its woes, losing 0.4%. The Canadian dollar was down just under 0.1% which for all intents was about flat. The US$ Index was buoyed Friday by the stronger than expected personal spending and the PCE price index. As well, the Chicago PMI came in much stronger than expected and consumer sentiment was mildly better than expected. The result: buy the U.S. dollar and sell the currencies. The other result was that the US$ Index put in a rather volatile week. In the short term, we could work our way higher this coming week with resistance up near the recent high of 94.57. Above 94.75 a run to 95 is probable. A break back below 93.40 could set up a breakdown under 93. Then there is support down to 92.65, 92.25, and 92. Below 91.90 any thoughts of a rally are most likely over. Any close now above 94.35 would suggest to us that new highs are possible above 94.57.
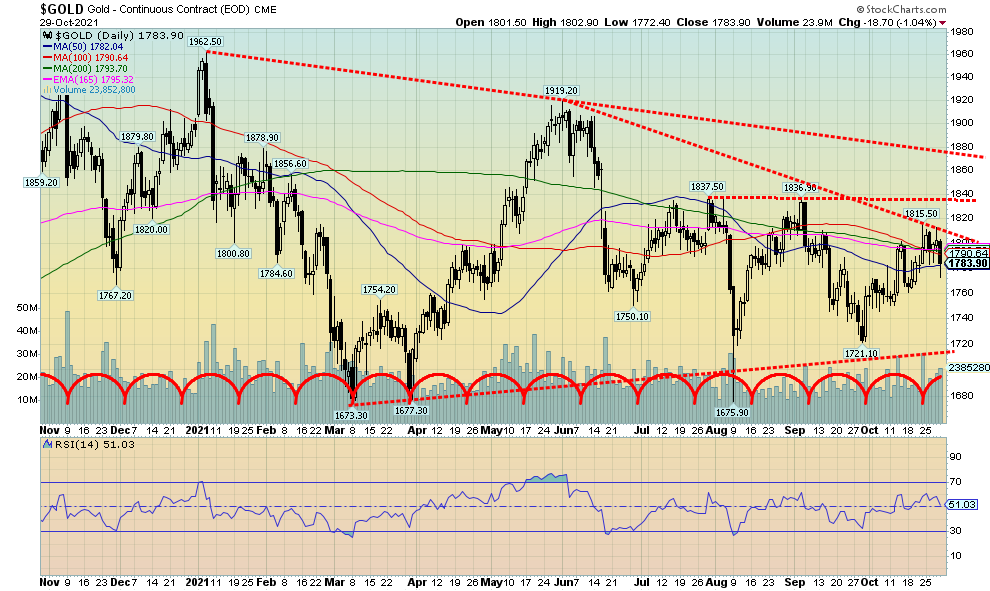
Source: www.stockcharts.com
After rallying for three weeks from September 29 to October 22, gold has suffered a setback as it ran into the $1,800/$1820 resistance zone. The actual resistance zone runs up to about $1,840. Gold was pressured back on Friday by a strong U.S. dollar and some fear going into the FOMC this coming week where the Fed is expected to provide guidance on tapering and interest rate hikes. Given that some other central banks (Canada standing out) have already announced plans to taper and hike interest rates, the expectation is that the Fed is poised to follow. However, could it turn out to be “sell the rumour” (the Fed is going to taper and hike interest rates) and “buy the news” (the Fed announces tapering and timeline for hiking interest rates)? This coming week could be pivotal.
Gold should rise in a stagflationary environment (weak economy, rising inflation) and, indeed, gold did rally rather well from the September 29 low, gaining 5.5% to that peak of $1,815.50 on October 22. Gold has followed the “Equity Clock” courtesy of www.equityclock.com that we post on the next page rather nicely so far in 2021. Gold peaked in January (February was the ideal) and then peaked again in May (on cue with the Equity Clock). Lows were seen in June, August, and September, again relatively on cue with the Equity Clock. Following the low in September a rally occurs into October for another peak (again, relatively on cue) followed by another low into early November. That in theory could be next week following the FOMC. Also note that the nonfarm payrolls are due out next Friday and that could provide another entry point as the last few nonfarm payrolls have generally come in below consensus. A rally then gets underway that could carry us into November and then after another pullback into December another good rally gets underway into January/February. Will the good luck with gold seasonals continue?
As we note, the key resistance zone is $1,800/$1820 and then again at $1,840 which also generally coincides with the downtrend line from the August 2020 high of $2,089. Above $1,840 things would be looking up. Above $1,880 gold would make a major breakout over the trendline down from the January 2021 high. Gold’s potential above that level is up to $2,250/$2,300 with minimum objectives to $1,940/$1,950. Any failure to make new highs above August 2020 would be quite bearish. Then gold would start a steep decline into its 7.8-year and 23–25-year cycle low.
Support is seen down to $1,760 and again down to $1,740/$1,750. Danger lies below $1,740 and new lows below the September 29 low of $1,721 is possible. This coming week could prove pivotal for gold.
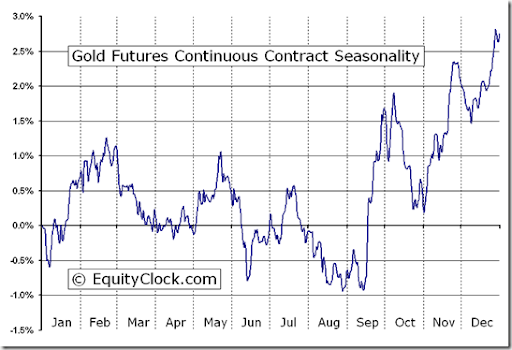
Source: www.equityclock.com
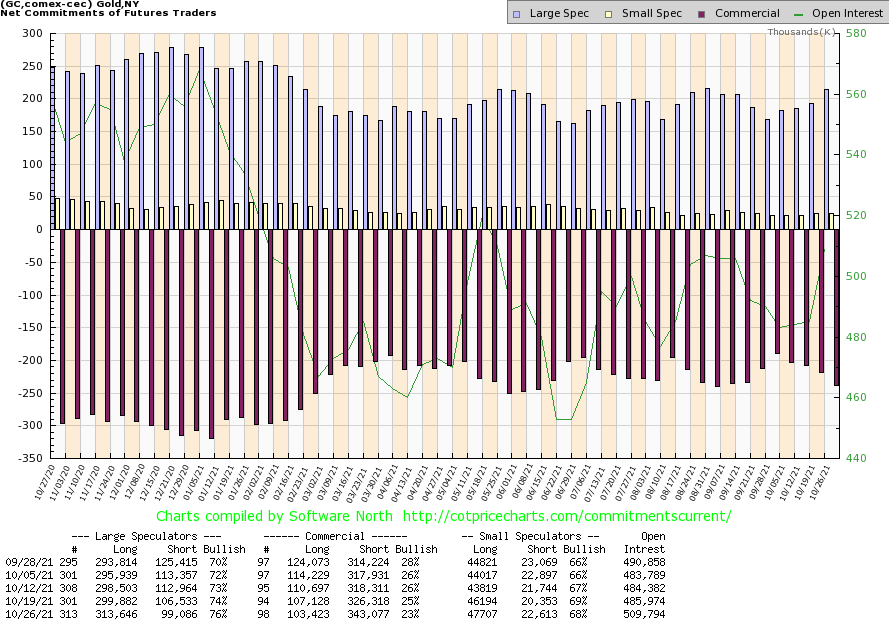
Source: www.cotpricecharts.com
The gold commercial COT (bullion banks and companies) fell back to 23% this past week from 25% the previous week and 26% two weeks ago. It was a disappointment. Naturally, the large speculators (hedge funds, managed futures, etc.) appeared to be getting ahead of themselves on the recent rally as they jumped to 76% from 74% the previous week and 73% two weeks ago. Given that the bulk of the decline for gold occurred after the cut-off date for the COT October 26, it will be interesting to see if the commercials covered some of this on the drop that occurred into Friday, October 29. The accusation, of course, will go out that the bullion banks once again pulled the plug on the market, but we knew in advance that the $1,800/$1,820 zone was going to be resistance and the likelihood of breaking through there on the first try was probably not going to succeed.
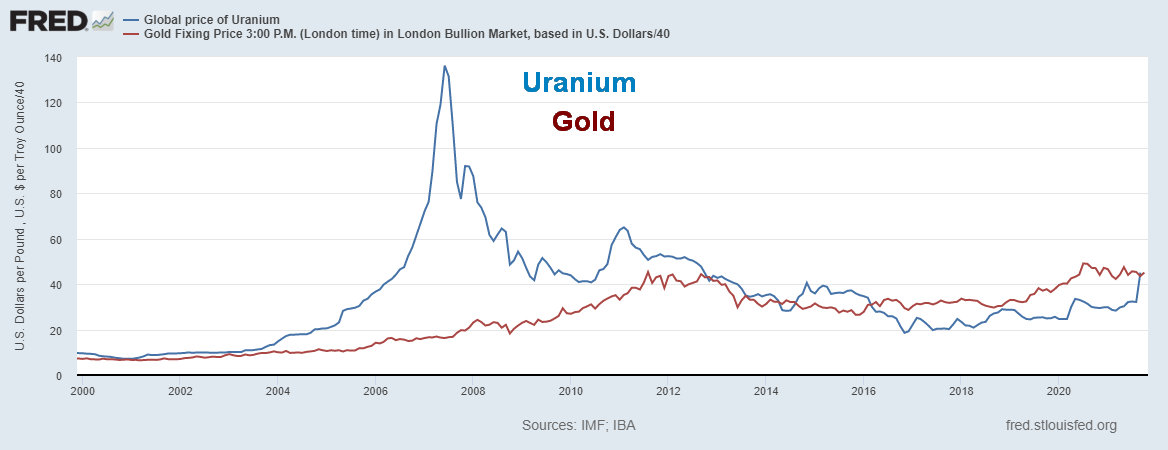
Source: www.stlouisfed.org
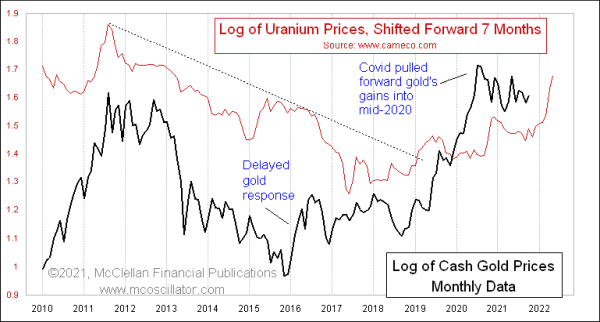
Tom McClellan of McClellan Financial Publications (www.mcoscillator.com) raised an interesting note in his latest missive. He noted by shifting uranium prices forward seven months that there was an interesting correlation with gold. Our first chart above shows uranium and gold not shifted but as is.
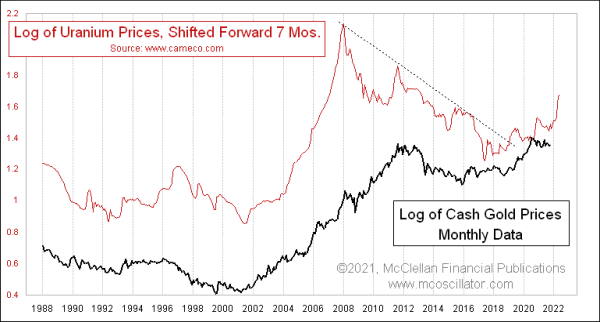
Source: www.mcoscillator.com
The message is simple. If uranium prices are headed higher, gold should follow. McClellan admitted he had no idea why this works. Uranium is the leader. The chart above going back into the 1980s shows how they look together. McClellan noted that the Sprott Physical Uranium Trust (U.U/TSX) has been active of late. U.U is the GLD for uranium. Given the trend towards green nuclear power, uranium is an obvious choice, especially with the ability now to build smaller reactors. But if uranium is picking up, look for gold to follow over the next several months.
We do not pretend that this relationship is perfect and that just because it appears to have worked in the past that it will work going forward. But we note the odds look at least reasonably good. The chart below shows the relationship in a tighter time frame. Again, not perfect by any stretch.
Source: www.mcoscillator.com
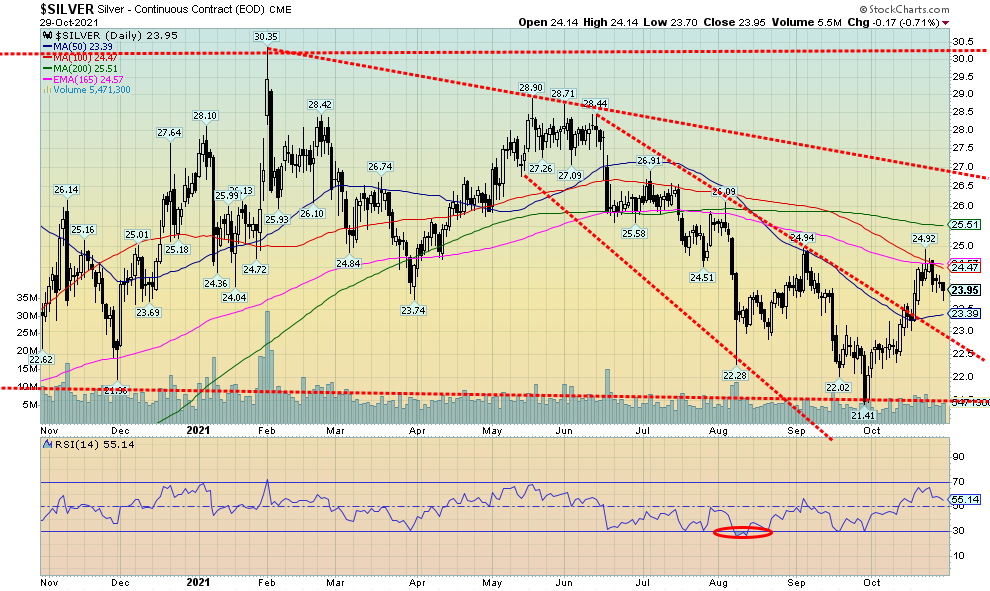
Source: www.stockcharts.com
After peaking at $24.92 a week ago, silver has corrected back roughly $1 or 3.9%. The winnin streak was halted and silver closed the week down 2.0%. The rally, that started a month ago on September 29, had seen silver rise 16.4% at the peak as it ran into resistance at the converging 100-day MA and the 165-day EMA. The 200-day MA was slightly higher at $25.50. If our expectation is for silver to lead it was doing a good job—until this week, at least, where silver actually led gold to the downside. As we noted with gold, we appear to be set up for the first correction since the late September low. Silver’s seasonals often see a rally get underway in September and a peak in October followed by a pullback into late October or even November before another rally gets underway. Here’s a peek at silver’s seasonals, courtesy of Equity Clock (chart on next page). Note the high in May 2021 coinciding nicely with the seasonal chart.
Support for silver is seen at $23.40, then again at $23 and $22.75. Danger lies below $23.25 where new lows below the September low of $21.41 are possible. Resistance is seen at $24.50 up to $25. If we are correct that silver is headed higher, once this correction is over the range between $22.75 to $23.40 should hold. Major resistance is seen at $27 and then again at the May highs just above $30. Above $28.25 new highs above $30.35 are possible.
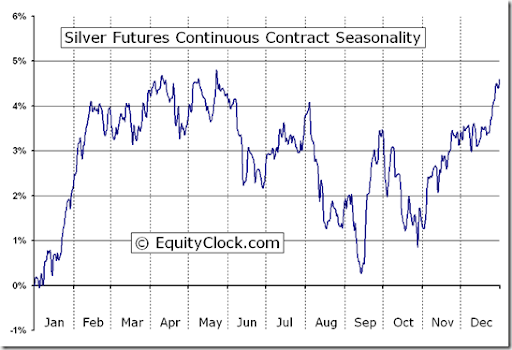
Source: www.equityclock.com
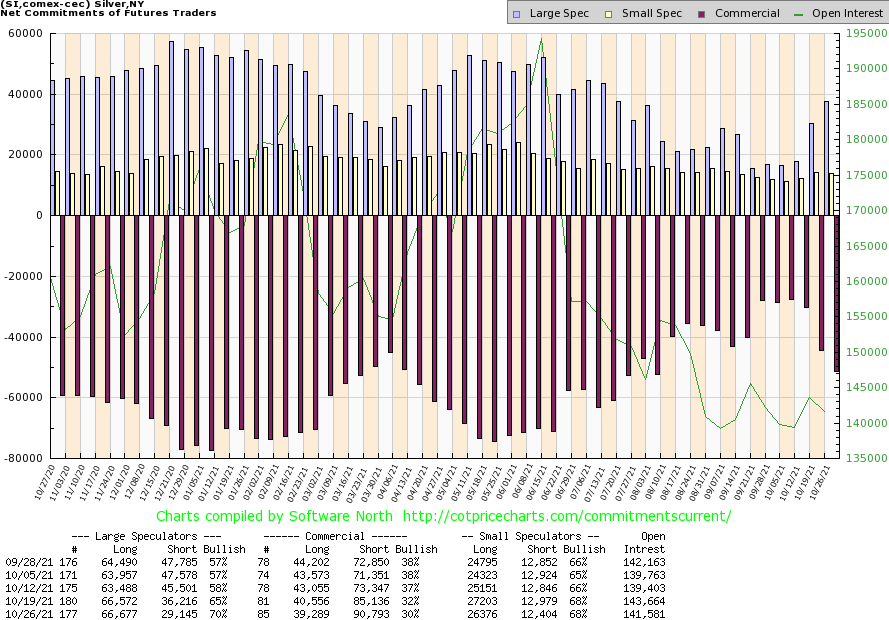
Source: www.cotpricecharts.com
Like the gold commercial COT, the silver commercial COT has weakened significantly. This past week it fell to 30% from 32% the previous week and 37% just two weeks ago. We note that there was fresh short open interest of over 5,000 contracts. Long open interest fell just over 1,000 contracts. No surprise; the large speculators jumped ahead and their COT was 70% vs. 65% the previous week and 58% just two weeks ago. Possibly the large speculators got bullish too fast and the bullion banks, etc. took advantage of it and pushed things back.
Source: www.stockcharts.com
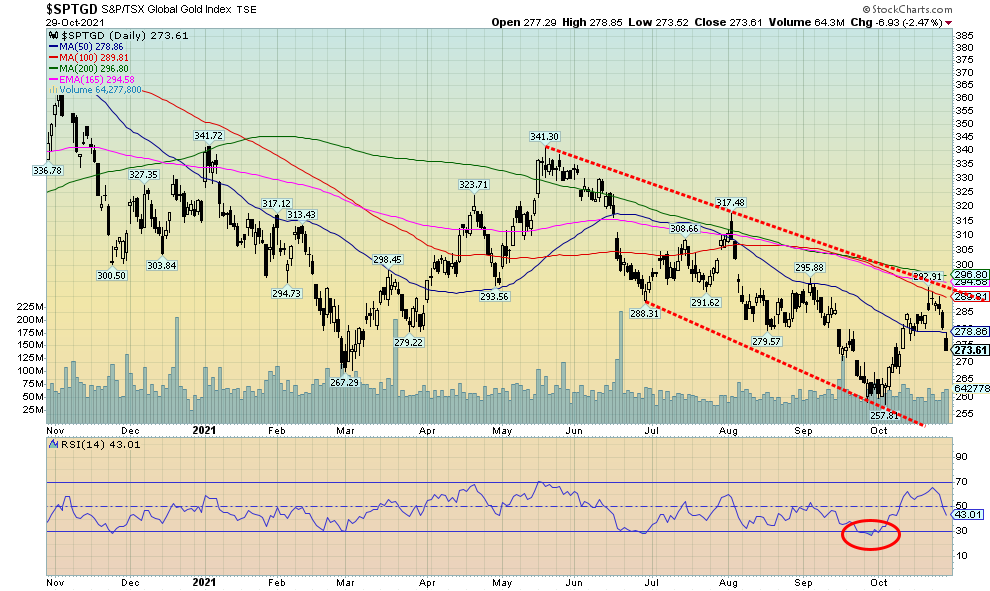
The gold stocks suffered a setback this past week. Reversals for both gold and silver saw a bout of profit-taking overtake the gold stocks. The TSX Gold Index (TGD) dropped 4.3% while the Gold Bugs Index (HUI) fell 4.2%. That was despite a raft of gold companies reporting earnings. The TGD above saw it fall back below the 50-day MA that was just beginning to curl. The rally had seen the TGD gain 13.5% from the low on October 5 to the recent high on October 22. Naturally, we’d prefer not to see any further declines. A drop below 265/266 would, however, not be positive and could suggest that new lows below 258 could be seen. It would not, however, be the end of the world as it could set up numerous positive divergences for the gold stocks.
Indicators have turned down without really becoming overbought. There is support down to 267 and as long as we remain above that level we could regroup before starting to climb again. The high at about 293 saw the TGD reach up towards the 200-day MA (currently at 296.80) and the 165-day EMA (currently at 294.58). So, we knew there was resistance up to that level. Typically, it takes some regrouping and a few tries before an important resistance point falls. The Gold Miners Bullish Percent Index (BPGDM) has improved to 30 after hitting a bearish low at 16.67. It is possible the market was too bullish too soon. Overall, however, gold stocks remain super-cheap to the price of gold. Junior gold miners have been creeping higher for months in what we call a stealth rally, although they too suffered a recent setback.
Source: www.stockcharts.com
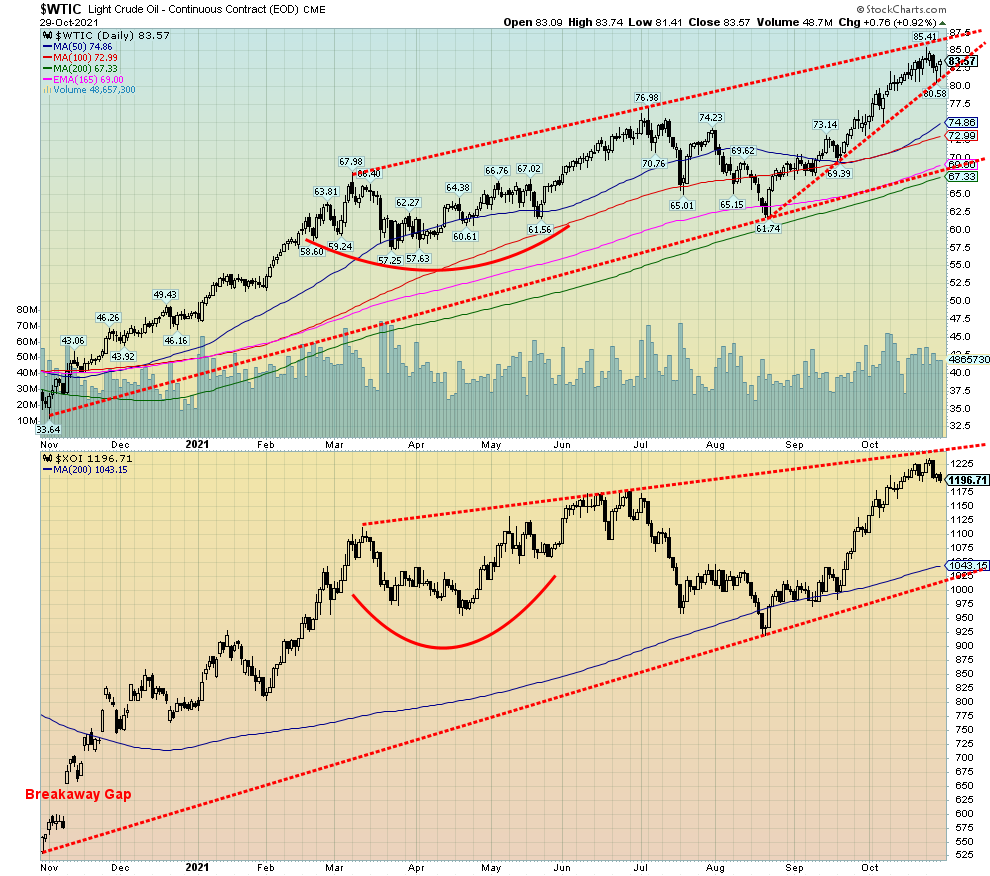
For the first time in about two months oil prices fell this past week. Okay, it was only a small 0.2% but it came after WTI oil hit a new 52-week high at $85.41 before pulling back. A small reversal week. Natural gas (NG) and coal also fell with NG losing 0.6% and coal falling more, down 2.9%. Naturally, we can’t tell whether this means the end of the rally or just a temporary setback. We suspect that this is a temporary setback as the longer-term picture has turned bullish. However, it could mean a pullback in price over the next week or two. The only concern is what appears to be an ascending wedge triangle forming. A break of $80.50 could, in theory, send WTI oil back to the rising support line currently near $69/$70. The 200-day MA is just below near $67. This is a worst-case scenario on any pullback.
Oil companies haven’t been complaining about the rising oil price. Many have been reporting strong profits. Suncor (SU) was one this week that exceeded expectations, sparking a jump in price on the week of $4.30 or 15.2%. As a result, the TSX Energy Index (TEN) did enjoy a strong week up 3.6% to new all-time highs. The Arca Oil & Gas Index (XOI) also hit new all-time highs but then reversed and closed down 1.1% on the week. Nonetheless, the XOI is still up 51% on the year while the TEN is doing even better, up 79% in 2021.
Some are claiming the case for further price rises is weakening. Why? Because inventories have been rising and the Iranian talks are supposed to be back on again. As to the Iran nuclear talks, the U.S. has a funny way of going about it as they also put more sanctions on key members of the Revolutionary Guard. Iran has insisted that pre-conditions must be off the table to renew talks and sanctions are one thing that sticks in the craw of Iran. Despite that, Iran has been selling its oil and gas—surreptitiously, of course, although China and Iran appear to be doing it openly. Supposedly as well, Iranian backed forces in Syria are playing havoc with U.S. forces in Syria. Israel as well continues periodic bombing missions into Syria with no serious blowback. However, overall, Iranian production is down. So, we’ll see if the Iranian talks do get underway as planned.
Meanwhile there is no sign that OPEC and Russia are about to loosen the taps further. They have already agreed to increase production 400 thousand BPD monthly. They are not committed to doing more.
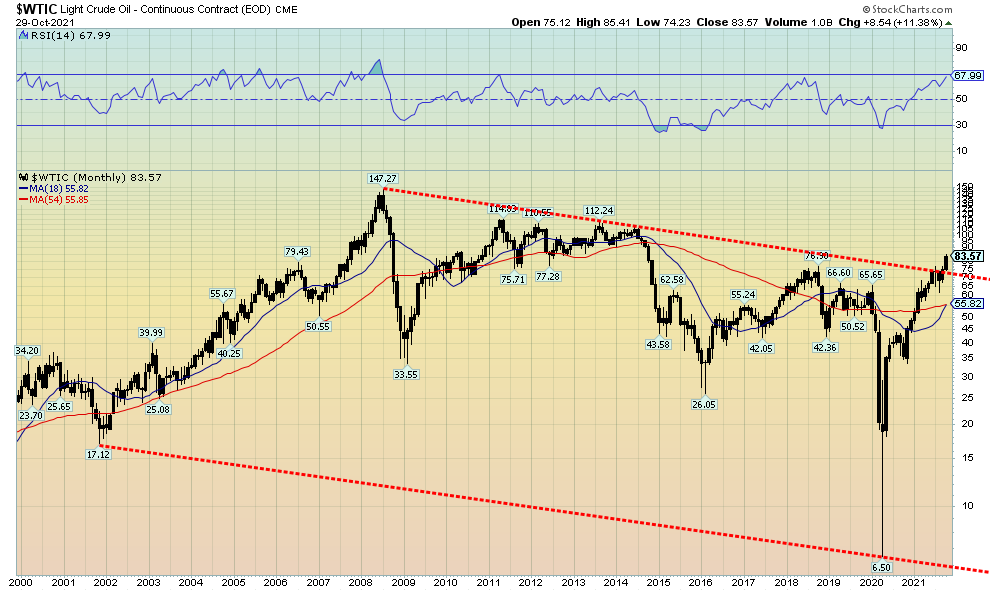
The monthly chart of WTI oil that we have added below shows oil appears to have broken out of the downtrend from the 2008 all-time high. If you are an oil bug, then the chart might get one excited as it could, in theory at least, project WTI oil to rise to $210. Far-fetched? If a shooting war broke out with Iran, then that is a real possibility. Iranian missiles could cause havoc in the Gulf for tankers and the Saudi oil fields are within range as are the fields and ports of Qatar. Attacking Iran would not be a particularly wise idea. A more modest target could be $103. All bets would be off if oil prices were to fall back below $55.
Source: www.stockcharts.com
Copyright David Chapman, 2021
|
Charts and commentary by David Chapman Chief Strategist, Enriched Investing Inc. Phone: 416-523-5454 Email: david@davidchapman.com dchapman@enrichedinvesting.com Twitter: @Davcha12 November 1, 2021 |
|
GLOSSARY Trends Daily – Short-term trend (For swing traders) Weekly – Intermediate-term trend (For long-term trend followers) Monthly – Long-term secular trend (For long-term trend followers) Up – The trend is up. Down – The trend is down Neutral – Indicators are mostly neutral. A trend change might be in the offing. Weak – The trend is still up or down but it is weakening. It is also a sign that the trend might change. Topping – Indicators are suggesting that while the trend remains up there are considerable signs that suggest that the market is topping. Bottoming – Indicators are suggesting that while the trend is down there are considerable signs that suggest that the market is bottoming |
David Chapman is not a registered advisory service and is not an exempt market dealer (EMD) nor a licensed financial advisor. We do not and cannot give individualised market advice. David Chapman has worked in the financial industry for over 40 years including large financial corporations, banks, and investment dealers. The information in this newsletter is intended only for informational and educational purposes. It should not be considered a solicitation of an offer or sale of any security. Every effort is made to provide accurate and complete information. However, we cannot guarantee that there will be no errors. We make no claims, promises or guarantees about the accuracy, completeness, or adequacy of the contents of this commentary and expressly disclaim liability for errors and omissions in the contents of this commentary. David Chapman will always use his best efforts to ensure the accuracy and timeliness of all information. The reader assumes all risk when trading in securities and David Chapman advises consulting a licensed professional financial advisor before proceeding with any trade or idea presented in this newsletter. David Chapman may own shares in companies mentioned in this newsletter. We share our ideas and opinions for informational and educational purposes only and expect the reader to perform due diligence before considering a position in any security. That includes consulting with your own licensed professional financial advisor.
About the author


Website: https://www.enrichedinvesting.com
Disclaimer: David Chapman is not a registered advisory service and is not an exempt market dealer (EMD) nor a licensed financial advisor. We do not and cannot give individualised market advice. David Chapman has worked in the financial industry for over 40 years including large financial corporations, banks, and investment dealers. The information in this newsletter is intended only for informational and educational purposes. It should not be considered a solicitation of an offer or sale of any security. The reader assumes all risk when trading in securities and David Chapman advises consulting a licensed professional financial advisor before proceeding with any trade or idea presented in this newsletter. David Chapman may own shares in companies mentioned in this newsletter. We share our ideas and opinions for informational and educational purposes only and expect the reader to perform due diligence before considering a position in any security. That includes consulting with your own licensed professional financial advisor.