
“My formula for success? Rise early, work late, strike oil.”
—John Paul Getty, American-born British petroleum industrialist, founder of the Getty Oil Corporation 1942, patriarch of the Getty family, at the time one of the richest men in the world, avid collector of art and antiquities, founder of the Getty Center, the Getty Foundation, the Getty Research Institution, and more; 1892–1976
“Whoever controls oil controls much more than oil.”
—John McCain, American politician, U.S. navy officer, U.S. Senator for Arizona 1987–2018, served in U.S. House of Representatives, Republican nominee for president of the U.S. 2008, shot down near Hanoi in 1967 and was held POW until 1973; 1936–2018
“By the fall of 1918, it was clear that a nation's prosperity, even its very survival, depended on securing a safe, abundant supply of cheap oil.”
—Albert Marin, American history professor, author of more than 40 books, many for juveniles, quote from Black Gold: The Story of Oil in Our Lives 2012, Chair of History Department, Yeshiva University, New York; b. 1936
No, our intention was not to talk about oil but, instead, we’ll start off talking about oil. Oil is a volatile commodity. Sure, there may be plenty of it, even if reserves are declining and it remains essential to the function of our economies, regardless of the move to a cleaner energy economy. Most likely its need will never go away. Fossil fuels, which include oil, coal, and natural gas still supply roughly 80% of the world’s energy needs.
The world’s largest producer of oil is the U.S. The next three are Saudi Arabia, Russia, and Canada. Note: only Canada is not a BRICS country. The U.S. is also the world’s largest consumer and, despite being the largest producer and a net exporter of petroleum and petroleum products, the U.S. still imports some 40% of its needs because it consumes so much—consuming almost as much of the next three countries combined (China, India, and Russia are all BRICS countries). The U.S.’s biggest source of imported oil is Canada. As to reserves, Venezuela is the largest, followed by Saudi Arabia, Iran, and Canada. In terms of years of reserves, no one is even close to Venezuela. But, like Canada’s oil sands, Venezuelan oil is not particularly clean. For the U.S., oil is a strategic commodity and drives their need to protect their sources or gain sources under their control. As a result, we have oil wars, since many large producers and reserves are in countries not friendly to the U.S.
As our chart shows, huge spikes in oil prices are often followed by recessions, even if rising oil prices may only be one of the causes. Sharply rising oil prices were behind the recessions of 1974–1975, 1980–1982, 1990, and 2007–2009.
Here we are once again with oil prices rising, even as they have not hit or even come close to crisis proportion—yet. The average inflation-adjusted oil price since 1980 is about $67/barrel. Today it is above $80 and seems poised to rise further.
Oil 1946–2023 Inflation-Adjusted
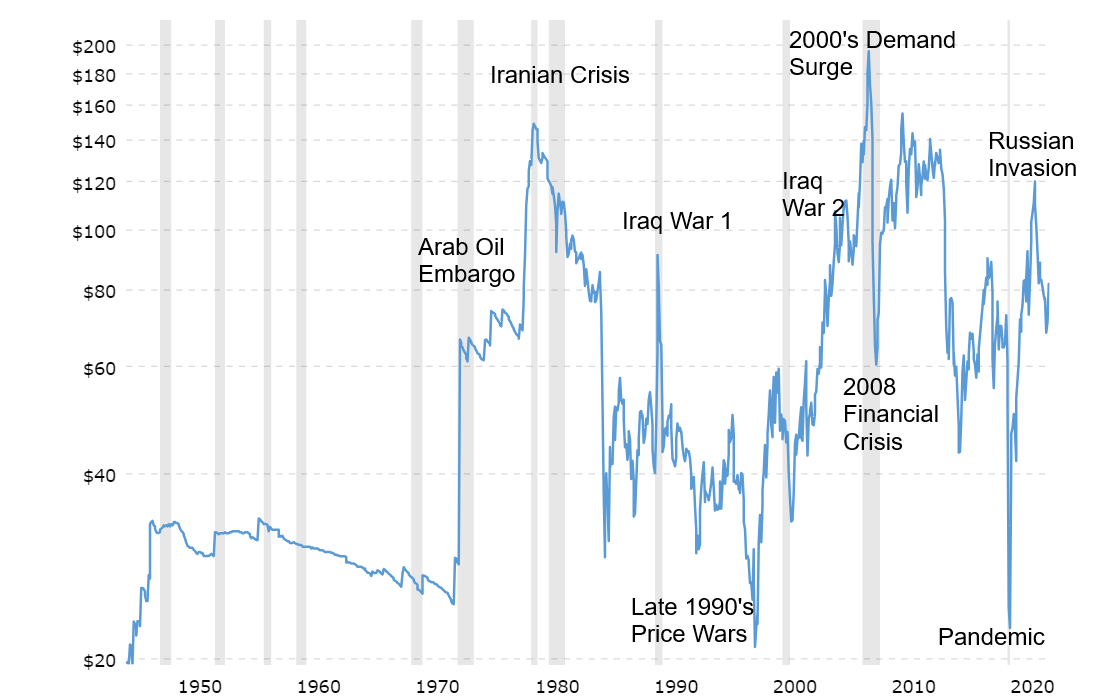
Source: www.macrotrends.net
Rising oil prices are just one of the things that one has to be concerned about. Inflation (rising oil prices are inflationary, but not the only thing causing inflation) and rising interest rates to combat inflation are like a double whammy to consumers, business, and governments. Add in supply disruptions and sanctions/trade wars and we have a dangerous witches’ brew that is now beginning to affect economies, particularly those in the West that depend the most on oil to fuel them. I read predictions, including some from respected sources not known for hyperbole, that oil prices could rise to $300 or higher, sparked by global conflict.
But oil is not the only headline that catches our eye. Headlines just seen this week outline that banks here in Canada are bracing for a spike in bad loans. The move to buy homes at almost any price is catching up as interest rates rise, with many having borrowed floating rate mortgages or other easy terms to lessen the cost of their mortgage. Now, those decisions are backfiring due to rising interest rates and borrowing costs. They also extended the term and banks let them do so, so that some 43% of residential mortgages in Canada have amortization terms of 25 years or more. The bank regulators are ordering banks to set aside more bad loan reserves. Canadians, in particular, are one of the most indebted nations on earth. No, not the government—it’s the consumers, with a household debt to GDP ratio of 102% (note that Switzerland is the highest at 128%) and household debt to income of 180% (second highest behind Norway at 205%).
Property bubbles, not just in Canada, but in many other cities and countries have been constant. That’s what cheap money does—encourages you to borrow. But it is now impacting affordability, suggesting that current prices are too high. A chart we saw, shown below, noted that U.S. new home payments have soared to over 50% of income. This is an accident waiting to happen. Even at today’s prices, valuations are estimated to be overvalued by upwards of 30%. On a home of $1 million today, that’s a fall to $700,000. The last time interest rates and payments as a percentage of income were really high was the early 1980s, as interest rates hit 20%. After that interest rates and payments fell for years. Not any more.
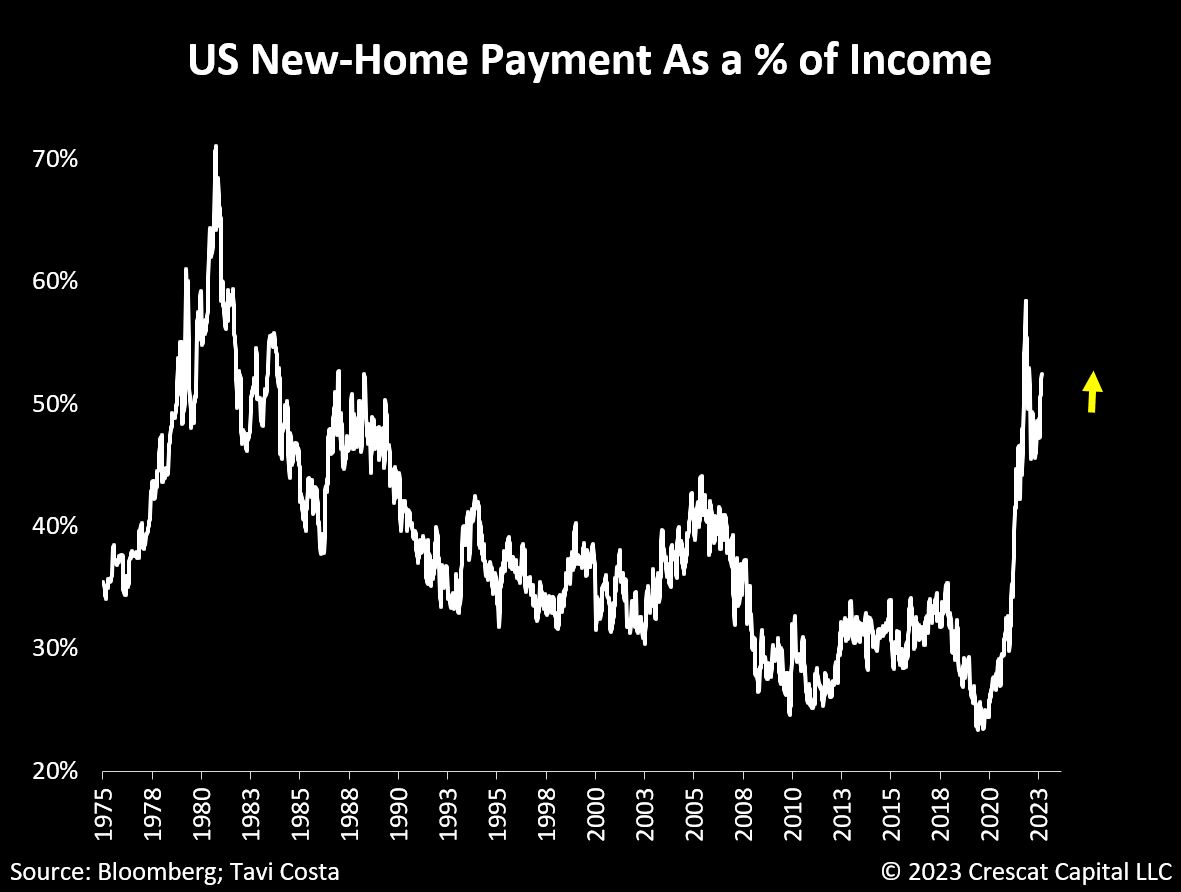
Source: www.bloomberg.com, www.crescat.net
Bankruptcies Canada and the U.S. 1997–2023
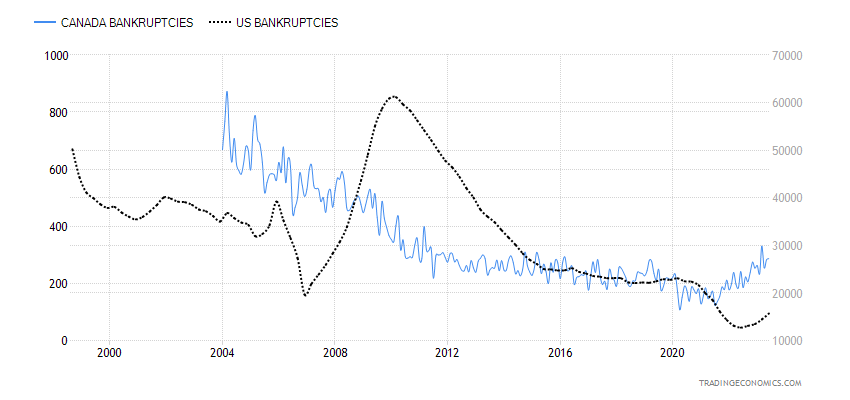
Sources: www.tradingeconomics.com, www.statcan.gc.ca, www.uscourts.gov
No, it is not a full open crisis, yet. However, Canada has broken a long downtrend line dating back to when the statistics were gathered in 2004 and the U.S. is rising. The chart is business bankruptcies and is stated in number of bankruptcies, not dollar amount. The U.S. actually leads the world in number of bankruptcies. The Canadian Office of the Superintendent of Financial Institutions (OSFI) has stated that housing is the number one risk, but they should have also noted the particular risk in commercial real estate. However, risks are rising everywhere, particularly for the consumer and business. Sharply rising oil prices would be like the nail in the coffin. No, it is not a full-blown crisis yet, but the risks are rising.
Bank Indices – 2021–2023
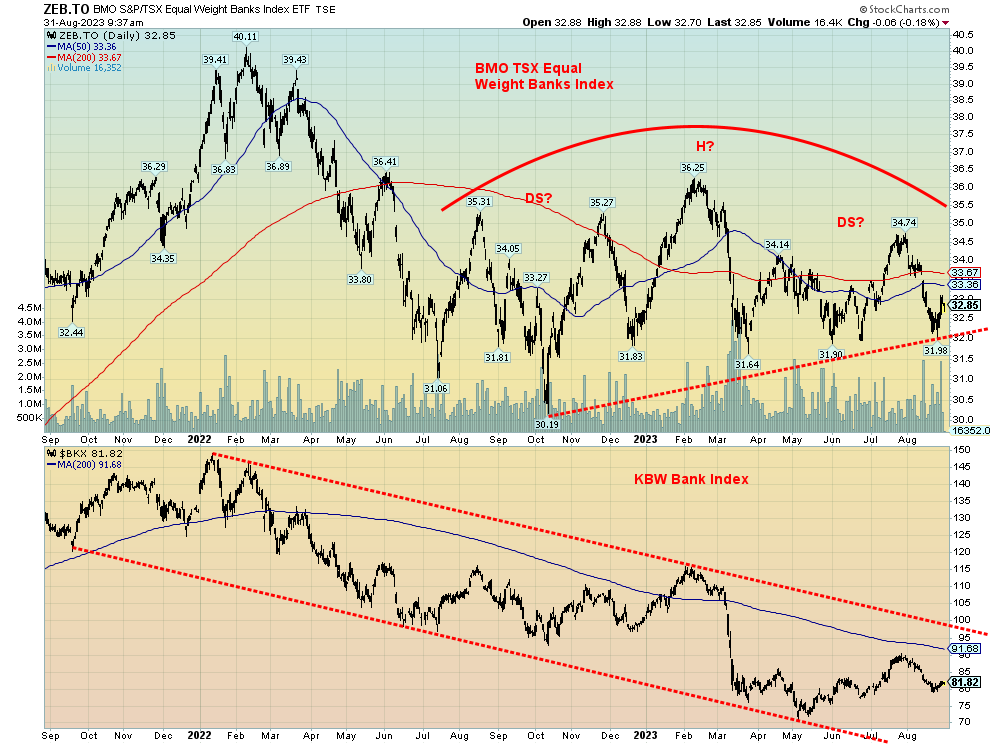
Source: www.stockcharts.com
With banks setting aside more reserves and facing unknown risks and potential losses, it is no surprise to find the bank indices are down. The BMO TSX Bank Index (ZEB.TO) is flat in 2023 but remains down 18% from its high seen in January 2022. At the low in October, ZEB entered bear market territory as it had fallen 25%. ZEB appears to be forming a head and double shoulder consolidation topping pattern. If that’s correct, the breakdown zone is under $32 and may project down to about $26. A death cross (50-day MA crossing under the 200-day MA) occurred in April 2023, adding to the bearishness.
The U.S. KBW Bank Index ($BKX) has been in a long downtrend since its top in January 2022. $BKX is down some 45% from its high and remains firmly in a bear market. Its death cross was seen way back in March 2022 and has remained that way, for the most part, throughout the decline.
With trouble in both the North American (U.S. and Canada) consumer mortgage market and the commercial real estate market, attention should also go to the looming property market collapse in China. In some respects, the Chinese collapse is potentially more dangerous with global ramifications. The focus has been largely on the bankrupt Evergrande Group and Country Garden Holdings, which is teetering on the edge. But what should not be ignored is China’s shadow banking system. Xinhua Trust is a recent shadow banking company that went bankrupt last May. Xinhua was caught up in the wave of property developers that are going bust or undergoing major restructuring. Behind Xinhua is a larger shadow banker Zhongrong International Trust which recently missed payments.
Shadow banking is financial institutions that fall outside the realm of regulated banking. Risk, liquidity, and capital are not up to the standards of regular banks. It includes trusts, hedge funds, crypto lenders, pension funds, and insurance companies, amongst others. Regulation varies from some oversight to none. That’s why a collapse in that sector could be dangerous. The shadow banking system, not only in China but also in the U.S. and Canada, has lent billions into property markets plus other types of securities. Financial ties can sometimes be difficult to track. That raises the potential for contagion if something goes wrong.
Does anybody remember Long Term Capital Management (LTCM)? LTCM was a shadow bank that went under during the 1998 Russian debt collapse. Leverage was unprecedented at LTCM, and when it went under it took a large consortium of banks, along with the intervention of the Fed, to prevent what might have been a global financial collapse. It was estimated that LTCM’s leverage was at least 27:1. The Russian collapse raised their leverage to 130:1, an unprecedented level.
Also, does anyone remember the near collapse of the U.S. insurer AIG International (AIG) in 2008? This time it was the unprecedented leverage in its financial unit, which had written massive amounts of credit default swaps (CDS). When the 2008 financial collapse got underway, AIG Financial (AIGFP) could not come up with the cash to pay the CDSs. This led to the near bankruptcy of AIG and massive bailouts from banks and the Fed to prevent contagion and a global collapse. Both LTCM and AIGFP, along with AIG itself, are shadow banks.
Add to that the quadrillion dollar off-balance sheet lending of not only banks but also the shadow banks. Derivatives have been at the heart of previous collapses. Barings Bank, the Madoff Investment Fund, along with LTCM and AIGFP are amongst famous collapses that included both securities and derivatives. The risks in derivatives are often somewhat undefined. Rather than the principle being at risk, as it is with a loans and outright securities purchases, derivatives can collapse because of unusual moves in interest rates, credit spreads, equity prices, foreign exchange rates, and commodity prices.
None of this is to suggest that a collapse could be on its way. But, as interest rates rise and the credit situation deteriorates, and bankruptcies rise along with fluctuations in foreign exchange rates and rising commodity prices, risks are rising. What we have seen to date may only be the tip of the iceberg.
U.S. Job Numbers
U.S. Employed and Unemployed Persons 2013–2023
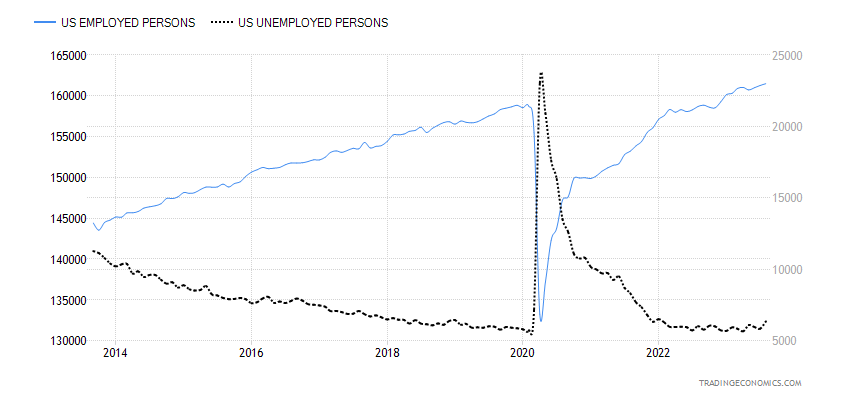
Source: www.tradingeconomics.com, www.bls.gov
We are awaiting Shadow Stats (www.shadowstats.com) and their website issues. Therefore, no numbers from them.
The August employment numbers are out and we are now seeing some signs of slowing. However, it’s a slowing, not a stampede. Nonfarm payrolls came in just slightly above expectations at 187,000 vs. the expected 170,000 to 180,000. But, as was expected, revisions came in for June and July and they were revised down 110,000. There was a surge in job seekers as 736,000 entered the labour force. As a result, the labour force participation rate jumped to 62.8% from 62.6% while the employment population ratio held steady at 60.4%. The total number employed rose 222,000 while the total number unemployed rose 514,000. Full-time fell 85,000 while part-time was up 32,000. Yes, we know numbers never seem to reconcile, despite all of them coming from the same source (www.stlouisfed.org) and taken from the current population survey.
The number of those not in the labour force fell sharply by 525,000. The population level rose 211,000. The unemployment rate U3 jumped as a result 3.8% from 3.5%. The U6 unemployment rate (total unemployed, plus all persons marginally attached to the labour force, plus total employed part-time for economic reasons, as a percent of the civilian labour force, plus all persons marginally attached to the labour force) rose to 7.1% from 6.7%. All this comes against the background of a drop in job openings that fell 338,000 last reported in July. That’s back to March 2021 levels as we were coming out of the pandemic.
With the JOLTS report indicating that the number of people quitting has fallen to early 2021 levels and the number of openings falling as well, it shows that the economy is slowing. The likelihood then of a rate increase at the September 19–20 FOMC has also fallen and most are expecting the Fed to leave things unchanged. Job openings are falling in professional and business services and also healthcare and social assistance. It is somewhat uneven as the hot South experienced the biggest drop in openings while North and Northeast experienced a small rise.
So far, the job market has proven resilient to the rise in interest rates. Not so the housing market and commercial real estate market. But this is a good sign for future inflation unless oil prices take off, which they are showing signs of doing. It is interesting to note that just to keep up with working age population growth, the economy needs to generate at least 100,000 jobs every month.
Average hourly earnings slowed somewhat, up 4.3% in August vs. up 4.4% in July year-over-year (y-o-y). Initial jobless claims fell for the third week in a row to 228,000, down from a peak of 250,000 four weeks ago. That can be viewed as some strength.
We are sure that this report will be viewed as the economy is slowing but remains good; i.e. the Goldilocks Economy. The stock market rose, but not by a lot. Canada reports its job numbers next Friday.
Chart of the Week
Source: www.tradingeconomics.com
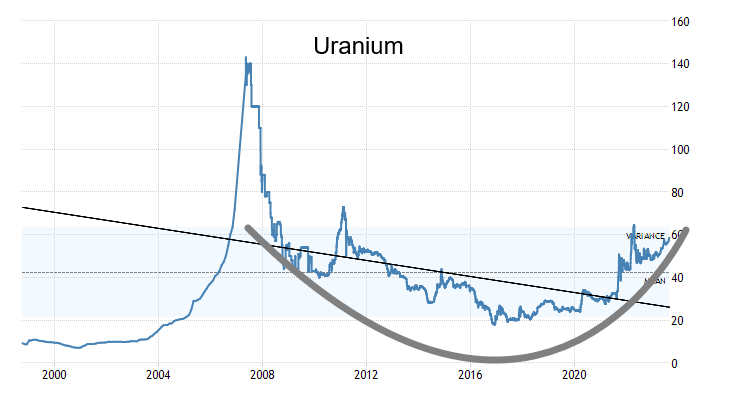
Uranium is an important metal in our life, yet it may be misunderstood and underestimated. Uranium is a radioactive silver metal. It is fairly abundant, occurring almost anywhere. It ranks closest in abundance with tin and zinc, and slightly less abundant than cobalt, lead, or molybdenum. The rarest metals are gold, platinum, osmium, iridium, palladium, ruthenium, rhodium, tellurium, and rhenium. Outside of gold, platinum, and palladium, most people haven’t even heard of the others. Many of the other metals outside of gold are actually ranked with platinum group metals. Rare earths are abundant but just not in any concentrated ore deposits. And who has the largest source of rare earths? China, and North America needs them as there is insufficient here.
Uranium is used to power nuclear reactors so it is an important element in producing electricity and is also used in medical, industrial, and, yes, defense (nuclear weapons). The trouble is, uranium is being depleted and as the world is building more nuclear reactors the demand for uranium is rising. The current supply of uranium reserves is expected to be depleted by the end of the century. New sources are hard to find, but evidence suggests there are significant undiscovered deposits. Demand is increasing but supplies are not keeping up, so that prices are rising. Some expect prices to double by 2030.
The world’s largest producer of uranium is Kazakhstan. Kazakhstan is a large, former Soviet republic that declared independence in 1991 with the collapse of the Soviet Union. However, Kazakhstan remains within Russia’s sphere and is an important ally. Kazakhstan is also aligned with China but also maintains relations with both the U.S. and Canada. Behind Kazakhstan, the next largest producers of uranium are Canada and Namibia. In terms of reserves, Kazakhstan also has the most, followed by Canada and South Africa. Kazakhstan is also the world’s largest exporter of uranium, followed again by Canada and France. But in terms of consumption, the U.S. is the largest, followed by China and France. This is why uranium is an important metal for the U.S. In terms of production and reserves the U.S. is puny, having suffered production declines steadily since 2014 to the point now where they hardly produce any.
It is no surprise then that KazAtomProm (NATKY-OTC) is the world’s largest uranium mining company. Most of its shares are owned by the National Wealth Fund of Kazakhstan. The world’s second largest company is Cameco (CCO-TSX), whose prime holdings are in the Athabasca Basin of Saskatchewan. The region supplies about 20% of the world’s needs.
The U.S. needs uranium primarily to drive its nuclear plants, but it is also used in medicine and industry, especially the defense industry. Surprisingly, Russia supplied about 12% of the U.S.’s needs in 2022. Russia also supplies about 17% of the EU’s needs. It was one of the few things that the U.S. didn’t sanction against Russia because of their huge need for uranium to drive its industry, plants, and defense (nuclear reactor fleet). Irrespective of what the U.S. gets from Russia, their largest imports are from Canada and Kazakhstan with Russia third. Part of the U.S.’s problems with uranium are abandoned mines and huge contamination of homes and water sources.
The U.S. is trying to lower its dependence on Russian uranium sources, but that is expected to take more than few years to accomplish. Russia is a cheap producer of uranium. The U.S. congress has passed a bill to limit importation from Russia, but the U.S. is still paying billions of dollars to Russia for uranium.
So, it is not surprising to see uranium prices climbing up some 128% since 2020. Could it reach the lofty heights it saw in May 2007? It reached $148 as supply disruptions hit, along with sharply rising demand coupled with floods at Cameco’s prime Cigar Lake mine in Saskatchewan. It wouldn’t take much, especially if supply disruptions occurred. That cannot be ruled out. We have a nice rounding bottom on uranium—it’s risen above its mean price and it wouldn’t take much of a push to take out that high in 2011. Once above $80 (currently near $60), uranium could soar to that 2007 high. Targets could easily be the 2007 high.
Many uranium stocks have been hitting new highs as a result of rising prices and interest. The uranium sector is a rising sector that remains largely unknown and under-owned. With the EU and U.S. stopping to buy Russian supplies. it is actually going to help push uranium prices higher. Building new plants, finding new sources, and ramping up production elsewhere will take years to accomplish, along with considerable investment and possibly increased government financing. But it won’t stop Russia from producing more for its own domestic use and supplying both its civilian and military with what is needed. The U.S. government is proposing huge subsidies to get the U.S. uranium industry up and going again. Russia could hurry things along by banning exports to the U.S. and others such as China would pick up the slack. Uranium, like oil, a geopolitical tool.
Markets & Trends
|
|
|
|
% Gains (Losses) Trends |
|
||||
|
|
Close Dec 31/22 |
Close Sep 1, 2023 |
Week |
YTD |
Daily (Short Term) |
Weekly (Intermediate) |
Monthly (Long Term) |
|
|
Stock Market Indices |
|
|
|
|
|
|
|
|
|
S&P 500 |
3,839.50 |
4,515.77 |
2.5% |
17.6% |
up (weak) |
up |
up |
|
|
Dow Jones Industrials |
33,147.25 |
34,837.71 |
1.4% |
5.1% |
neutral |
up |
up |
|
|
Dow Jones Transport |
13,391.91 |
15,835.58 |
1.4% |
18.3% |
down |
up |
up |
|
|
NASDAQ |
10,466.48 |
14,031.81 |
3.3% |
34.1% |
up (weak) |
up |
up |
|
|
S&P/TSX Composite |
19,384.92 |
20,545.36 |
3.6% |
6.0% |
up |
up |
up |
|
|
S&P/TSX Venture (CDNX) |
570.27 |
591.52 |
1.8% |
3.7% |
down |
down |
down |
|
|
S&P 600 (small) |
1,157.53 |
1,239.34 |
3.6% |
7.1% |
neutral |
neutral |
neutral |
|
|
MSCI World |
1,977.74 |
2,126.59 |
1.8% |
7.5% |
down (weak) |
neutral |
neutral |
|
|
Bitcoin |
16,531.31 |
25,576.56 |
(1.5)% |
54.7% |
down |
neutral |
neutral |
|
|
|
|
|
|
|
|
|
|
|
|
Gold Mining Stock Indices |
|
|
|
|
|
|
|
|
|
Gold Bugs Index (HUI) |
229.75 |
225.74 |
2.1% |
(1.8)% |
down |
down |
down |
|
|
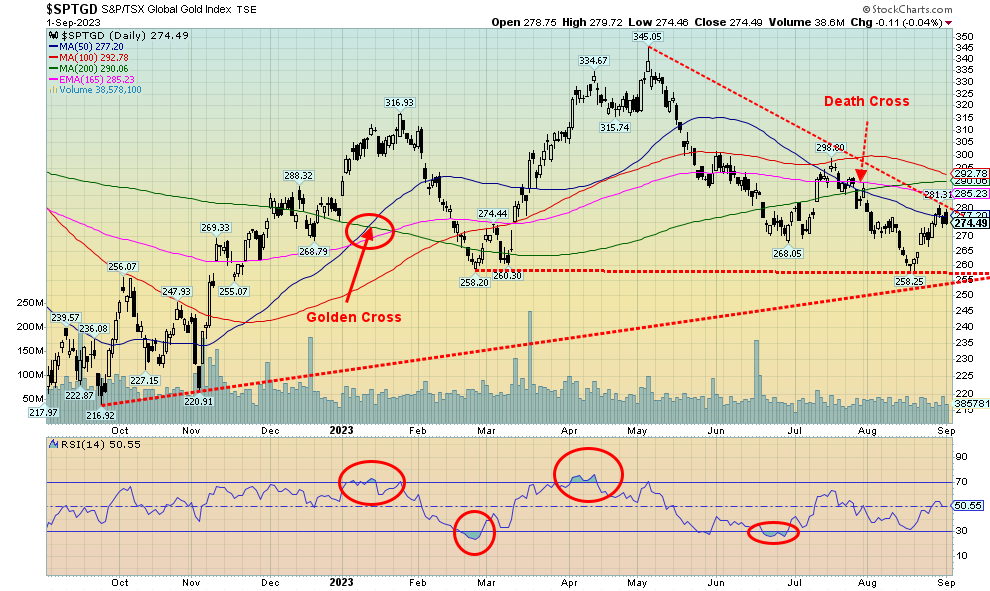
TSX Gold Index (TGD) |
277.68 |
274.49 |
2.1% |
(1.2)% |
down |
down |
down |
|
|
|
|
|
|
|
|
|
|
|
|
% |
|
|
|
|
|
|
|
|
|
U.S. 10-Year Treasury Bond yield |
3.88% |
4.18% |
(1.2)% |
7.7% |
|
|
|
|
|
Cdn. 10-Year Bond CGB yield |
3.29% |
3.57% |
(3.5)% |
8.5% |
|
|
|
|
|
Recession Watch Spreads |
|
|
|
|
|
|
|
|
|
U.S. 2-year 10-year Treasury spread |
(0.55)% |
(0.69)% |
18.8% |
(25.4)% |
|
|
|
|
|
Cdn 2-year 10-year CGB spread |
(0.76)% |
(0.98% |
10.1% |
(29.0)% |
|
|
|
|
|
|
|
|
|
|
|
|
|
|
|
Currencies |
|
|
|
|
|
|
|
|
|
US$ Index |
103.27 |
104.28 |
1.0% |
1.0% |
up |
up |
up |
|
|
Canadian $ |
73.92 |
73.55 |
flat |
(0.5)% |
down |
down |
down |
|
|
Euro |
107.04 |
107.77 |
(0.2)% |
0.7% |
down |
neutral |
down (weak) |
|
|
Swiss Franc |
108.15 |
112.90 |
(0.1)% |
4.4% |
down |
up |
up |
|
|
British Pound |
120.96 |
125.91 |
flat |
4.1% |
down |
up |
neutral |
|
|
Japanese Yen |
76.27 |
68.42 |
0.2% |
(10.3)% |
down |
down |
down |
|
|
|
|
|
|
|
|
|
|
|
|
|
|
|
|
|
|
|
|
|
|
Precious Metals |
|
|
|
|
|
|
|
|
|
Gold |
1,826.20 |
1,967.10 |
1.4% |
7.7% |
up |
up (weak) |
up |
|
|
Silver |
24.04 |
24.56 |
1.4% |
2.2% |
up (weak) |
up |
neutral |
|
|
Platinum |
1,082.90 |
968.70 |
2.2% |
(10.6)% |
up |
down (weak) |
down |
|
|
|
|
|
|
|
|
|
|
|
|
Base Metals |
|
|
|
|
|
|
|
|
|
Palladium |
1,798.00 |
1,227.40 |
(0.1)% |
(31.7)% |
down |
down |
down |
|
|
Copper |
3.81 |
3.85 |
2.3% |
1.1% |
up |
down (weak) |
neutral |
|
|
|
|
|
|
|
|
|
|
|
|
Energy |
|
|
|
|
|
|
|
|
|
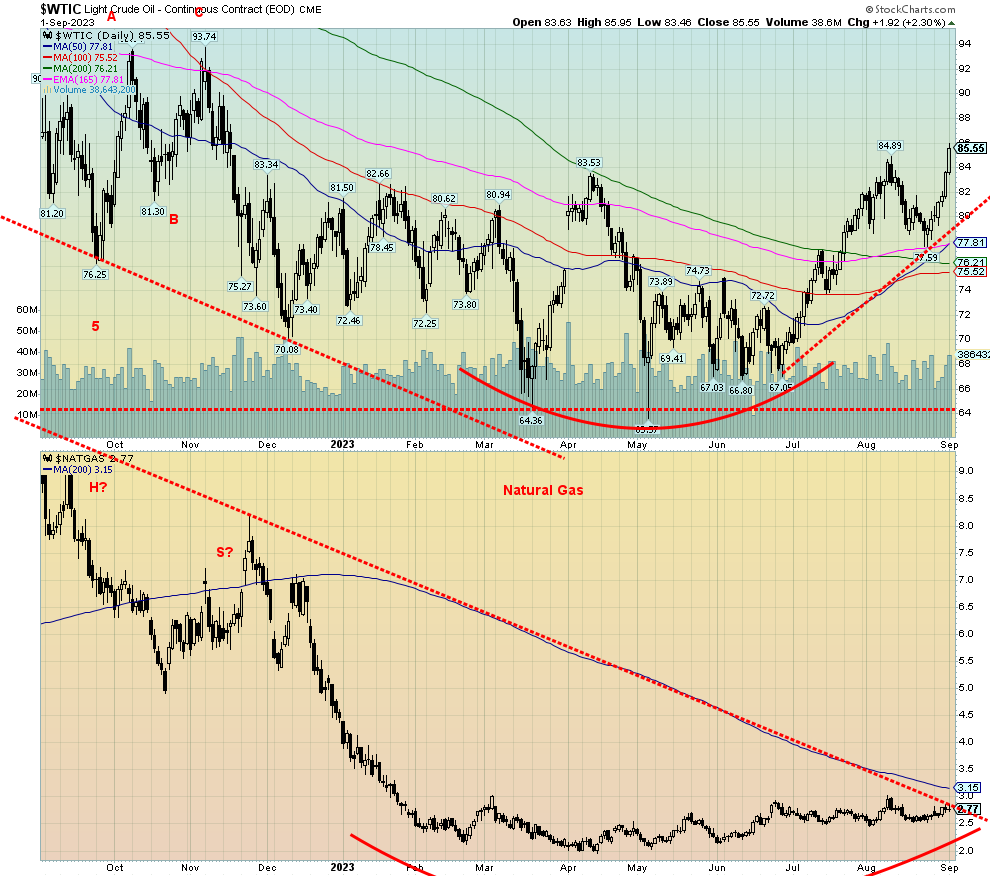
WTI Oil |
80.26 |
85.55 |
7.2% |
6.6% |
up |
up |
up |
|
|
Nat Gas |
4.48 |
2.77 |
4.0% |
(38.3)% |
up |
neutral |
down |
|
Source: www.stockcharts.com
Note: For an explanation of the trends, see the glossary at the end of this article.
New highs/lows refer to new 52-week highs/lows and, in some cases, all-time highs.
Source: www.stockcharts.com
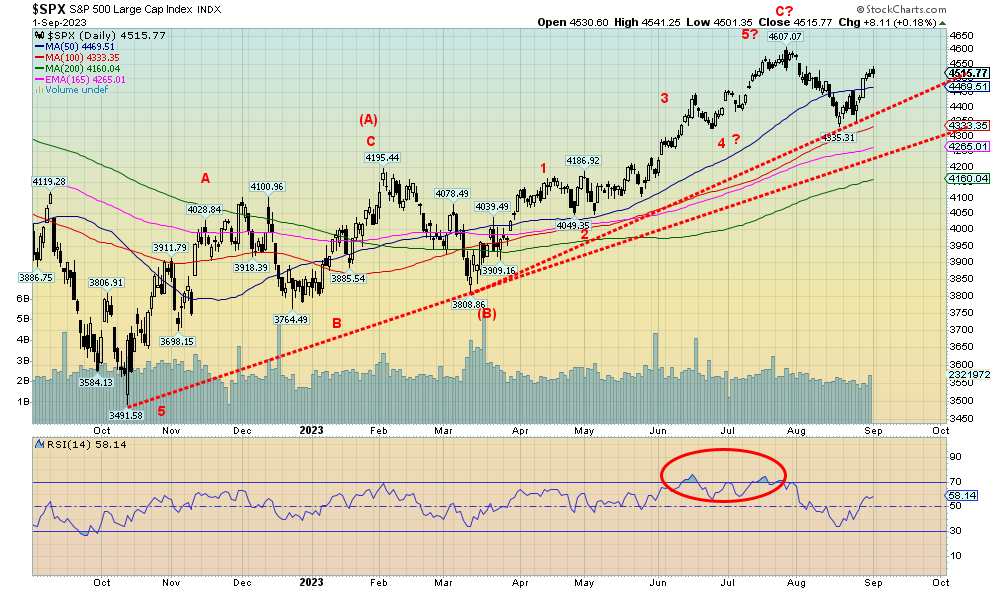
Stocks enjoyed a positive week. However, our belief is that this is a rebound rally to test the recent highs seen early August at 4,607 and not the start of anything new to the upside.
Source: www.stockcharts.com
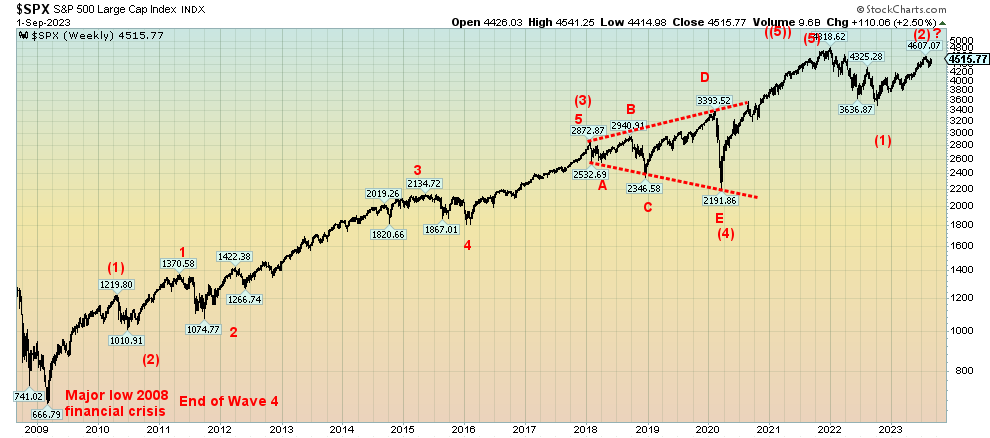
Our long-term chart of the S&P 500 shows that we most likely made a cyclical five-wave advance from the lows of March 2009. It topped in January 2022. The first wave down bottomed in October 2022. Since then, we have been on the second wave up which we now believe may have topped in August 2023. The question is, has the retest of the highs finished or do we have a bit more to go? Often these return waves can see new highs.
This past week, the S&P 500 gained 2.5% and the Dow Jones Industrials (DJI) was up 1.4%, as was the Dow Jones Transportations (DJT). The NASDAQ gained 3.3% while the S&P 500 Equal Weight was up 2.2% and the NY FANG Index gained 4.3%. The S&P 400 (Mid) was up 3.5% while the S&P 600 (Small) gained 3.6%. Bitcoin was our loser, down 1.5% and staying under $26,000 despite a strong rebound earlier in the week.
In Canada, the TSX Composite was up 3.6% and the TSX Venture Exchange (CDNX) gained 1.8%. In Europe, the London FTSE gained 1.7%, the EuroNext was up 1.3%, the Paris CAC 40 was up 0.9%, and the German DAX gained 1.3%. In Asia, China rebounded with the Shanghai Index (SSEC) up 2.3%, the Tokyo Nikkei Dow (TKN) gaining 3.4%, and Hong Kong’s Hang Seng (HSI) up 2.4%. The MSCI World Index gained 1.8%.
While we are rebounding, we believe this is only minor wave 2. Minor wave 1 bottomed at 4,335 in August. It is possible for this wave to see new highs. We’ve seen that happen before. We had long held targets at 4,800 and we fell short with the high at 4,607. A breakdown under 4,400 would probably end any thoughts of new highs. A move above 4,540 would, however, suggest new highs ahead. The job numbers this past week steadied the markets, although the S&P 500 closed higher Friday while the NASDAQ did not.
With signs that the U.S. economy is slowing, China slowing, and the EU slowing with some countries in recession already (Germany), we expect that September may maintain its reputation as the weakest month of the year. September ranks 12th out of all the months for the stock market. As well, in pre-election years, September has been a consistent loser. Maybe we started off well to end August, but trouble could be looming. The worst part of the month is typically towards the end. Remember the Lehman Brothers collapse that came in September 2008. Watch the triple witching week ending September 15. What’s key now is that August low. If that breaks, then we are on our way for the next wave down. New highs, as we note, are not an indication that halleluiah, happy days are here again.
Source: www.stockcharts.com
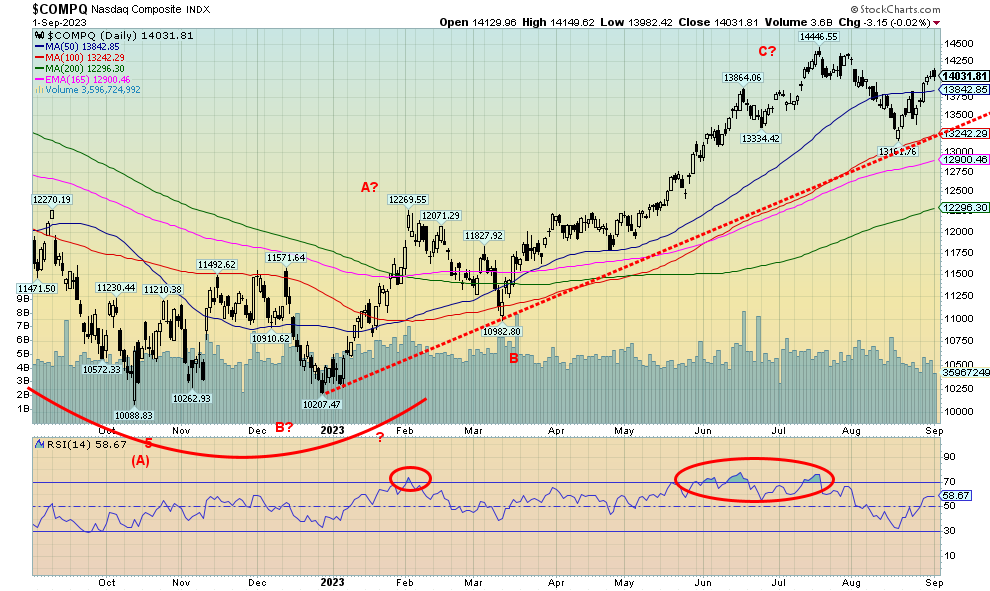
The NASDAQ, thanks once again to the FAANGs, gained 3.3% this past week. The NY FANG Index was up 4.3%, led by a 6.1% gain for Apple. Yes, Baidu gained 9.5%, but the Chinese stocks tend to be discounted. Google jumped to new all-time highs, up 4.7% on the week. Other good gainers were Netflix, up 5.8%, Alibaba, up 5.5%, and Advanced Micro AMD, up 7.1%. The NASDAQ jumped over the 50-day MA and appears poised to move higher. Friday saw the index fall after making a new high so that has to be watched carefully. A breakdown under 13,500 would signal trouble and, under 13,200, bigger trouble. The 200-day MA is at 12,295, so we have a way to fall before a bear market could be signaled. But the high of 14,446 could remain elusive as all this is a rebound rally to test the high. If we fail to take out that July high, then the next likely move is down, not up. The entire move from October/December 2022 appears to us as a corrective up move and not the start of a new longer term bull market.
Source: www.stockcharts.com
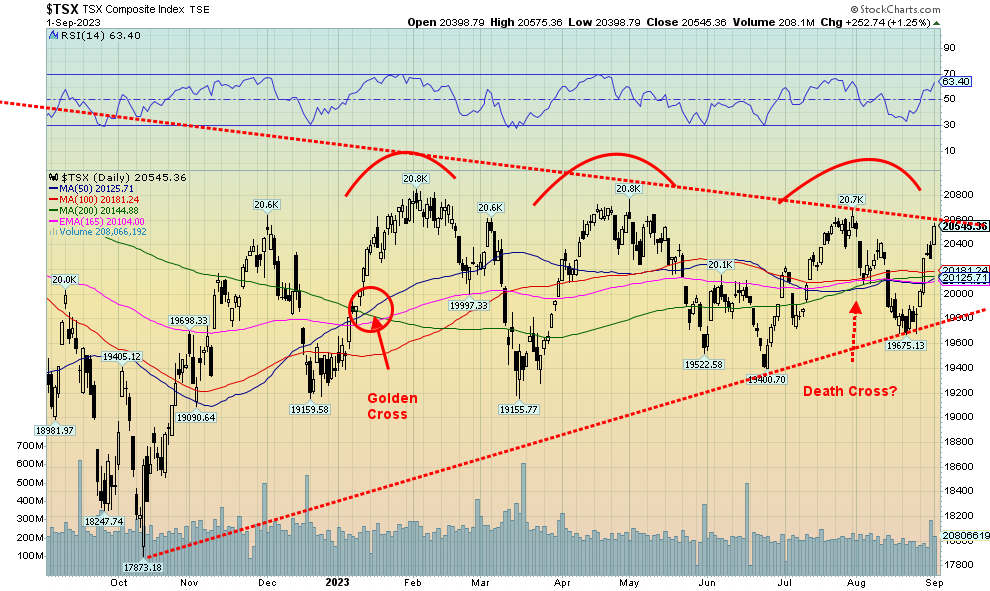
The TSX Composite had a good week, gaining 3.6%. The junior TSX Venture Exchange (CDNX) also was up, gaining 1.8%. All 14 sub-indices were up on the week, led by Information Technology (TKK), up 7.7%, and followed by Energy (TEN), gaining about 6.0%. Other significant winners were Metals & Mining (TGM), up 4.4%, and Health Care (THC), gaining 7.9%, which was actually the best but the sector in the context of the TSX is small. Cannabis stocks had a very good week, but that volatile sector could change on a dime.
What we do find potentially intriguing is that the TSX appears to have made a triple top and now here we are right back at those highs. Triple tops are very rare and we do appear to be on the cusp of breaking out to the upside. If that is correct, then our expectations are that the leaders could be the commodity sectors of golds, energy, metals, and materials. We’ll reserve our thoughts of a breakthrough for the TSX until we firmly break above 20,600 and take out 20,800 the highs seen in January 2023 and again in April 2023. Commodities led to those highs as they did once again in July 2023. Energy is the second-largest sector on the TSX, followed by materials, which also includes golds and metals. Financials is the largest sector. We’ve seen articles purporting that cyclicals are the next likely group to move higher. The TSX is synonymous with cyclicals.
Just in case we are wrong, the breakdown point for the TSX is under 19,800. The 50-day MA and the 200-day MA are skating along together, technically giving us a “death cross,” but it may not last if this up move is realized.
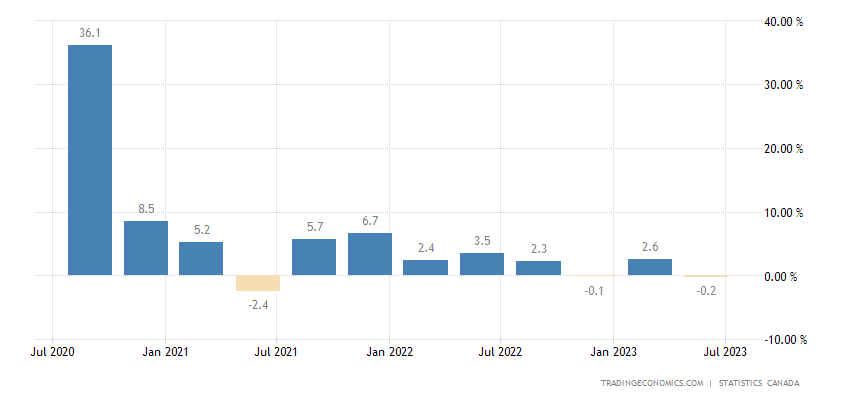
Canada GDP Annualized Growth 2020–2023
Source: www.tradingeconomics.com, www.statcan.gc.ca
Canada’s GDP annualized growth slipped 0.2% in Q2, below the expected gain of 1.2%. It was the second decline in the past three quarters, but it doesn’t signal an impending recession just yet. That requires two consecutive quarters of negative GDP growth. Things are looking a bit negative for Q3, so we could enter an official mild recession. If that were the case, we’d be joining the recession already underway in the EU, led by Germany. The U.S. is also showing signs of slowing and the adage is, if the U.S. catches a cold, Canada gets a fever. Given this, the expectations for the Bank of Canada (BofC) rate meeting on September 6 is that they will leave things unchanged. On a quarter-over-quarter basis, they last reported that Q1 saw GDP growth of 2.21%.
Problems in the Canadian economy are being generated by the wildfires, the sliding consumer mortgage market where defaults are rising, the stagnant and tippy commercial real estate market, a decline in retail spending, rising credit card delinquency, a slowdown in business inventories, and also rising imports as exports slow.
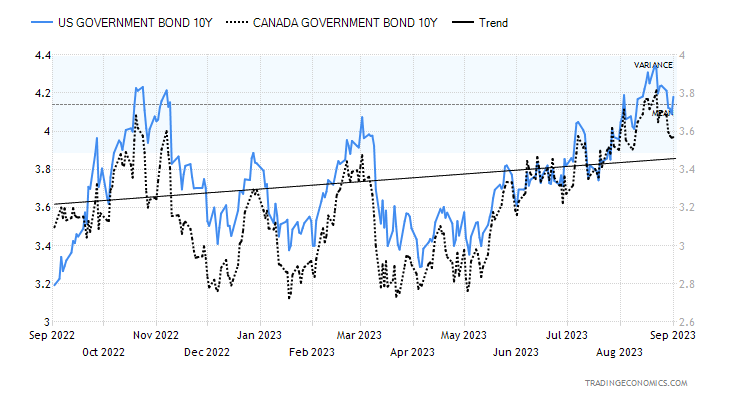
U.S. 10-year Treasury Bond/Canadian 10-year Government Bond (CGB)
Source: www.tradingeconomics.com, www.home.treasury.gov, www.bankofcanada.ca
With some signs of a slowing economy following Friday’s job numbers, yields on the 10-year treasury note fell this past week. The U.S. 10-year fell 1.2% to 4.18% from 4.23%. The Canadian 10-year Government of Canada bond (CGB) was down to 3.57% from 3.7% a decline of 3.70%. More intriguing was the decline in the 2–10 spreads. The U.S. 2–10 spread was down to 69 bp from 85 bp or a drop of 18.8%. The Canadian 2–10 spread fell 11 bp to 98 bp from 109 bp or 10.1% against the backdrop of the unexpected Q2 GDP decline. We have often noted that when the 2-10 spread and also the 3 month-10 spread bottom the recession could be underway. The current 3 month-10 spread is 135 bp. The low of 189 bp was seen in March/April 2023.
While the U.S. job numbers were about as expected, it was the jump in the unemployment rate (U3) that caught people’s attention. Canada reports its August job numbers this coming Friday. The market is looking for job losses of about 8,000 and a jump in the unemployment rate to 5.7% from 5.5%.
Besides the job numbers on Friday, the market also saw the latest PMI manufacturing indices. The ISM Index was 47.6, slightly above expectations but still in what one would call recessionary territory. Construction spending surprised to the upside with a gain of 0.7% in July, above the expected gain of 0.5%. This week we get factory orders (expecting a decline of 0.2%) and the ISM Services Index which should still be in positive territory.
This past week we saw the Conference Board’s Consumer Confidence Index which was 106.1, below the expected 116. We already noted the JOLTS job openings coming in at 8.827 million, below the consensus of 9.57 million. ADP employment was 177,000, below the consensus of 210,000. But corporate profits for Q2 were an unexpected +1.6% when they had expected a decline of 5.0%. That was good for stocks. Pending home sales y-o-y were down 14% below the consensus of down 12%. This adds to growing bearishness about the housing market.
While we have entered a new period of higher interest rates, it is possible that we have topped for the time being. However, don’t expect a big decline in rates as our expectations are that higher rates are here to stay. A new reality.
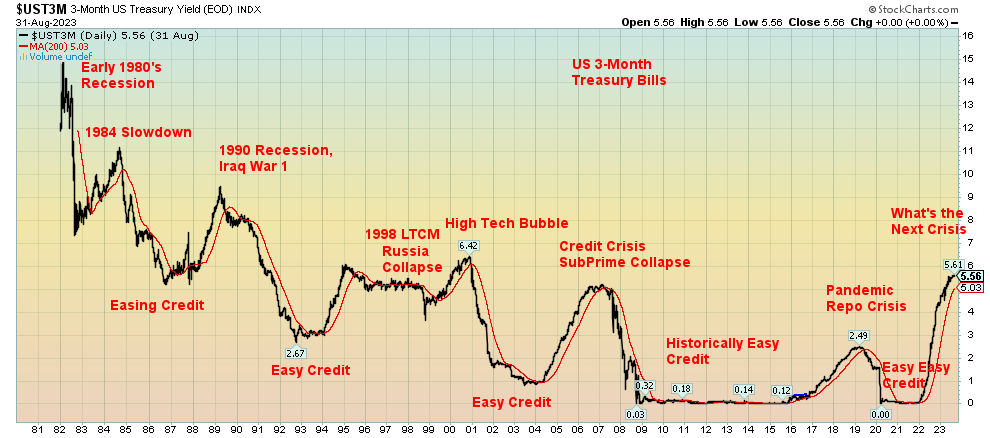
Source: www.stockcharts.com
We saw a similar chart at Elliott Wave International (www.elliottwave.com). But this is our own. Amazing how those periods of easy credit are followed by a spike in interest rates, which in turn sparks a crisis and then a recession. In early March 2023 we had the collapse of three large regional banks: SVB Bank, Signature Bank, and First Republic Bank. Tip of the iceberg? Rating agencies are slashing credit ratings for other banks. Now things are heating up in the commercial real estate market, the mortgage market for homeowners, student loans, and credit cards. Is there a big one out there? An AIG, a Bear Stearns, or a Lehman Brothers? All are a part of what is called the shadow banking system. No, this time is not different. The question is when, not if.
Source: www.stockcharts.com
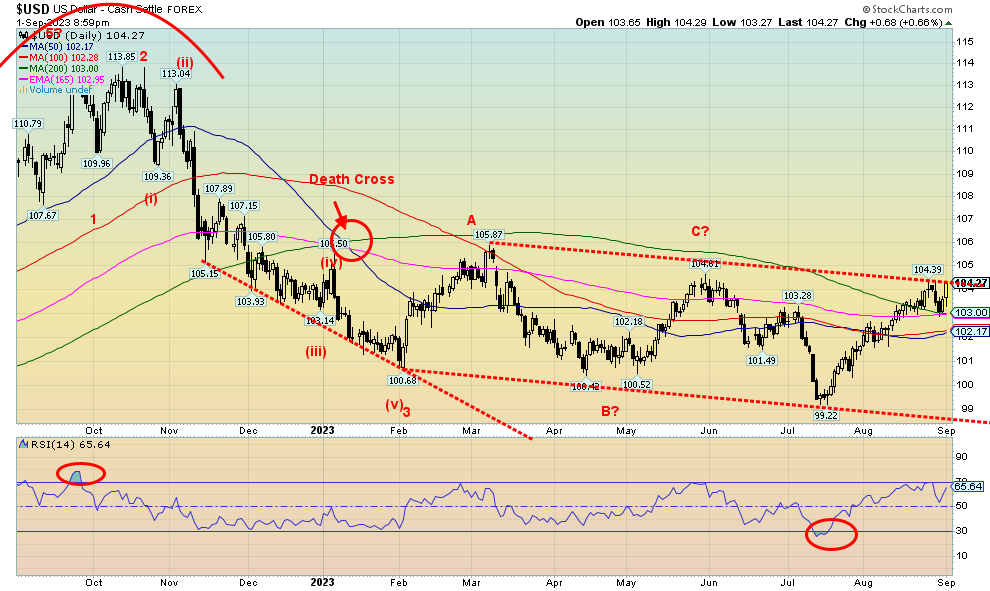
The US$ Index (USDX) had a nice three-day decline earlier in the week, but by Friday following the job numbers, it was right back at the recent highs, just above 104. This suggests that the US$ Index has further to go before this current rally is over. That gold and silver have been able to rally in the face of the stronger USDX shows more the strength and resilience of the precious metals than it does the strength of USDX.
USDX gained about 1.0% this past week. The euro fell 0.2%, the Swiss franc was off 0.1%, and the pound sterling was essentially flat, while the Japanese yen gained about 0.2%. The Canadian dollar was flat on the week, given the weaker than expected GDP released on Friday.
It is hard to interpret the three-day decline followed by a rebound right back to the highs. It could be head fake or a way to shake out weak shorts. Only new lows below 103 would confirm it was an attempted shake-out of shorts. Otherwise, next resistance is up near that March 2023 high of 105.87. Overall, the pattern appears to us as somewhat bearish as we appear to have a downward-sloping channel. The major breakdown continues to be near 99. The entire pattern appears to us as a possible ABCDE-type of corrective. Once finished, we should then embark on a more dangerous wave to the downside. That would only be confirmed with a breakdown under 99. Failure to follow through this coming week would be negative for USDX going forward.
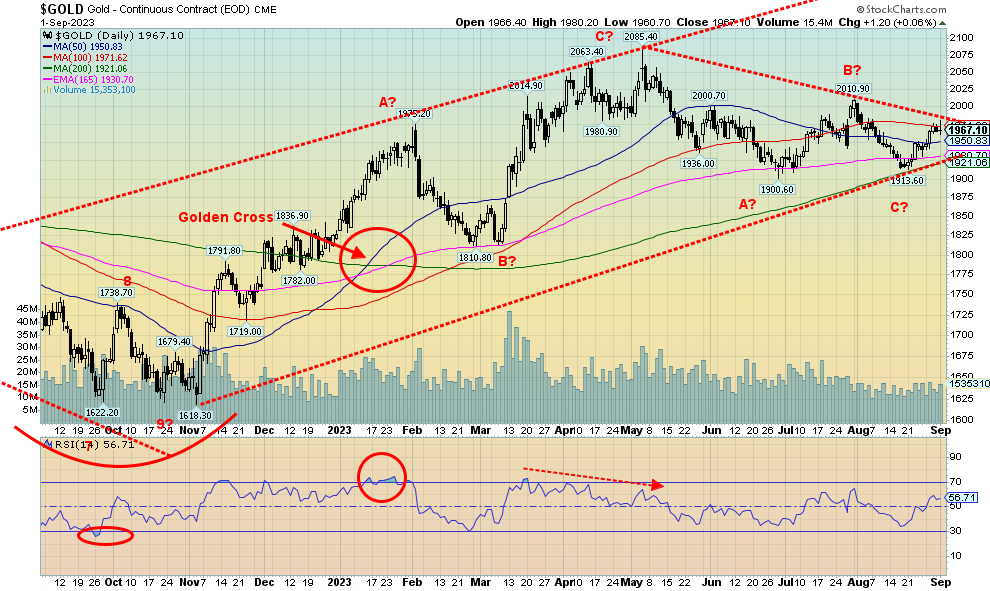
Source: www.stockcharts.com
Gold continues to be the best performer. Since 2000, gold is up about 580% while silver has gained 350%. Nobody else is close. Platinum is up 129% and palladium up 173%. But the stocks have been less than stellar. The TSX Gold Index (TGD) is up 144% while the S&P 500 is up 207%, with the TSX Composite an underwhelming 144%. Since 2000, gold (the commodity, not the stocks) has been the place to be.
This past week, gold rose 1.4% as did silver. Platinum gained 2.2% but palladium lost 0.1% while copper was up 2.3%. The Gold Bugs Index (HUI) gained 2.1% as did the TGD. Signs of a slowing economy that should give pause to the Fed on rate hikes was the main driver behind the gains in the precious metals sector.
This past week gold saw highs of $1,967, making a new high for the current up move. But it fell short of the next level of resistance at $1,980/$2,000. Below lies support at $1,950, but a breakdown under $1,920 would signal further declines ahead. We could say we have a potential double bottom in place at $1,900 in June and $1,913 in August. However, the reality is we need a firm break above $2,000/$2010 to tell us we are going higher. Above $2,050 new highs above $2,089 are possible.
We have continued to argue that triple tops are rare, so the odds favour new highs eventually. The highs were $2,089 in August 2020, $2,078 in March 2022, and $2,085 in May 2023. The all-time high on an inflation-adjusted basis was January 1980. Today that would be over $2,600. Only new highs would confirm that our long-term cycle lows of 7.83 years and 23.5 years are in. That the low would be higher than the lows of 2001, 2008, and 2015 translates for us as bullish for gold in the longer term. The high for the current cycle is most likely that August 2020 high, but we have no confirmation of the low until the high is firmly taken out. New highs for gold would also be bullish for both silver and the gold stocks, both of which have languished. We remain positive, but only new highs would end thoughts of another downdraft in price later in Q4.
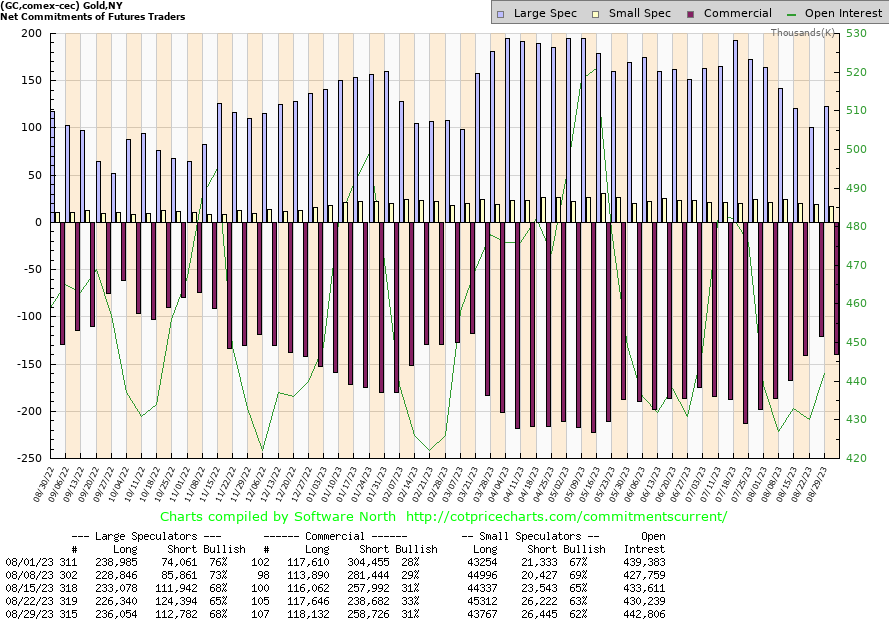
Source: www.cotpricecharts.com
We got our COT charts back. Amazing what a subscription will do. The gold commercial COT (bullion companies and banks) slipped to 31% this past week from 33%. Still, longs were up about 500 contracts while shorts jumped about 18,000 contracts. The large speculators COT rose to 68% from 65% as their longs jumped almost 10,000 contracts while shorts fell about 12,000 contracts. The fall in the commercial COT is mildly bearish, but we will await next week’s report to see if this follows through to the downside further. We never really got that bullish from the COT report.
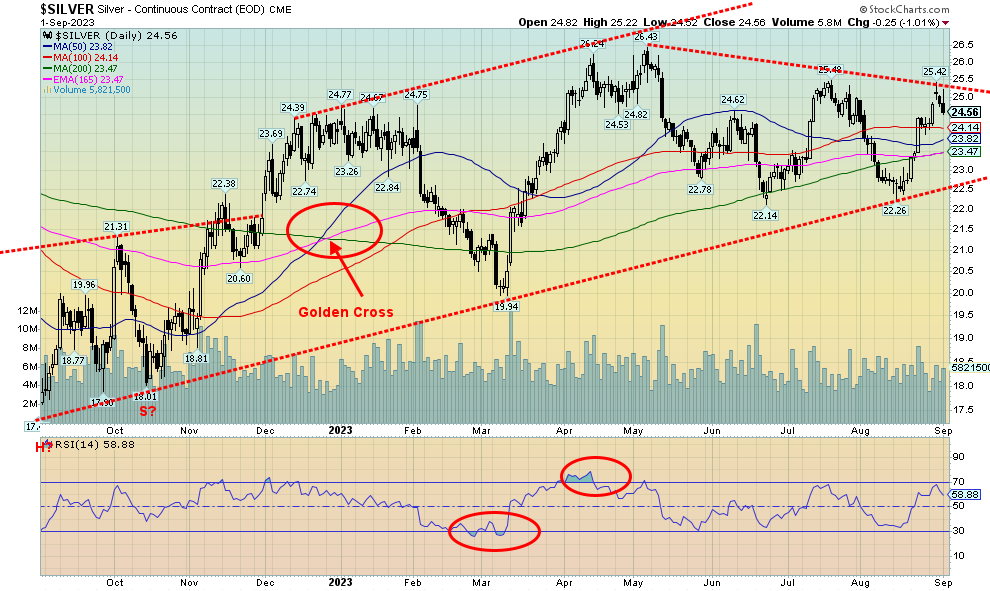
Source: www.stockcharts.com
Silver had an up week of 1.4%. That’s the good news. The bad news is we were rejected at $25.50 as we fell back to $24.56 by Friday’s close. The move from the August low of $22.26 looks impulsive, but we really need confirmation that we are going higher by first taking out $26 and then taking out the April high of $26.43. Despite a decent move of 10%+ from that August low, silver remains a huge underperformer. While gold was making new highs, silver is nowhere near its 1980 or 2011 high. Both were just below $50. Cries of $300 silver, as we have read in some quarters, seem rather far-fetched. When both gold and silver, along with the gold stocks, are making new highs, then we are far more in synch. But until now only gold has shown that strength while the others lag badly.
We could argue that we are forming a descending triangle which is bearish. Since the May high of $26.43, we have made lower highs while making flat lows at $22.14 in June and $22.26 in August. The rejection this past week at $25.50 is therefore a bit concerning and that’s why we need to see new highs and soon. Major support is down to $22.50, but a break under that level could suddenly target down to near $18. Volume remains somewhat tepid and the recent COT report is not overly friendly. Hence, that’s why making new highs above $25.50 is important and, even more important, new highs above $26.50.
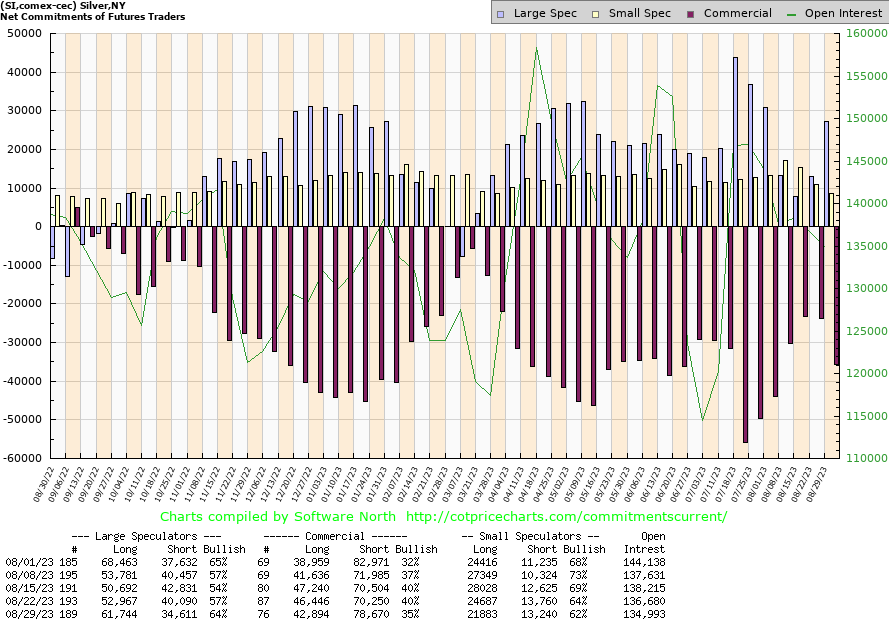
Source: www.cotpricecharts.com
The silver commercial COT fell sharply this past week to 35% from 40%, while the large speculators COT jumped to 64% from 57%. Is this implying that silver is topping? For the commercial COT, longs fell about 4,000 contracts while shorts jumped just over 8,000 contracts. For the large speculators, longs jumped about 9.000 contracts while shorts fell nearly 6,000 contracts. It’s only one week and it was on a week where silver’s rally stalled. We can’t jump to conclusions yet, but on the other hand we shouldn’t ignore it either. Next week should give us more clues.
Source: www.stockcharts.com
It almost appears as if the gold stocks are in trouble. We say that, despite a gain this past week for the TSX Gold Index (TGD) of 2.1% while the Gold Bugs Index (HUI) was also up 2.1%. The trouble is the gold stocks have been in a slump, despite the recent bounce-back. We received the deadly “death cross” back in late July, signaling a bear market. For gold stocks, yes, but not gold itself. Nor for silver. A divergence? Are the gold stocks leading or just falling behind?
Gold stocks are notoriously volatile. Far more than the commodity itself. The longest-running chart of gold stocks that we know of is the Philadelphia Gold and Silver Index (XAU). From 2000 to 2011 the index rose over 450%. Then from 2011 to 2015 it collapsed 84%. In 2015 the index was below its low of 2000. Misery loves gold stocks. Since that 2015 low the XAU is up over 200%, but at its height in early 2022 it was up about 350%. Love that volatility. The Gold Miners Bullish Percent Index (BPGDM) is dragging low, currently at about 18%. No, that’s not rock bottom. In 2015 at that low it hit zero (0). The best we can say for the TGD is that at least it is in the upper range of long-term price history. Still, the TGD is down about 40% from its all-time high in 2011 while the HUI is still down about 65% from its all-time high.
Then there are the junior gold miners that drill and look for gold. Gold, along with platinum and palladium, is amongst the rarest of metals. That’s why it is so valuable and, along with being indestructible, no wonder it has served as money for thousands of years. That we no longer have a gold standard only highlights the worthlessness of today’s money that isn’t really worth the paper it’s printed on. And why we and others say that the current fiat experiment will eventually end. After all, fiat money’s ultimate worth is zero. But that is not going to happen overnight.
The TGD has bounced back to the 50-day MA. It really needs to break out over 300 to suggest to us we are going higher. Under 255, the TGD could be embarking on a new bear move to the downside. We continue to rate the sector as a buy/accumulate.
Source: www.stockcharts.com
Oil prices are breaking out further, having closed over $85. Based on the recent pullback to $79.59, potential upside targets are just over $90. We have higher targets to $95/$96 as well. It’s a combination of rising demand, falling U.S. inventories, and continued and extended cutbacks from OPEC. Higher oil prices usually translate into higher prices at the pump. As well, natural gas (NG) appears poised to break out of that long downtrend line. Still, we’d use a firm breakout over $3/$3.15 as our point of reference that NG is on its way higher.
Further risks could come with the weather as the hurricane season gets underway. The Gulf of Mexico is full of rigs and have shut down before. Refineries dot the U.S. coast. Usually, the best six months for both oil and gas are December to June. That is still three months away and prices are rising. This past week WTI oil rose some $5.70 or 7.2%. Brent crude, which is more prevalent outside of North America, jumped 4.2%. NG at the Henry Hub in Texas rose 4.0% and the EU Dutch Hub NG was up 2.4%. Energy stocks enjoyed the rise in the commodity price as the ARCA Oil & Gas Index (XOI) surged 3.5% and the TSX Energy Index (TEN) was up almost 6.0%. Both indices are rapidly approaching new all-time highs.
Breakdown for WTI oil doesn’t come until under $80 and for NG only new lows would signal big trouble. That rounding bottom for NG remains compelling.
GLOSSARY
Trends
Daily – Short-term trend (For swing traders)
Weekly – Intermediate-term trend (For long-term trend followers)
Monthly – Long-term secular trend (For long-term trend followers)
Up – The trend is up.
Down – The trend is down
Neutral – Indicators are mostly neutral. A trend change might be in the offing.
Weak – The trend is still up or down but it is weakening. It is also a sign that the trend might change.
Topping – Indicators are suggesting that while the trend remains up there are considerable signs that suggest that the market is topping.
Bottoming – Indicators are suggesting that while the trend is down there are considerable signs that suggest that the market is bottoming.
Disclaimer
David Chapman is not a registered advisory service and is not an exempt market dealer (EMD) nor a licensed financial advisor. He does not and cannot give individualised market advice. David Chapman has worked in the financial industry for over 40 years including large financial corporations, banks, and investment dealers. The information in this newsletter is intended only for informational and educational purposes. It should not be construed as an offer, a solicitation of an offer or sale of any security. Every effort is made to provide accurate and complete information. However, we cannot guarantee that there will be no errors. We make no claims, promises or guarantees about the accuracy, completeness, or adequacy of the contents of this commentary and expressly disclaim liability for errors and omissions in the contents of this commentary. David Chapman will always use his best efforts to ensure the accuracy and timeliness of all information. The reader assumes all risk when trading in securities and David Chapman advises consulting a licensed professional financial advisor or portfolio manager such as Enriched Investing Incorporated before proceeding with any trade or idea presented in this newsletter. David Chapman may own shares in companies mentioned in this newsletter. Before making an investment, prospective investors should review each security’s offering documents which summarize the objectives, fees, expenses and associated risks. David Chapman shares his ideas and opinions for informational and educational purposes only and expects the reader to perform due diligence before considering a position in any security. That includes consulting with your own licensed professional financial advisor such as Enriched Investing Incorporated. Performance is not guaranteed, values change frequently, and past performance may not be repeated.
About the author


Website: https://www.enrichedinvesting.com
Disclaimer: David Chapman is not a registered advisory service and is not an exempt market dealer (EMD) nor a licensed financial advisor. We do not and cannot give individualised market advice. David Chapman has worked in the financial industry for over 40 years including large financial corporations, banks, and investment dealers. The information in this newsletter is intended only for informational and educational purposes. It should not be considered a solicitation of an offer or sale of any security. The reader assumes all risk when trading in securities and David Chapman advises consulting a licensed professional financial advisor before proceeding with any trade or idea presented in this newsletter. David Chapman may own shares in companies mentioned in this newsletter. We share our ideas and opinions for informational and educational purposes only and expect the reader to perform due diligence before considering a position in any security. That includes consulting with your own licensed professional financial advisor.