
Does the velocity of money need to increase for inflation to take hold?
This week a post on Twitter garnered over 2,700 retweets and almost 20,000 likes. The tweet was from Cathie Wood, the founder of Arkinvest.
The tweet made the argument that inflation didn’t take hold after 2008-09 because the velocity of money fell instead, and since it is still falling that inflation is not a current issue either. However, Cathie Wood’s assertion inflation cannot happen because the velocity of money is falling has no basis in reality.
Here’s why…
What is Velocity of Money?
Dusting off our economic textbook: The velocity of money (velocity) is the average number of times per year that a dollar is spent in buying the total amount of goods and services produced in the economy.
The most common measure of velocity is GDP, which adds up all the goods and services produced by an economy divided by M2 money supply which adds up all the cash, chequing deposits, and other deposits that are readily converted into cash, such as savings accounts and money market accounts in the economy.
Velocity = GDP/M2 The chart below shows US M2 velocity, and we can indeed see that velocity has declined from a ratio of 1.8 in 1960 to 1.1 as of June 2021.
This means that the average dollar bill is spent 1.1 times in a year compared to 1.8 times in 1960 – and down from a peak of a dollar being spent 2.2 in 1997.
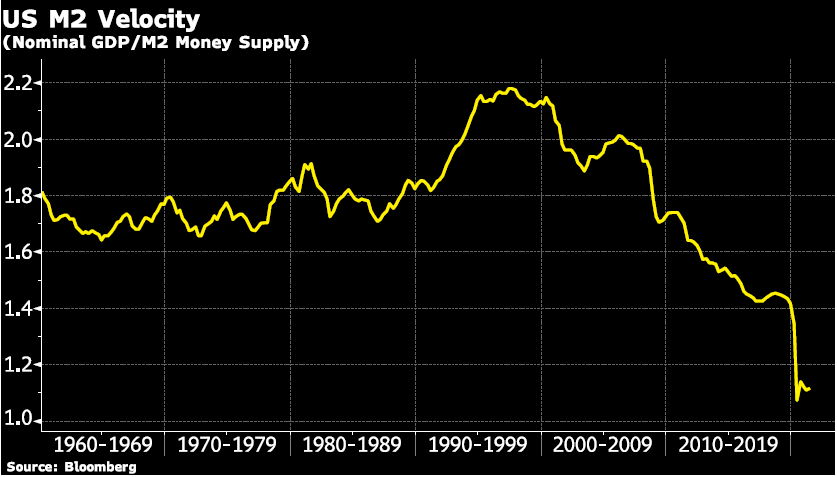 Velocity = GDP/M2 Chart
Equation of Exchange
So, what does this have to do with inflation?
The theory goes back to Irving Fisher’s view of The Purchasing Power of Money published in 1911, in which he discussed the Quantity Theory of Money. Fischer’s view was that velocity was fairly constant in the short run.
Fisher’s view was that nominal GDP was solely determined by changes in the money supply. By this reasoning, if the money supply doubles then nominal GDP would also double. This means either prices or actual output would also double!
Taking a step back let’s look at the equation definition we described above in a different way. If we take the equation form above Velocity = GDP/M2 and break it down further, we get Velocity (V)= Price level (P) * aggregate output or total income (Y) / Money supply (M).
Then we multiply both sides of this definition by M and we get: M * V = P * Y, which is known as the Equation of Exchange.
Now we can see Fisher’s view a bit clearer: if velocity is constant and money supply doubles (the M * V portion of the equation) and this equals nominal GDP (P * Y portion of the equation), then nominal GDP doubles
However, as we can see from the chart above Fischer’s view that velocity is constant in the short-term does not hold in today’s world.
Money supply has grown exponentially in the last 20 years. However, instead of nominal GDP also growing exponentially, Velocity has instead declined.
One reason for this is that the U.S. is much less reliant on cash than it was when Fisher developed his theory.
Today charge and credit accounts are much more prevalent and used in everyday transactions, which makes the economy less reliant on cash.
This means that less money is required for nominal GDP to grow. Not to mention the growing ease of transactions through completely non-cash methods. Which are cryptocurrency, or remittance payments sent to other countries are now done through an app.
And the peak in velocity in 1997 also coincides with when US net-household wealth started to outpace GDP. The chart below shows US Nominal GDP and US Household Net-Worth (household assets minus debt) both set to 100 on March 31, 1960.
These grew in tandem until around 1997 when household net-worth started outpacing nominal GDP growth. This is around the dawn of the internet age when more households had access to broader investing tools. And there is little doubt that asset price inflation has been a phenomenon for the last 20 years.
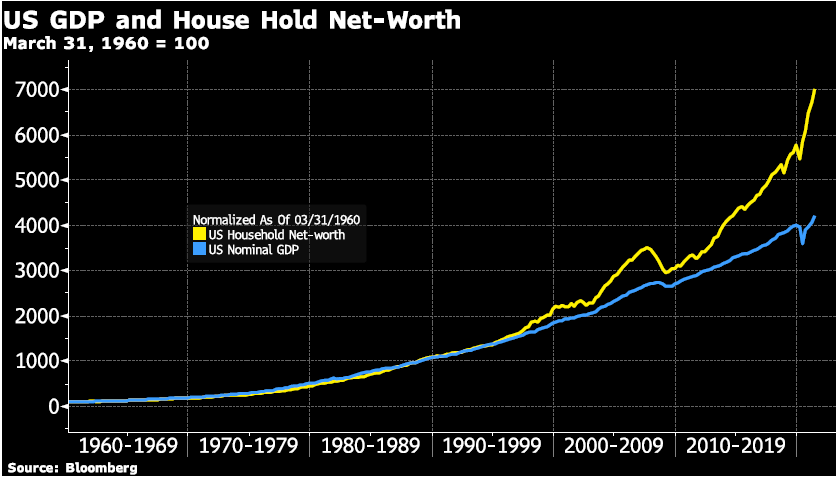 US Nominal GDP and US Household Net-Worth Chart
The last chart we leave readers with is the US M2 Velocity chart with the year-over-year change in US consumer price inflation included.
Back in 1980 when inflation did increase 14% year-over-year, the increase in velocity increased only a negligible 1.7 to 1.9. However, when velocity hit its peak in 1997, US consumer price inflation was a much lower 3.3%.
In other words, the relationship between velocity and inflation is not clear. Which means Cathie Wood’s assertion inflation cannot happen because the velocity of money is falling has no basis in reality.
Inflation can happen anytime, and we see that in the long run march of precious metals prices.
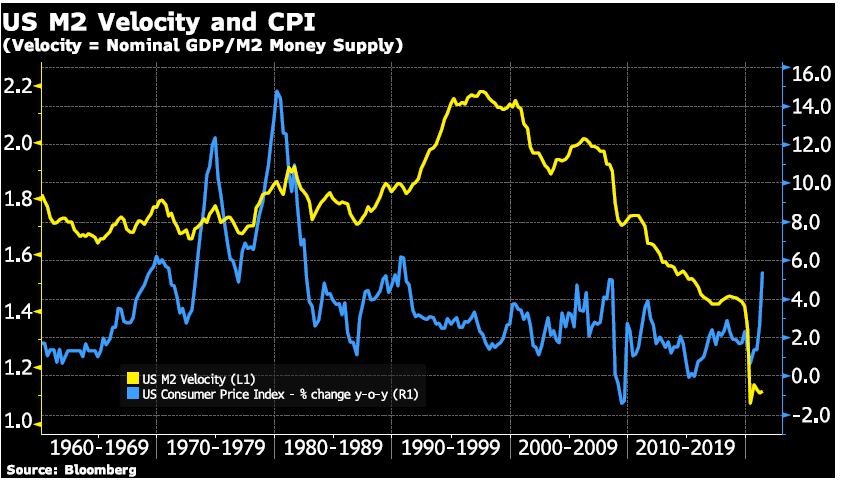 US M2 Velocity and CPI Chart
GOLD PRICES (USD, GBP & EUR – AM/ PM LBMA Fix)
27-10-2021 1783.85 1795.25 1299.89 1306.22 1539.64 1545.53
26-10-2021 1801.90 1785.55 1306.20 1294.17 1551.80 1538.61
25-10-2021 1799.20 1805.25 1308.38 1312.60 1547.13 1555.04
22-10-2021 1792.30 1808.25 1298.16 1311.52 1540.48 1552.74
21-10-2021 1785.30 1779.30 1294.16 1288.39 1533.57 1528.42
20-10-2021 1778.15 1778.00 1291.29 1289.76 1529.74 1526.77
19-10-2021 1779.40 1779.55 1289.89 1288.22 1526.90 1526.68
18-10-2021 1762.45 1767.85 1283.94 1287.35 1522.05 1523.71
15-10-2021 1781.45 1772.65 1297.96 1288.54 1535.43 1528.56
14-10-2021 1797.15 1798.70 1309.76 1312.51 1546.81 1551.20
Buy gold coins and bars and store them in the safest vaults in Switzerland, London or Singapore with GoldCore.
Learn why Switzerland remains a safe-haven jurisdiction for owning precious metals. Access Our Most Popular Guide, the Essential Guide to Storing Gold in Switzerland here
About the author

Chief Executive Officer
I am the CEO of GoldCore. We help investors buy and store gold and silver easily and cost effectively. We offer a service to purchase, sell and/or store precious metals personally or through a pension, a company or a family office.