
The US Federal Reserve continues to grapple with inflation, which at 7.7% (October CPI) is more than triple the Fed’s 2% target, without causing a recession by lifting interest rates too high.
The Fed has two options when it comes to interest rate increases designed to tackle the highest US inflation since the early 1980s. The first is it continues to hike rates, beyond what the economy can handle, causing a recession, usually defined as two consecutive quarters of negative economic growth. This is the “Volcker Fed” playbook.
In 1979, then US Federal Reserve Chair Paul Volcker faced a serious challenge: how to quell inflation which had been wracking the economy for most of the decade. The prices of goods and services had averaged 3.2% annually since World War II, but after the 1973 oil shock, they more than doubled, to an annual 7.7%. Inflation reached 9.1% in 1975, the highest since 1947. Although prices declined the following year, by 1979 inflation had reached a startling 11.3% (led by the 1979 energy crisis) and in 1980 it soared to 13.5%.
Not only was inflation going through the roof, but economic growth had stalled and unemployment was high, rising from 5.1% in January 1974 to 9% in May 1975. In this low-growth, hyperinflationary environment we had “stagflation”.
A stagflationary debt crisis looms
Volcker is widely credited with curbing inflation, but in doing so, he is also criticized for causing the 1980-82 recession. The way he did it was the same as the current US Federal Reserve is fighting inflation: raising the Federal Funds Rate. From an average 11.2% in 1979, Volcker and his board of governors through a series of rate hikes increased the FFR to 20% in June 1981. This led to a rise in the prime rate to 21.5%, which was the tipping point for the recession to follow.
Forty years later, the Federal Reserve faces a familiar foe. And like Paul Volcker’s Fed, interest rate hikes are seen as the solution to bringing inflation back in line, through demand destruction. Raising the cost of borrowing for businesses and individuals, in a world that runs on credit, is considered the best way to kill demand.
In the second option, the Fed hits “pause” on interest rate hikes, when they are perceived to be doing too much damage to the economy. Under this scenario, the central bank could even reverse course, like it did in 2018, and return to lowering interest rates and its monthly purchases of bonds and mortgage-backed securities, the policy known as “quantitative easing”, or QE. But this would take awhile and many at the Fed believe that QE, aka “money printing”, is inflationary. (To understand why six years of QE didn’t lead to hyperinflation, read this article on Investopedia). And for why much of inflation is supply-driven, read AOTH’s Will the Fed raising interest rates cause a recession? )
The Fed for a long time has preached the gospel of rate hikes and it wouldn’t want to lose face by declaring them a failure; the more likely scenario, therefore, is a series of smaller increases followed by a pause.
In fact Fed officials have been telegraphing a 0.25% reduction in interest rate increases when the Federal Open Market Committee meets next, on Dec. 14-15.
For the past four FOMC meetings, they have hiked rates 75 basis points each, bringing the benchmark Federal Funds Rate to the current 3.75-4% range. But messages coming from top Fed officials indicate a change of direction is in the works. Markets are pricing in a 50-bp move.
Fed Governor Christopher Walker reportedly said that recent inflation data makes him more comfortable with 50 basis points, and his comments were echoed by Cleveland Fed President Loretta Mester, who said the Fed can likely “slow down” from its current pace of rate increases, at the central bank’s December meeting.
Fed officials agreed that smaller rate increases should happen soon, as they evaluate the impact the policy is having on the economy, according to the November FOMC meeting minutes.
The minutes said “A substantial majority of participants judged that a slowing in the pace of increase would likely soon be appropriate,” and they noted that a few members indicated that “slowing the pace of increase could reduce the risk of instability in the financial system.”
According to Bloomberg, Fed Chair Jerome Powell suggested in his press conference after the November gathering that the central bank would probably step down to smaller rate hikes as soon as December.
New York Fed President John Williams, meanwhile, said Monday that he reckons a rate cut in 2024 is possible.
“I do see a point probably in 2024 that we’ll start bringing down nominal interest rates because inflation is coming down,” Williams said at a virtual event held by the Economic Club of New York. He also did not push back on the idea that the Fed could move at a slower pace [in December]. (Reuters, Nov. 28, 2022)
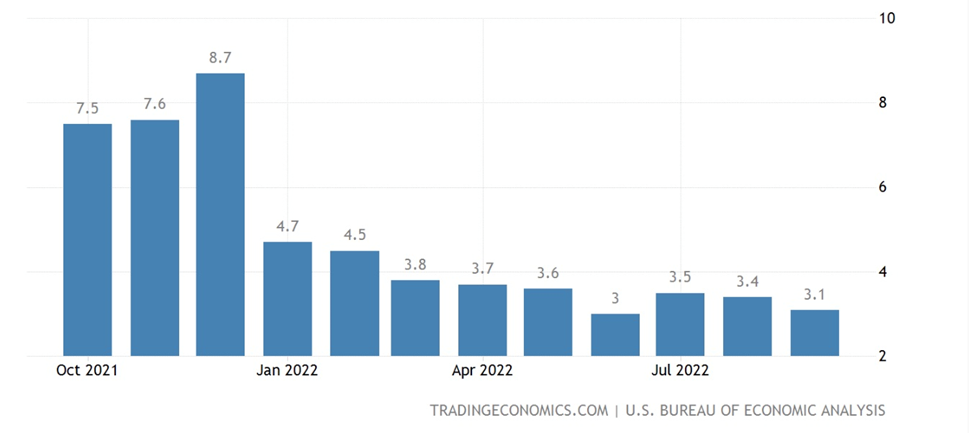
Take a look at the graph below. It shows US inflation peaking in June at 9.1%, then dropping every month since. Is this not proof that interest rate hikes work in bringing down inflation?
Well it would be, if we could trust the official inflation readings upon which the Fed is basing its policy decisions. Unfortunately, we can’t, and the Fed is seriously under-estimating how much prices are rising, and will continue to rise, especially for the all-important US consumer, whose spending comprising a whopping 70% of the country’s GDP.
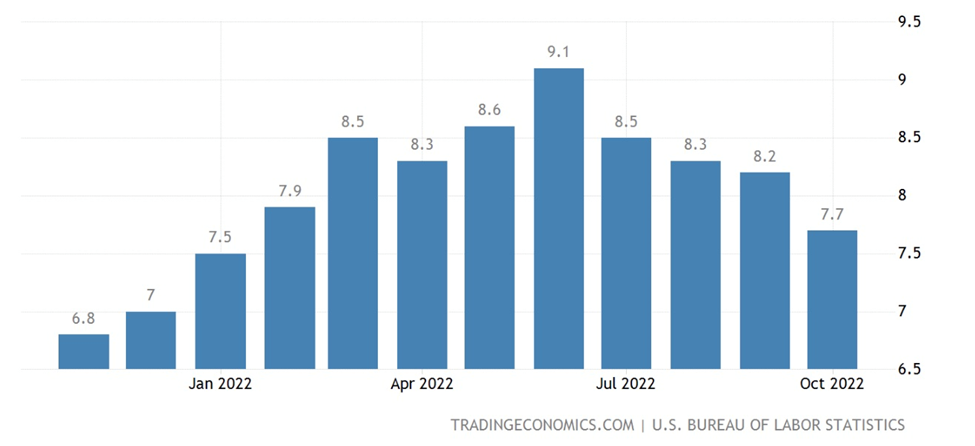 US inflation. Source: Trading Economics
Allow me to explain.
The inflation rate, defined
The first thing to understand is that the Fed’s concept of inflation is different from both the official statistic and the reality in the economy.
The Consumer Price Index (CPI) is currently 7.7%. This is the number most quoted in the financial press; it is the official inflation rate.
But the Fed when it talks about inflation, has since 2012 referred to the “Personal Consumption Expenditures” (PCE) price index. The Fed’s preferred inflation index is “core PCE”, which excludes food and energy prices, supposedly because they’re too volatile. But the fact that the two most essential price categories are left out, means the Fed is downplaying inflation.
The Consumer Price Index was up 7.7% in October, year on year, the lowest reading since January. But the PCE only showed a 6.2% increase in September, the same as August.
This can get confusing. Which inflation index best captures the amount that prices are truly rising?
Conceptually, they measure different things. The CPI aims to capture out-of-pocket spending by Americans, therefore it places a high weighting on rent and cars, for example. The index is based on about 94,000 price quotes collected monthly from some 23,000 retail and service establishments, as well as 43,000 rental housing units. Of the two CPI indices released monthly by the Bureau of Labor Statistics (BLS), the most important is the Consumer Price Index for All Urban Consumers (CPI-U) representing 93% of the US population.
In contrast the PCE tries to measure the cost of everything, whether households pay for them directly or not. The result is significant differences in which costs are included, and their weightings.
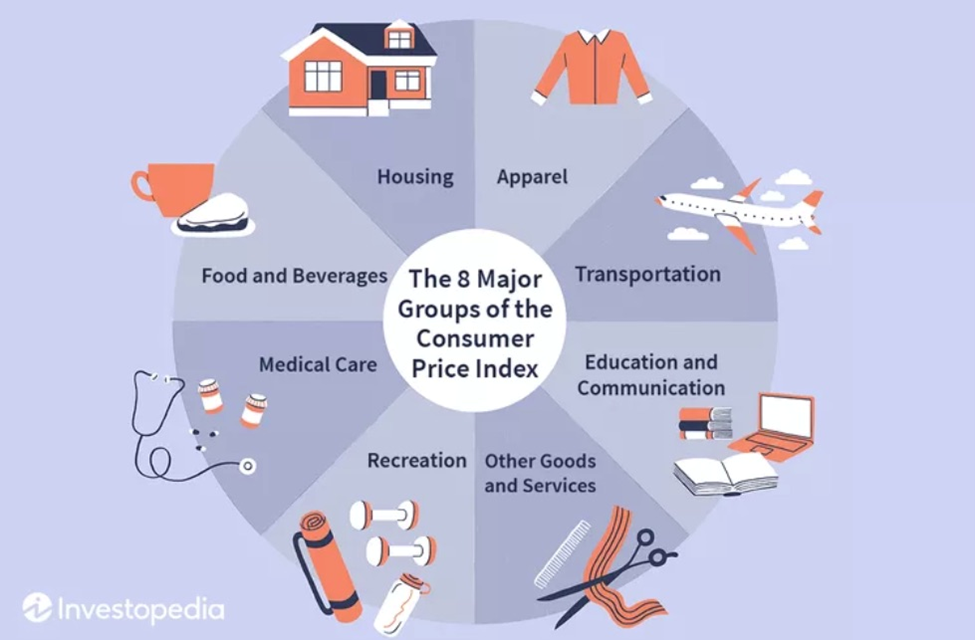 Source: Investopedia/ Maddy Price
Complicating matters further, economists often cite the “core CPI” and the “core PCE”, which means they’re excluding food and energy/ fuel for both.
Core CPI decelerated in October to 6.3% from a year earlier, and the core PCE dropped to 5%.
By comparing these two indices, economists can draw inferences on how fast prices are moving. The wider apart they are, the more certain prices within one index are accelerating, pulling the entire index higher, compared to the other index. (the same rule would apply if prices were decelerating)
In a recent Bloomberg article, it was pointed out that annual inflation, as measured by the CPI, has exceeded that of the PCE, by the most since the early 1980s. Core inflation is also the widest in decades.
However, the unusually wide gap is poised to narrow in the months ahead, giving Federal Reserve officials “more cover” to pause interest-rate increases in early 2023, authors Reade Pickert and Matthew Boesler contend.
How to explain this phenomenon? Well, according to Pickert and Boesler, some of the measurement quirks that have put more distance between the two metrics are set to fade in the coming months, while others are set to kick in and contribute to a narrowing…
The best example is health care costs. Bloomberg states:
Unlike the CPI, the PCE includes all health care spending, including by employers on behalf of workers as well as taxpayer-funded programs like Medicare.
As a result, health care makes up nearly a fifth of the core PCE gauge but only around 11% of the core CPI, said Omair Sharif, founder of Inflation Insights LLC…
As of the latest CPI report, the health insurance index has already started pulling down core inflation…
The other big reason why core CPI is seen decelerating much quicker than core PCE in 2023 is because more generally, the categories that will help drag down the CPI have smaller weightings in the PCE.
Take housing for instance. The so-called shelter category makes up about a third of the overall CPI and about 40% of the core measure. That makes sense given housing tends to be households’ single-biggest monthly expense.
The run-up in rental prices has filtered into the official government measures with a lag. Similarly, the rapid deterioration in the housing market seen over 2022 will also take time to be reflected in the figures. But when they do, the impact on the CPI will be swift.
The effect on PCE, despite similar measurement, will be much smaller, given the housing components have roughly half the significance they do in the CPI.
Targeting the wrong inflation
We already know that the Fed’s go-to inflation gauge, core PCE, under-weights rent and over-weights health care. It also strips out two of the most vital categories of household spending, food and energy/ gasoline.
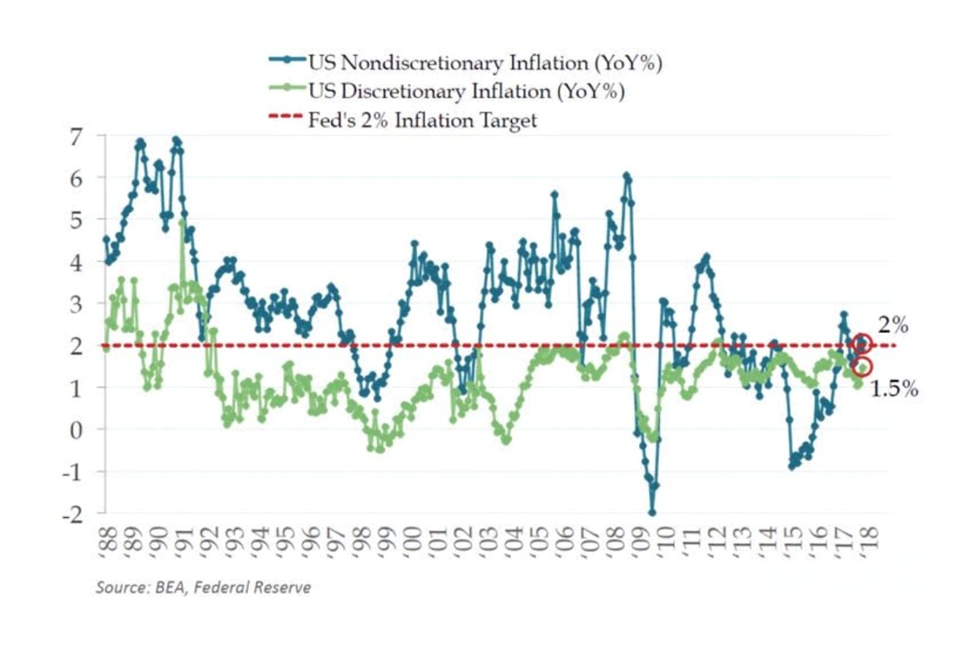
The fact that the central bank’s preferred measure of inflation creates a discernible gap between the rate of price increases for necessities, and the one for discretionary purchases, puts the Federal Reserve’s tightening path at risk of veering off course, maintains Danielle DiMartino Booth, a former adviser to the president of the Dallas Fed.
In a second Bloomberg piece, Booth shows that the prices of necessities within what she calls the “Household Budget Inflation Gauge” (US NonDiscretionary Inflation on the graph below), are rising more than her “Household Wish List Inflation Gauge” (US Discretionary Inflation), at a respective 2% versus 1.5% inflation.
(Note: this article was written during the Fed’s tightening cycle in 2018, but the principle arguably holds for the current cycle as well.)
Necessities include things like food and non-alcoholic beverages, fuels, clothing, housing, utilities, health care, health insurance, homeowners’ insurance, auto insurance, and phone, utility and internet bills.
According to Moody’s Analytics’ analysis of October 2022 inflation data, via CNBC, the average American household is spending $433 more a month to buy the same goods and services it did a year ago.
Among the most dramatic price increases, food at work and school rose 95.2%, eggs were up 45%, butter and margarine climbed 33.2%, and public transportation was 28.1% more expensive. These are all “non-discretionary” expenditure items.
Discretionary inflation within CNBC’s table, built with data from the Bureau of Labor Statistics’ CPI, published Nov. 10, seems less pervasive. In fact the prices of beef and veal were actually down 3.6% in October, television prices declined 16.5%, admissions to sporting events were 17.7% less expensive, and smart phone prices dropped 22.9%.
But energy prices in October rose 17.6%, food at home was 12.2% more expensive, all items less food and energy (core CPI) rose 6.3% and the price of shelter (rent) climbed 6.9%.
Why it won’t stop
The pervasiveness of price pressures is problematic, and it will likely take two or more months of decreases for the Fed to consider pivoting from hawkish to dovish, meaning pausing, then lowering interest rates and returning to its program of sovereign bond buying known as quantitative easing, or QE.
While October’s core CPI was down 0.3% compared to 6.6% in September, the so-called necessities of life — shelter, food and energy — continue to climb. Year over year, shelter prices are up 6.9%, food prices gained 10.9%, gasoline prices rose 17.6%, and staples such as eggs (+43%), bread (+14.8%) and milk (+14%) remain elevated, according to the Bureau of Labor Statistics.
“Any meaningful relief for household budgets is still somewhere over the horizon,” Greg McBride, chief financial analyst at Bankrate, was quoted by CNN.
Surely for the broader CPI to fall substantially, food and energy costs must decline, but when I look at the energy crisis in Europe, UK food prices exceeding 10%, and OPEC’s 2 million barrels a day production cut keeping oil prices strong, I have my doubts whether this will happen anytime soon.
In our May 12, 2022 article, we identified five reasons why food will continue to get more expensive, and has: Soaring Fertilizer Prices; Lower Crop Yields; Rising Energy Prices; War in Ukraine; Monetary Policies & Stimulus Spending.
5 reasons why food will get more expensive
In Europe, historically high natural gas prices due to Russia’s severe NG export cutbacks, have forced shutdowns at energy-intensive businesses including steel and chemicals. Governments are reportedly issuing more debt to shield households and businesses from pain, and there are projections the energy crisis will spiral into a recession.
Diesel is getting increasingly expensive for the simple reason that it is critically important; diesel power is the driving force behind the world’s biggest economy, America, without which it would not be able to survive. Approximately 90% of the nation’s freight tonnage is moved by diesel-powered trucks, trains, ships and intermodal systems.
Diesel prices have increased 33% for November deliveries and are expected to go higher. According to CNBC,
A perfect storm is taking place in the diesel market, with dwindling diesel reserves, a drought on the Mississippi River pushing more product to rail and truck, and a possible rail strike leading to a surge in prices that is expected to continue.
The chart below shows US diesel prices hit a six-year high on June 27, 2022, of USD$5.78/gallon. Pre-pandemic, diesel traded in a range of between $2,90 and $3.38 (Jan. 2018 – March 2020).
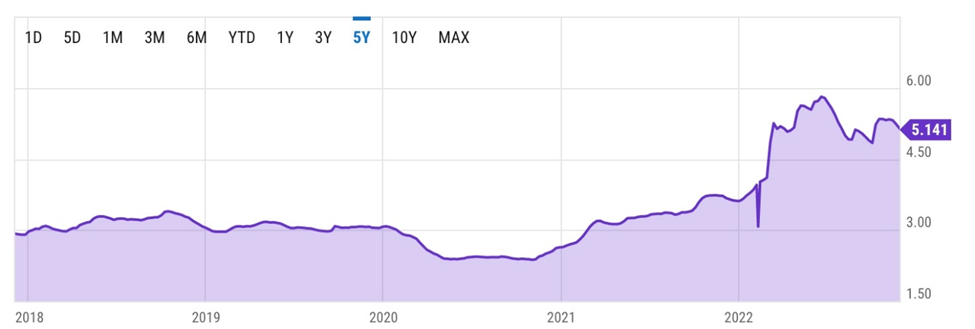 US retail diesel price for the week of Nov. 28, 2022. Source: YCharts
Top reasons why diesel fuel will get much more expensive
Black Friday bounce
If inflation is so bad, why did US shoppers flock to Black Friday sales? If prices are rising so fast, and within so many categories of the PCI, wouldn’t it make sense for consumers to hunker down and save instead of spend, especially with most economists and TV talking heads predicting a recession in 2023?
Arguably, the record sales figures set this past Friday, Nov. 25 and Cyber Monday, Nov. 28, were “one-offs” — i.e., aberrations that occurred due to a confluence of events that likely won’t be repeated.
On Monday CNN reported that online Black Friday sales topped a record-breaking $9.12 billion, up 2.3% compared to last year. The data was compiled by Adobe Analytics, which also found that US shoppers spent a record $5.29B on Thanksgiving Day, 2.9% more than a year ago.
Among the biggest Black Friday sellers, were electronics, smart home equipment, toys and exercise equipment.
Part of the reason inflated prices didn’t discourage buying, was because a lot of Americans purchased them on credit, a retail and e-commerce analyst told CNN. ‘Buy Now, Pay Later’ services are “a sort of newer form of debt that Americans are really embracing,” said Claire Tassin of Morning Consult. BNPL plans were about 80% higher compared to the previous week, Adobe said.
Online sales continued to impress on Cyber Monday. According to Reuters, again using data from Adobe Analytics, items bought online
reached $11.3 billion, 5.8% more than a year ago, making it the biggest US online shopping day in history:
Toys were the hottest products on Cyber Monday, with online sales going up nearly eight-fold compared to an average day in October 2022, according to the Adobe Analytics report.
Electronics sales rose nearly five-fold, while sporting goods, appliances and books also saw increases of well over 400%.
Caution, however, is urged in reading too much into these figures.
Retail therapy with the click of a mouse or the press of a fingertip may be way up over last year’s Black Friday/ Cyber Monday, which was still in the throes of covid, but online shopping only encompasses about 15% of all retail sales.
“So it is not necessarily a great indicator of the health of the economy overall,” said Dan North, senior economist at global trade credit insurer Allianz Trade North America, in the Reuters piece.
I suspect that, among the factors motivating so many people to buy over the two-day US retail “holiday”, were consumers still flush with savings from so-called “stimmy” (stimulus) checks; “revenge spending” on account of this being the first restriction-free holiday season since covid; and as mentioned, a lot of the purchases were on credit.
A new study quoted by Global News found Canadians are leaning more heavily on credit cards, and despite rising interest charges. Equifax Canada’s survey found the average credit card held by Canadians at the end of September was at a record-high $2,121.
US credit card debt just hit an all-time high of $930 billion.
The evisceration of the middle class
Also contributing to record sales on Black Friday and Cyber Monday, was the high US dollar. For Canadians crossing the line to buy goods in the US, this is a major disincentive, and we saw it reflected in short border lineups and thin crowds (anecdotal reports of next to no wait at the Peace Arch crossing near Vancouver). But for Americans with dollars to spend, it means cheaper imports. Many of those Black Friday deals were on goods made in China or other low-cost jurisdictions.
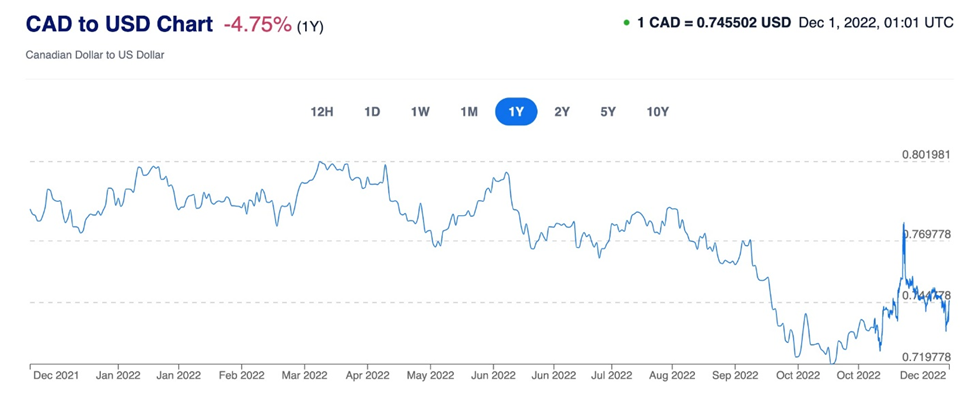 Source: xe.com
Excess inventory is the last factor. Retailers had a lot of inventory built up over two years of covid and they needed to push it out the door with deep discounts. A lot of retailers cut their margins in hopes of maximizing sales and revenue.
The Fed pause
That brings us to the final point of this article: What does the Fed do with this information, of a two-day spree of consumer spending? Will they smartly view it as a one-off, unlikely to be maintained for the rest of the holiday season? How will it affect the Fed’s interest-rate policy going forward?
Expectations are for the Fed to increase interest rates again at their December meeting, but by a smaller amount. Markets are pricing in a 50-basis-point increase, compared to the last four 75-bp hikes.
The Fed of course will be guided by November’s inflation numbers which are due out before the next FOMC meeting, on Dec. 14.
We know that the two inflation gauges, the CPI and the PCE, have been diverging of late, but the gap is set to narrow, resulting in the Fed likely pausing interest rate hikes in early 2023.
In fact the Fed may be forced into unwinding its tight monetary policy, becoming more dovish in the new year, as the central bank is confronted by evidence of a collapse in consumer spending and a downward spiraling US economy.
It happened in 2018, when a number of consecutive interest rate hikes crashed the stock market and the Fed had to lower rates to placate investors.
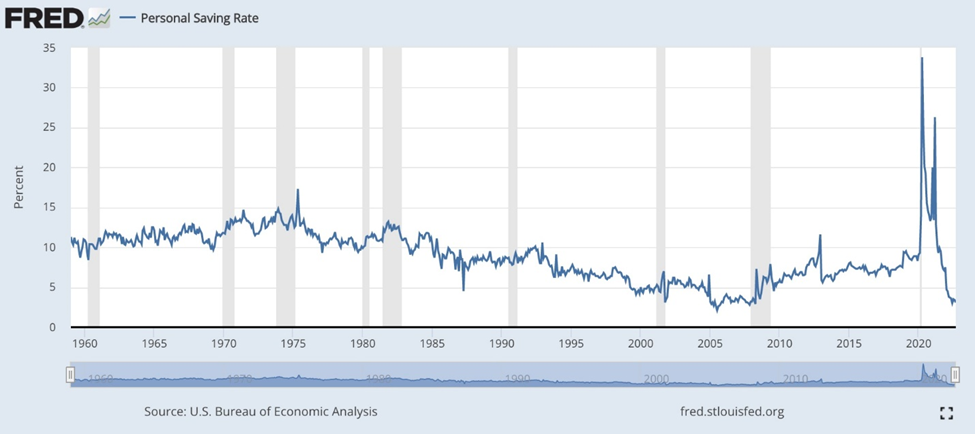
History suggests it is highly unlikely that households will continue to spend as they have recently. When the US savings rate dips below 3%, reduced spending is usually not too far behind. The graph below shows spending was as high as 8.7% in December, 2021, corresponding with the dissemination of covid stimulus checks. It has since fallen to 3.1% in September. In other words, we are on the verge of a consumer spending crash.
 US personal savings rate. Source: Trading Economics
Taking a longer-term view, we see the historical high prior to the pandemic was 17.3% in September, 1975, and an all-time high of 33.8% during covid lockdowns in April, 2020.
If Jay Powell and his Fed board of governors are looking for a sign of demand destruction wrought by higher interest rates, they will find it in dissipating consumer confidence, and expectations of higher inflation.
The Conference Board recently said Americans’ confidence dipped in November and inflation expectations jumped. Headline consumer confidence worsened for the second month in a row, from 102.5 to 100.2, the weakest since July. Sentiment towards the Present Situation, the green line shown on the linked Bloomberg graph, was 137.4, the lowest since April, 2021.
Inflation expectations rose to 7.2%, a second monthly increase.
Further reading:
The Consumer Economy Has Completely Collapsed — It’s a “Ghost Town” for Holiday Shopping Everywhere
It’s almost Kafkaesque to see how the media are continuing to maintain economic pretenses, yet the reality of a completely collapsed consumer economy is physically staring them in the face.
Black Friday crowds smaller in Canada as deals last longer, inflation reins in spending
Weak consumer confidence and rising inflation expectations fall into line with the recession that is coming, if the Fed continues on its tightening path.
Another mark of a deteriorating economy is the monthly Purchasing Managers’ Index (PMI). On Wednesday, Nov. 30, Zero Hedge’s Tyler Durden made the following observations:
In a massive downside surprise, the Chicago PMI survey just printed 37.2 (vs 47.0 expectations), plunging to its lowest level since the peak of the COVID lockdowns in 2020. This was below the lowest estimate of 25 economists surveyed.
In 55 years, this level of Chicago PMI has never not failed to coincide with a recession.
Speaking of recessionary signals, the yield curve on the US 2-year versus 10-year Treasuries, has been inverted (below 0%) since July, and keeps falling, as the FRED graph below shows. The spread is now -0.77.
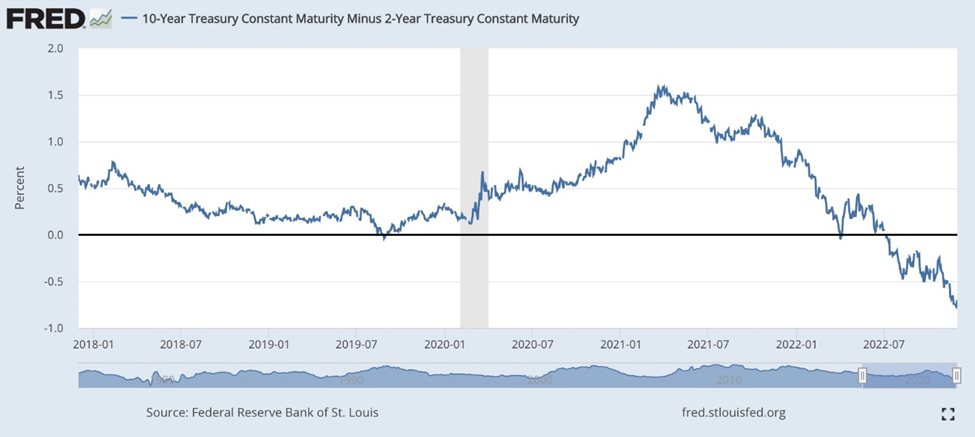
The yield curve has inverted 28 times since 1900, and in 22 of those times, a recession followed. For the last six recessions, a recession began six to 36 months after the curve inverted.
If there is a recession, it’s unlikely to be a blip, like the covid-related downturn we just experienced. In an interview with The Financial Times, via Real Investment Advice, Boaz Weinstein, found of Saba Capital Management, suggested after 12 years of a liquidity-fueled [QE]-induced bull market, we are about to start a secular bear market:
“There isn’t a rainbow at the end of all this. There’s no reason that this difficult economic period will only last two to three quarters and no reason to think we’ll have a soft landing or a shallow recession.”
Understanding why, requires some careful reading of the linked article, but suffice to say that bear markets are driven by “valuation contraction”. Stock market valuations contract when investors re-evaluate companies’ earnings power. This is determined by changes in interest rates, inflation, and most importantly, economic growth.
Current prospects for more robust economic growth are challenged by high debt levels, something we at AOTH wrote about recently.
Real Investment Advice says investors shouldn’t be afraid, but they should “Be Aware of the Bear”. Again, it comes back to the consumer. Consumer spending makes up 70% of the economy, but The consumer is more heavily leveraged than ever, making it doubtful they can become a significantly larger chunk of the economy. With savings low, income growth lagging inflation, and debt back at record levels, the fundamental capacity to re-leverage to similar extremes is no longer available…
One thing is sure. Until Central Banks revert to all-out monetary accommodation, investors will face a challenging investment environment as valuation contraction continues to drive future returns.
Conclusion
By now it should be apparent that we can’t keep going like we have been, with the Fed continuing to raise interest rates as the economy stumbles towards recession. The signs of a faltering economy are everywhere, as we have described — continued high inflation, especially food and energy, that is not reflected in the Fed’s preferred inflation index, the core PCE; rising inflation expectations; dissipating consumer confidence; an imminent collapse in consumer spending, notwithstanding the “Black Friday” bounce; a plunging PMI and an inverted yield curve, both reliable recession indicators.
Regarding what the Fed does or doesn’t do, the problem is the central bank is using the wrong numbers. If the Fed is under-estimating inflation, as we believe it is, then everything it does to control inflation will likely be wrong as well. This includes raising interest rates.
The Fed can only push interest rates so high, without blowing up the Treasury and being forced into an aggressive bond-buying program (QE), thus accelerating inflation. The irony is that in trying to bring down inflation through interest rate hikes, the Fed, because of the high debt levels, will fail, and will be forced into a loose monetary policy involving interest rate cuts and QE.
Between de-dollarization and investors fleeing Treasuries, it appears likely that the US Federal Reserve will eventually have to take over buying the debt, issued to finance the federal government’s expenditures.
With over $31T of debt, the US government budget is at great risk of running unsupportable deficits if interest rates continue to increase.
The Fed, the debt, China and gold
For all of these reasons, we are therefore convinced that the Fed is going to pause interest rate hikes soon, likely in early 2023. The 0.5% increase in December is “baked in the cake”, but after that, we see no other alternative, if the Fed wants to avoid recession.
Richard (Rick) Mills
aheadoftheherd.com
Legal Notice / Disclaimer
Ahead of the Herd newsletter, aheadoftheherd.com, hereafter known as AOTH.
Please read the entire Disclaimer carefully before you use this website or read the newsletter. If you do not agree to all the AOTH/Richard Mills Disclaimer, do not access/read this website/newsletter/article, or any of its pages. By reading/using this AOTH/Richard Mills website/newsletter/article, and whether you actually read this Disclaimer, you are deemed to have accepted it.
Any AOTH/Richard Mills document is not, and should not be, construed as an offer to sell or the solicitation of an offer to purchase or subscribe for any investment.
AOTH/Richard Mills has based this document on information obtained from sources he believes to be reliable, but which has not been independently verified.
AOTH/Richard Mills makes no guarantee, representation or warranty and accepts no responsibility or liability as to its accuracy or completeness.
Expressions of opinion are those of AOTH/Richard Mills only and are subject to change without notice.
AOTH/Richard Mills assumes no warranty, liability or guarantee for the current relevance, correctness or completeness of any information provided within this Report and will not be held liable for the consequence of reliance upon any opinion or statement contained herein or any omission.
Furthermore, AOTH/Richard Mills assumes no liability for any direct or indirect loss or damage for lost profit, which you may incur as a result of the use and existence of the information provided within this AOTH/Richard Mills Report.
You agree that by reading AOTH/Richard Mills articles, you are acting at your OWN RISK. In no event should AOTH/Richard Mills liable for any direct or indirect trading losses caused by any information contained in AOTH/Richard Mills articles. Information in AOTH/Richard Mills articles is not an offer to sell or a solicitation of an offer to buy any security. AOTH/Richard Mills is not suggesting the transacting of any financial instruments.
Our publications are not a recommendation to buy or sell a security – no information posted on this site is to be considered investment advice or a recommendation to do anything involving finance or money aside from performing your own due diligence and consulting with your personal registered broker/financial advisor.
AOTH/Richard Mills recommends that before investing in any securities, you consult with a professional financial planner or advisor, and that you should conduct a complete and independent investigation before investing in any security after prudent consideration of all pertinent risks. Ahead of the Herd is not a registered broker, dealer, analyst, or advisor. We hold no investment licenses and may not sell, offer to sell, or offer to buy any security.
About the author

Richard (Rick) Mills

Legal Notice / Disclaimer
Ahead of the Herd newsletter, aheadoftheherd.com, hereafter known as AOTH.
Please read the entire Disclaimer carefully before you use this website or read the newsletter. If you do not agree to all the AOTH/Richard Mills Disclaimer, do not access/read this website/newsletter/article, or any of its pages. By reading/using this AOTH/Richard Mills website/newsletter/article, and whether or not you actually read this Disclaimer, you are deemed to have accepted it.
Any AOTH/Richard Mills document is not, and should not be, construed as an offer to sell or the solicitation of an offer to purchase or subscribe for any investment.