There was too bearish a view and bearish sentiment on gold, silver, and copper in the last two weeks. It was more of a war between the West, which sells paper bullion, and the East, which has been buying physical bullion. My reason to be short-term bullish is that the Federal Reserve will not raise interest rates in the near term. The month of June has seen falling energy prices and falling commodity prices. Inflation will be soft in June and July in the USA and worldwide.
Supply-side inflation fears will be there. Destruction of production facilities (in the second quarter in Iran) will take a lot of time to be normal. It is not about energy price alone. It is about metal prices, prices of consumer durables, and food price inflation. Consumer durable inflation will zoom globally after Apple product prices were raised in a big way. Copper demand-supply gap will narrow this year and move into deficit from next year. RAM price is expected to rise by thirty percent more this year, and yet there could be a supply squeeze.
Once the soccer World Cup gets over, some of the polymarket traders will enter precious metals and non-ferrous metals trade. Daily Trading Volumes in CME will see a significant rise.
July and August months will see a battle between bulls and bears unless there is a big one- way price rise. Intraday traders should stick to their tried and tested profitable techniques.
Singapore will establish an over-the-counter gold clearing system and introduce central bank gold-vaulting services. The Singapore Exchange will establish an over-the-counter gold clearing system for Loco Singapore, or physical gold stored in Singapore. Six banks – DBS, Deutsche Bank, ICBC Standard Bank, J.P. Morgan, OCBC and UOB will be clearing members. This is a two-week-old news. The relevance is that Singapore is buying physical gold aggressively for the exchange. If the gold price is not super bullish for the long term, then this exchange would not have been formed.
Gold price crash will see rallies and be super bullish unless the US ten-year bond yield breaks the five percent market and trades over five percent. US ten-year bond yield has to trade over 5.00 percent for six weeks and more for another big crash.
Historically, June to mid-September has been a bearish consolidation phase (except the COVID pandemic year). Most of the parabolic bull run in bullion prices was from the second half of September to mid-March. If you are an investor in gold and silver, then worry if and only if there is a bearish trend from 15th September (2026) to 15th March (2027).
I am just trying to counter the hyper bearish narrative in the social media forums. BOFA analysts say three-quarter-point interest rate hikes by the Federal Reserve. My view is that only a significant re-escalation in the Iran war and a prolonged re-escalation in the Iran War will cause a crash below $2800/$3500, the social media analysts forecast. “W-shaped long-term price moves” on the technical charts have been repeated by gold price and silver price, defying all the odds.
Is gold really in a technical death cross zone? When the fifty-day simple moving average trades below the two hundred-day simple moving average, we call it a death cross.
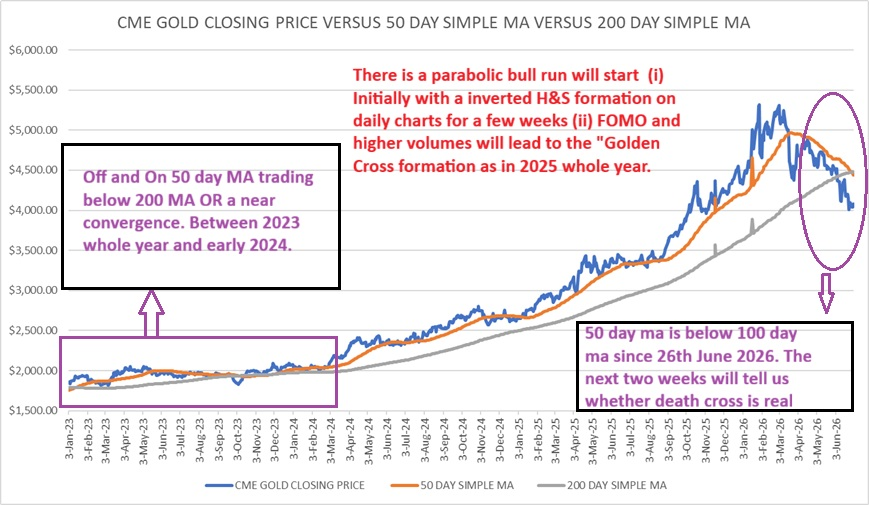

- Period: 1st January 2023 to 1st July 2026.
- Near-dated active CME gold futures versus 50-day simple MA (computed on closing price) and 200-day simple MA (computed on closing price).
- Death cross (50-day below 200-day MA) was there from 1st January 2023 to 12th January 2023.
- 14th January 2023 to 26th June 2023 – 50-day trade over 200-day MA with a wider gap.
- 24th June 2023 to 29th September 2023 – convergence between 50-day MA and 200-day MA eventually leading to a death cross on 11th December 2023.
- 12th December 2023 to 27th May 2026 – the death cross vanished – widening of price gap between 50-day and 200-day leading to a big golden cross.
- 27th May 2026 – narrowing started between the 50-day MA and 200-day MA, leading to a technical death cross on 29th June.
The above is the history of price difference between 50 day simple moving average, 200 day simple moving average computed on the basis of near dated CME gold future.
Three- and half-year historical chart indicates that if 50-day MA trades below 200-day MA for the next two weeks, then it can continue for two months to three months accompanied by a historical parabolic rise. This also coincides with the historical trend of a bullish run in gold price between 16th September and 16th March every year.
The sum of the above is (i) Intraday traders use strict trailing stop losses to trade for the rest of July. (ii) Investors to take advantage of the crash (if any) till mid-September to increase gold investment.
Spot Silver – Current Market Price $61.01
- 50 week MA: $63.95
- A double bottom was formed in June around $55.60 in spot silver. This is the lower base price for the continuation of the bullish trend for the rest of the year.
- VIEW TILL 10TH JULY: Spot silver has to trade over $59.53 to rise to $64.15, $72.90 and more.
- A crash or sell-off will be there if spot silver does not break $63.95 by 10th July to $57.05 and more.
- A daily close over $60.80 for four consecutive trading sessions (on or from 6th July) will put a full end to bearish trend chance in the short term.
- Views are intraday unless otherwise specified.
- Low-risk traders and low-risk takers trading in silver (spot, future and ETF) should preferably be intraday traders till the end of August. I expect a big gap open in Asia (Singapore open) every day till the end of August in spot silver.
- A systematic investment plan (SIP) or monthly SIP (physical or ETF, your choice) is the best way to invest in silver for the low-risk takers.
- Derivative trading in silver is not for the low-risk takers.
- Please assess your own risk profile if you intend to do derivative trade in silver or trade in silver futures in any commodity exchange of the world.
DISCLAIMER: The investment ideas provided is purely independent view point and are solely for collective learning and for academic interests. There is no commercial benefit accruing or have deemed to accrue to me out of providing such investment ideas.
The investment ideas shared here cannot be construed as investment advice or so. If any reader is acting on these advices, they are requested to apply their prudence and consult their financial advisor before acting on any of the recommendations made here. I am not responsible to anybody in the event of profits and losses (if any) upon acting on such advice.
I hope that our reader is aware about this well aware of the risk involved in trading in commodity derivative trading.
Disclosure: I trade in India's MCX commodity exchange. I have open positions in India's MCX commodity future. I do not trade in CME future or OTC spot gold and spot silver.
NOTES TO THE ABOVE REPORT
- ALL VIEWS ARE INTRADAY UNLESS OTHERWISE SPECIFIED
- Follow us on Twitter @chintankarnani
- PLEASE NOTE: HOLDS MEANS HOLDS ON DAILY CLOSING BASIS
- PLEASE USE APPROPRIATE STOP LOSSES ON INTRA DAY TRADES TO LIMIT LOSSES.
- THE TIME GIVEN IN THE REPORT IS THE TIME OF COMPLETION OF REPORT
- ALL PRICES/QUOTES IN THIS REPORT ARE IN US DOLLAR UNLESS OTHERWISE SPECIFED.
- ALL NEWS IS TAKEN FROM REUTERS NEWSWIRES.
- TECHNICAL ANALYSIS IS DONE FROM TRADINGVIEW SOFTWARE
About the author