
08 August 2020 -- Saturday
YESTERDAY in GOLD, SILVER, PLATINUM and PALLADIUM
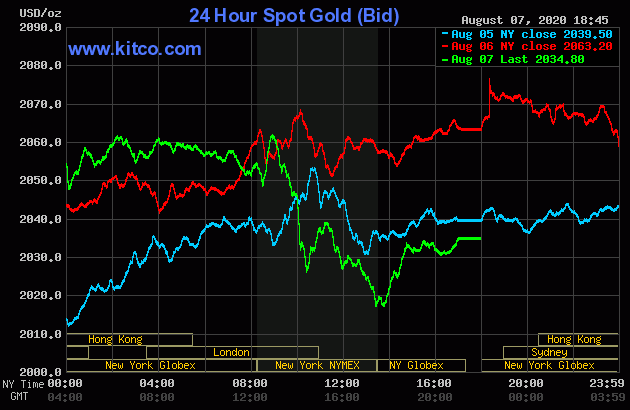
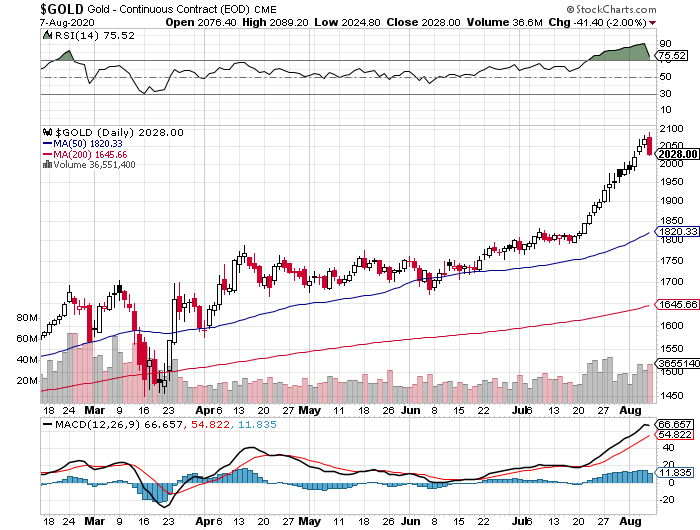
The gold price spiked higher shortly after trading commenced at 6:00 p.m. EDT in New York on Thursday evening -- and that was the high tick of the day. It was sold lower until shortly after 12 o'clock noon China Standard Time on their Friday afternoon -- and although it rallied from there, that ended at the 2:15 p.m. afternoon gold fix in Shanghai. It was quietly down hill from there until the job numbers hit the tape in New York -- and at that juncture, the price blasted higher. It ran into 'da boyz' about ten minutes later -- and as the dollar index 'rallied'...the engineered price decline in gold began, with the low tick of the day coming about five minutes before the COMEX close. Shortly after that it began to rally anew, but the price was capped and turned sideways at 2:45 p.m. in after-hours trading -- and it didn't do much after that.
The high and low ticks in gold were recorded by the CME Group as $2,089.20 and $2,024.80 in the December contract...$2,078.00 and $2,015.00 in October. The August/October price spread differential at the close yesterday was $7.90... October/December was $10.00 -- and December/February was $10.50.
Gold was closed in New York on Friday afternoon at $2,034.80 spot, down $28.40 from its close on Thursday. Net volume in October and December combined was an astronomical 407,000 contracts -- and there was about 18,000 contracts worth of roll-over/switch volume in this precious metal.
|
|
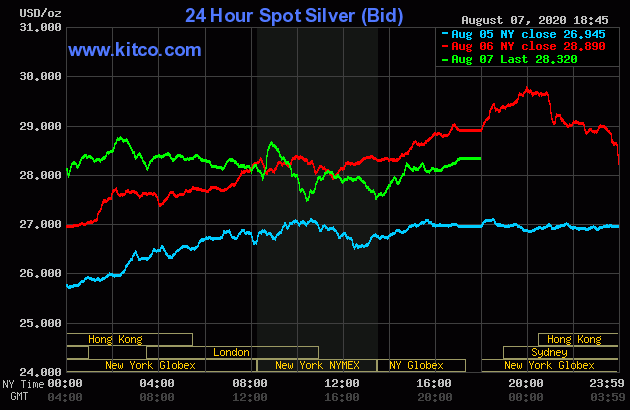
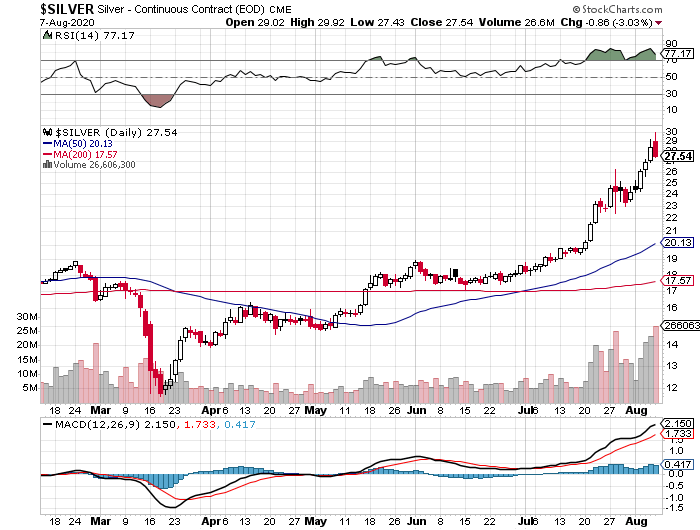
Silver soared out of the gate at 6:00 p.m. in New York on Thursday evening -- and was up $1.01 at its 8 a.m. China Standard Time high tick of the day. But by minutes after 12 o'clock noon CST, it was down 98 cents! After that, its price path was guided in a similar fashion as gold's, except for the fact that silver's low tick was set minutes before 10:30 a.m. in New York. Its secondary New York low came at the same time as gold's low...minutes before the COMEX close.
The high and low ticks in silver were reported as $29.915 and $27.430 in the September contract. The September/December price spread differential at the close on Friday was 25.7 cents -- and December/March was 24.5 cents.
The silver price was closed on Friday afternoon in New York at $28.32 spot, down 57 cents from Thursday. Net volume was another stunning new record at 239,500 contracts -- and there was about 49,500 contracts worth of roll-over/switch volume out of September and into future months...mostly December, plus a bit into March.
|
|
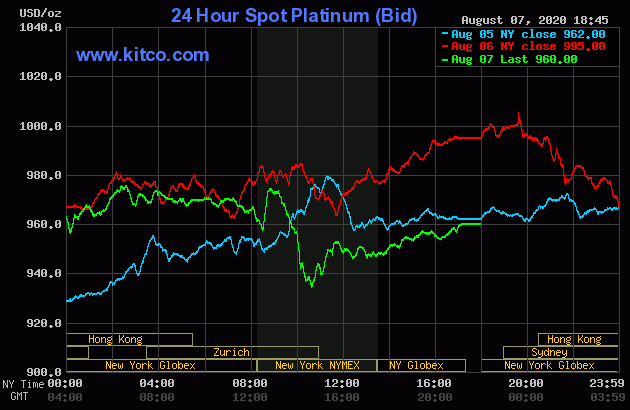
The platinum price crept a bit higher until around 7:40 a.m. China Standard Time in Far East trading -- and then JPMorgan et al. appeared in that precious metal -- and in all respects that mattered its price was engineered lower in a very similar fashion as silver and gold, with its low tick coming about twenty minutes before the 11 a.m. EDT Zurich close. It drifted a bit higher from there until trading ended at 5:00 p.m. in New York. Platinum was closed at $960 spot, down 35 dollars from Thursday, as 'da boyz' took back all of Thursday's gains, plus a few dollars more.
|
|
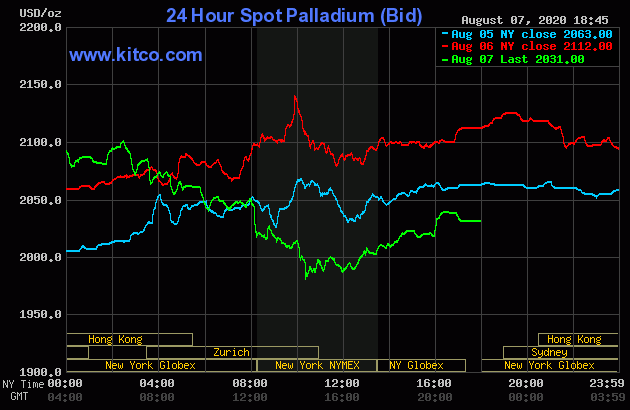
Palladium's high of the day came at the same time as platinum's -- and from there it was forced to wander quietly and unevenly lower, with the low tick of the day being printed around 10:20 a.m. in New York. It managed to rally a respectable amount from there until the market closed at 5:00 p.m. EDT. Palladium was closed at $2,031 spot, down 81 bucks from Thursday -- and miles off its Kitco recorded $1,981 spot low tick of the day.
Palladium traded 2,691 contracts in total on Friday -- and of that amount, there was 498 contracts worth of roll-over/switch volume out of September and into December.
|
|
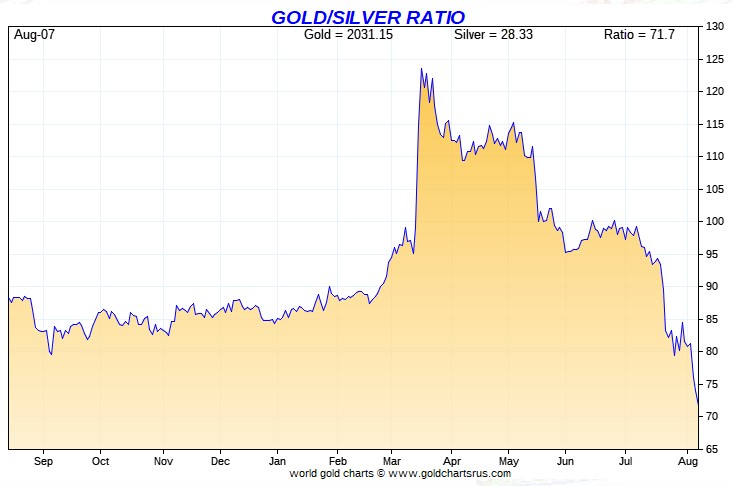
Based on the spot closing prices in silver and gold from Kitco posted above, the gold/silver ratio worked out to a bit under 72 to 1 -- and here's the 1-year gold/silver ratio chart from Nick. Click to enlarge.
|
|
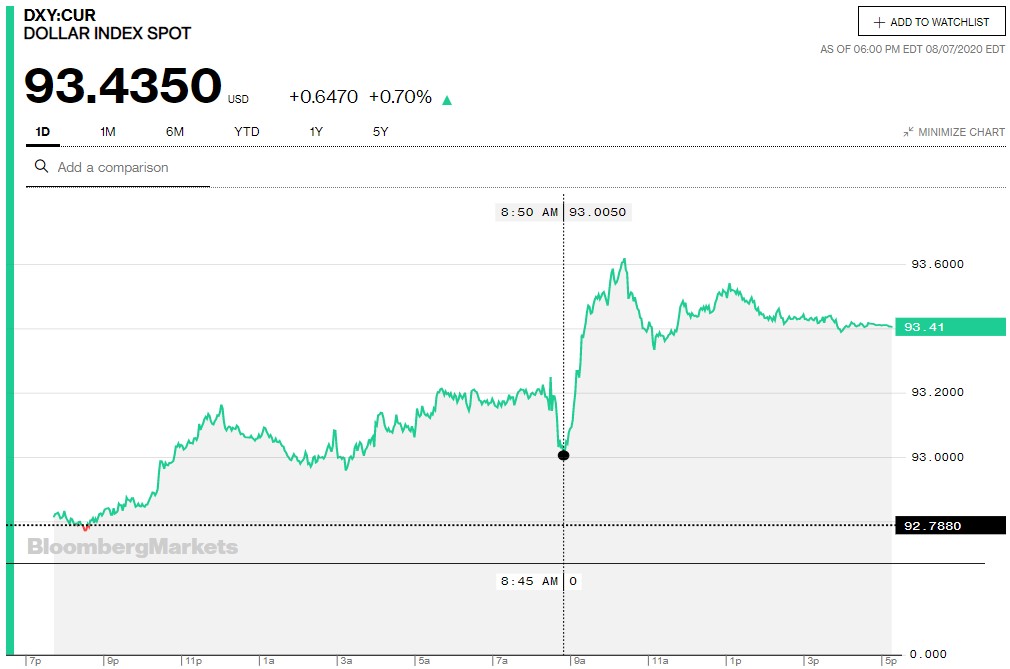
The dollar index closed very late on Thursday afternoon in New York at 92.788 -- and opened up three basis points and change once trading commenced around 7:45 p.m. EDT on Thursday evening. Its low tick, such as it was, was printed at 8:32 a.m. CST -- and it then headed higher until 12:02 p.m. CST. It was quietly down hill from there until 8:15 a.m. in London -- and it began to drift higher going into the 8:30 a.m. jobs report in New York. It fell a bunch on the news, but was obviously rescued by the usual 'gentle hands' at 8:50 a.m. EDT, almost the precise moment that the serious engineered price declines began in the COMEX futures market in gold, silver and platinum. That 'rally' topped out around 10:25 a.m. EDT -- and it was sold down a bit until 11:10 a.m. After a bit of a quiet up/down move, it traded quietly sideways until the market closed at 5:30 p.m. in New York.
The dollar index was closed on Friday afternoon in New York at 93.435...up 65 basis points from its close on Thursday.
Here's the DXY chart for Friday, courtesy of Bloomberg as always. Click to enlarge.
|
|
And here's the 5-year U.S. dollar index chart, with thanks to the good folks over at the stockcharts.com Internet site. For the third day in a row there was no delta between its close...93.43...and the close on the DXY chart above.
|
|
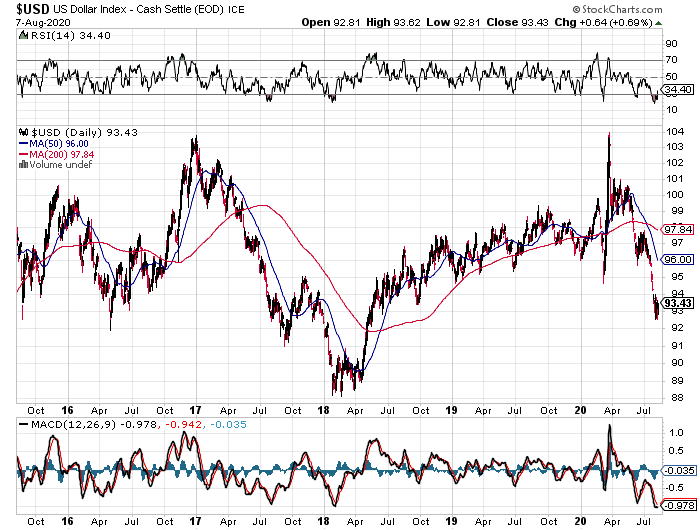
Compared to its prior lows, the U.S. dollar's fall from grace has barely started. The only thing that concerns me, as I've pointed out before on numerous occasions, is how long this engineered counter-trend dollar index 'rally' will continue, as it's monstrously oversold -- and there's a huge existing short position in it that 'da boyz' can use to their advantage if they wish to do so.
Time will tell.
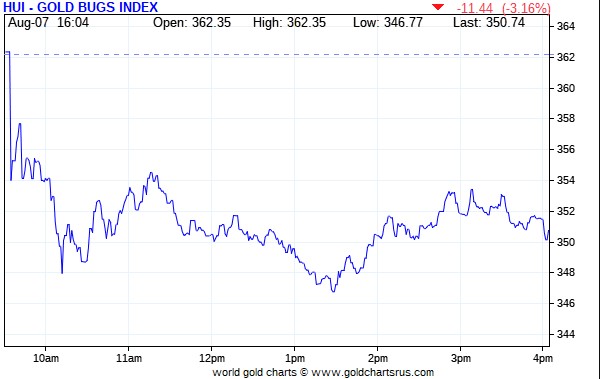
Not surprisingly, the gold shares got hit pretty hard at the open in New York on Friday morning -- and they were sold lower until around 10:10 a.m. EDT. But despite the fact that the gold price was getting hammered into the dirt at that point, the gold stock wandered quietly sideways for the remainder of the day. I was impressed, as there were lot of traders buying this price weakness...as Ted Butler said they/we should. The HUI closed down only 3.16 percent.
|
|
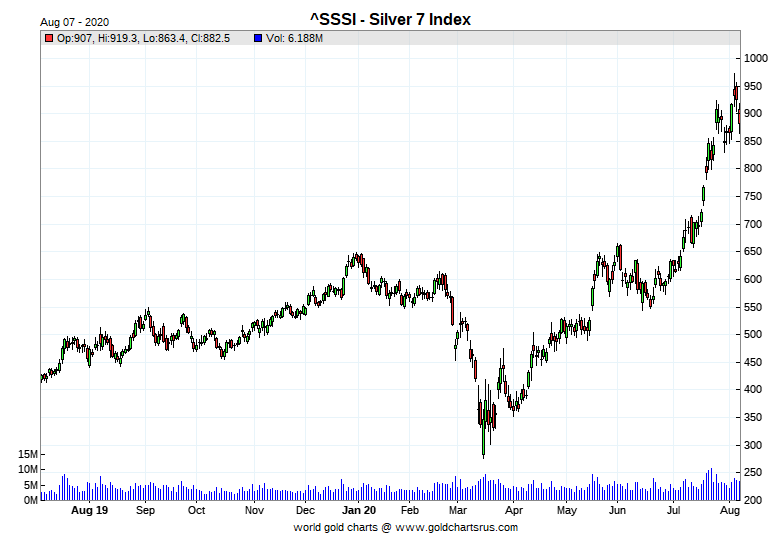
It's regrettable that Nick's Intraday Silver Sentiment/Silver 7 Index chart is no longer with us, but computed manually, it showed a rather chunky decline of 4.71 percent.
And here's the 1-year Silver Sentiment/Silver 7 Index chart, courtesy of Nick Laird, updated with Friday's doji. Click to enlarge.
|
|
They were all pretty much dogs yesterday -- and the two with the most fleas were Helca and SSR Mining, down 7.97 and 7.66 percent respectively.
And in the interest of full disclosure, I added Hecla Mining to my stock portfolio -- and as I stated earlier, this is most likely my last stock purchase, as I'm even more "all in" now than I was before. I have enough. I will carry this portfolio from now on -- and to whatever end, as I'm not a trader.
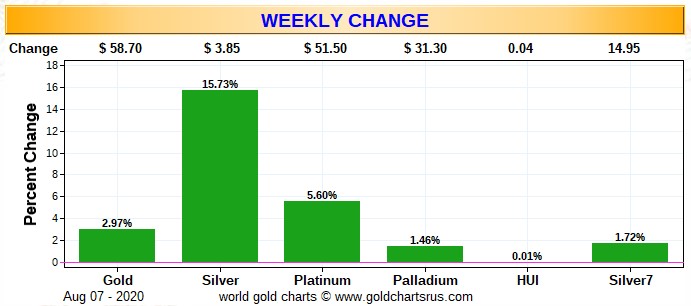
Here are two of the usual three charts that show up in every Saturday missive. The first one shows the changes in gold, silver, platinum and palladium for the past trading week, in both percent and dollar and cents terms, as of their Friday closes in New York - along with the changes in the HUI and the Silver 7 Index.
Here's the weekly chart -- and silver's outperformance vs. gold is the most immediate and striking feature on this graph. But equally striking is the dismal performance of the precious metal equities. It's brutal. That will change at some point, hopefully -- and the sooner the better. Click to enlarge.
|
|
I won't bother posting the month-to-date chart this week, as it's the same as the weekly chart for this one week only.
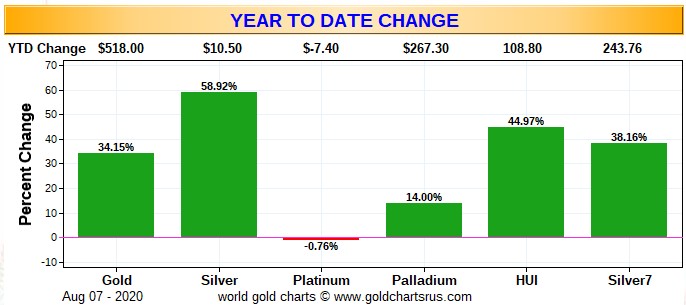
Here's the year-to-date chart -- and although the silver price is now outperforming the gold price by a substantial margin, the silver equities continue to lag. But the underperformance of the gold stocks compared to the underlying metal itself, is just as obvious here. And if you think this outperformance by silver vs. gold is glaring on both these charts, you ain't seen nothin' yet! Click to enlarge.
|
|
Although no one is happy about the underperformance of the precious metal equities, I'm hoping that the worst is now far behind us, now that we have this not-unexpected engineered price decline mostly out of the way.
As per the COT and Days to Cover discussion a bit further down, the Big 8 traders are still mega short gold and silver in the COMEX futures market -- and that situation hasn't changed one bit from last week. But enough gold has now been brought into the COMEX that they could cover by physical delivery if that becomes necessary -- and even though the deliveries have been huge so far in August, it hasn't change the short position of the Big 8 shorts in gold by any meaningful amount...nor in silver, either.
The CME Daily Delivery Report showed that 156 gold and 25 silver contracts were posted for delivery within the COMEX-approved depositories on Tuesday.
In gold, there were six short/issuers in total -- and the only one that mattered was JPMorgan, issuing 139 contracts out of their client account. There was another huge list of long/stoppers -- and the biggest was JPMorgan once again, with 48 contracts...17 for its house account, plus 31 for its client account. Goldman was next, picking up 26 contracts for its own account... followed by Morgan Stanley, with 23 contracts...20 for its in-house/proprietary trading account, plus 3 for clients. They were followed by Citigroup, stopping 20 contracts for its house account. The list goes on and on...
In silver, there were three short/issuers -- and the two largest were ADM and Morgan Stanley, issued 18 and 6 contracts -- and of the three long/stoppers the only one that mattered was JPMorgan, stopping 22 contracts. All contracts, both issued and stopped, involved their respective client accounts.
The link to yesterday's Issuers and Stoppers Report is here.
Month-to-date there have been 43,921 gold contracts issued/reissued and stopped -- and that number in silver is 1,131 contracts.
The CME Preliminary Report for the Friday trading session showed that gold open interest in August fell by 532 contracts, leaving 4,590 still open, minus the 156 contracts mentioned a few paragraphs ago. Thursday's Daily Delivery Report showed that 594 gold contracts were actually posted for delivery on Monday, so that means that 594-532=62 more gold contracts were added to the August delivery month. Silver o.i. in August actually rose by 19 contracts, leaving 174 still around, minus the 25 mentioned a few paragraphs ago. Thursday's Daily Delivery Report showed that 6 silver contracts were actually posted for delivery on Monday, so that means that 19+6=25 silver contracts just got added to August -- and I would suspect that those are the same 25 contracts that are mentioned in the Daily Delivery Report above -- and are out for delivery on Tuesday.
After Friday's engineered price declines in both gold and silver, total gold open interest showed a decline of 1,498 contracts -- and silver's total o.i. rose by only 960 contracts.
There were withdrawals from both GLD and SLV on Friday, as authorized participants removed 187,880 troy ounces from the former -- and 1,396,851 troy ounces from the latter.
And if any of the authorized participants had been shorting the shares of GLD and SLV in lieu of depositing real metal over the last week or so, they were certainly covering those positions during yesterday's engineered price declines...which they most likely instigated.
In other gold and silver ETFs and mutual funds on Planet Earth on Friday, net of any COMEX, GLD & SLV activity, there was a net 275,060 troy ounces of gold added, but a net 243,719 troy ounces of silver was withdrawn -- and that silver number is only negative because there was a huge 3,034,382 troy ounces withdrawn from SIVR. There's been a lot of big and equally counterintuitive in/out activity at this ETF for the last several weeks.
There was no sales report from the U.S. Mint again yesterday.
Month-to-date they've sold 28,500 troy ounces of gold eagles -- 6,500 troy ounces of those one-ounce 24K gold buffaloes -- and 918,000 silver eagles.
And still no Q2/20 report from the Royal Canadian Mint.
There was a bit of activity in gold over at the COMEX-approved depositories on the U.S. east coast on Thursday. They reported receiving 50,348 troy ounces -- and shipped out 59,400 troy ounces.
All of the 'in' activity 50,348,460 troy ounces [1,566 kilobars] was dropped off at Brink's, Inc. The largest amount of 'out' activity was the 58,339 troy ounces that departed HBSC USA. The remaining 1,060.983 troy ounces/33 kilobars [SGE kilobar weight] was shipped out of Manfra Tordella & Brookes, Inc. The link to this is here.
Ted mentioned on the phone yesterday that this was the first week since the big deliveries began in March, that more gold was shipped out of these COMEX warehouses than was shipped in -- and I'm sure he'll comment on this in his weekly review later this afternoon.
In silver, there was a very decent amount of activity, as 2,706,018 troy ounces was received -- and 607,725 troy ounces shipped out.
In the 'in' category, the largest amount...1,564,266 troy ounces...arrived at Canada's Scotiabank -- and the remaining two truckloads...1,195,751 troy ounces...was dropped off at JPMorgan, taking their COMEX silver warehouses stocks to a new record high of 163.18 million troy ounces. Virtually all of the 'out' activity, one truckload...604,784 troy ounces...departed CNT, with the remaining 2,941 troy ounces leaving Delaware. There was some paper activity...as 501,701 troy ounces was transferred from the Eligible category and into Registered over at Loomis International...most likely slated for delivery in August. The link to all this is here.
There was a bit of activity over at the COMEX-approved gold kilobar depositories in Hong Kong on their Thursday. They reported receiving 312 of them -- and shipped out 10. -- and except for the 3 kilobars that departed Loomis International, the rest of the in/out activity was at Brink's, Inc. The link to that, in troy ounces, is here.
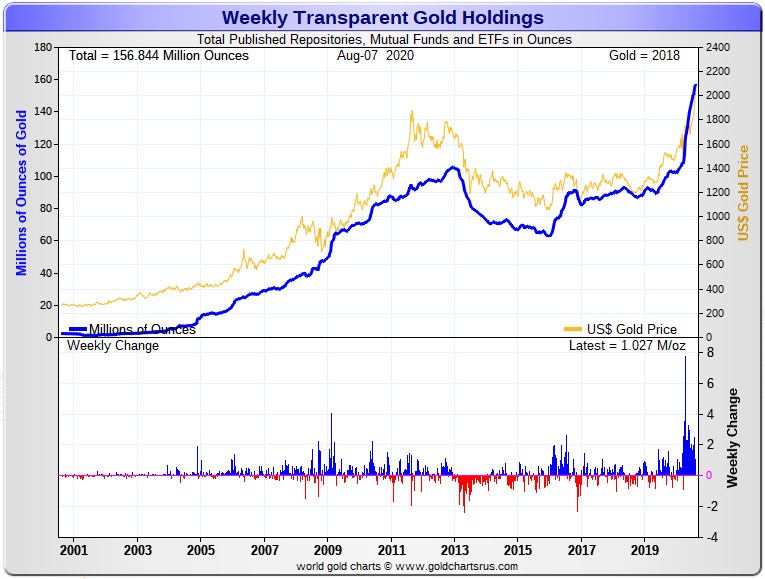
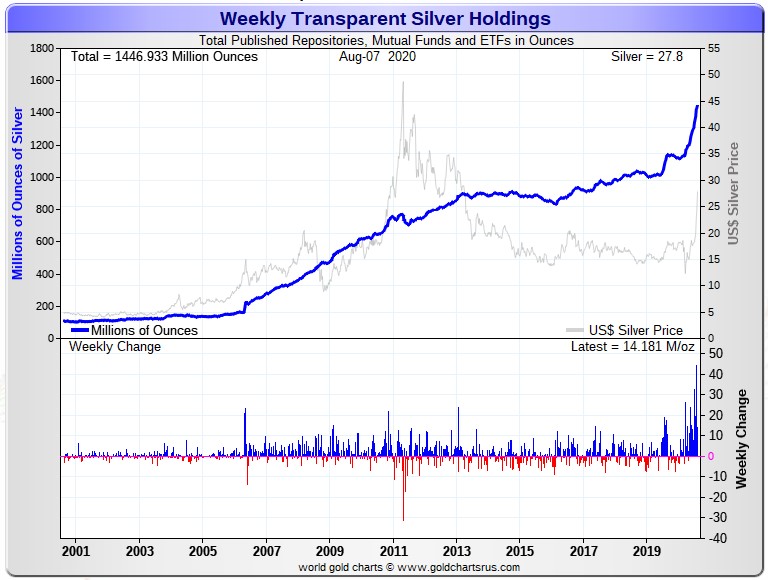
Here are the usual two charts that appear in this space every Saturday...courtesy of Nick Laird. They're the 20-year charts that show all of the gold and silver in all of the world's known depositories, mutual funds and ETFs as of the close of business on Friday.
For the week, they reported receiving a net 1,027,000 troy ounces of gold, plus a net 14.18 million troy ounces of silver. Click to enlarge for both.
|
|
|
|
The Commitment of Traders Report, for positions held at the close of COMEX trading on Tuesday came in almost exactly what Ted was hoping for...only a smallish increase in the Commercial net short position in silver -- and a smallish decline in the commercial net short position in gold.
In silver, the Commercial net short position rose by 3,868 contracts, or 18.4 million troy ounces.
They arrived at that number by increasing their long position by 3,906 contracts, but they also increased their short position by 7,592 contracts -- and it's the difference between those two numbers that represents their change for the reporting week.
Under the hood in the Disaggregated COT Report, the Managed Money traders didn't do much on either the long or short side, as Ted was hoping...decreasing their net long position by a paltry 648 contracts. It was the traders in the other two categories that did all the work this past reporting week, as the 'Other Reportables' decreased their net short position by 3,229 contracts -- and the 'Nonreportable'/small traders increased their net long position by 1,105 contracts.
Doing the math: 1,105 plus 3,229 minus 648 equals 3,686 COMEX contracts, the change in the Commercial net short position.
The Commercial net short position in silver now stands at 51,170 contracts, or 255.9 million troy ounces. The Big 8 traders are short 76,756 COMEX contracts, so the short position of the Big 8 traders is larger than the Commercial net short position by 142 percent...which is grotesque and obscene by any measure.
The short position of the Big 8 traders is up about 5,600 contracts from last week's COT Report.
Here's Nick's 3-year COT chart for silver, updated with Friday's data. Click to enlarge.
|
|
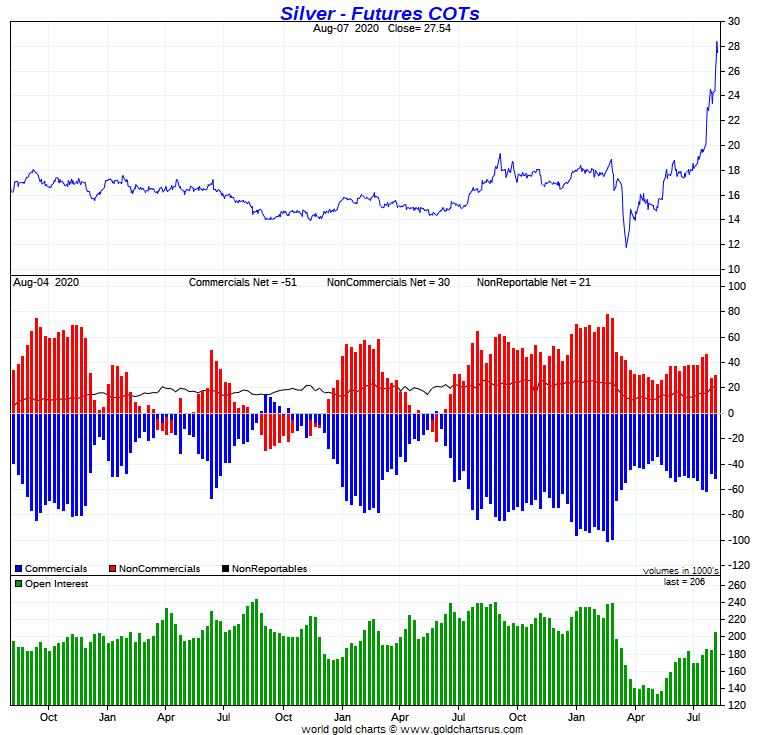
The Big 8 shorts are still behind the proverbial eight-ball -- and this past week showed that they dug themselves a bit deeper. However, they may have gotten some relief after Friday's engineered price decline, but how much that was, won't be know until next Friday.
In gold, the commercial net short position actually declined by 2,032 contracts, or 203,200 troy ounces. Ted was hoping for about unchanged -- and that number is very close to "about".
They arrived at that number by reducing their long position by 20,694 contracts, but they also decreased their short position by 22,726 contracts -- and it's the difference between those two numbers that represents their change for the reporting week.
Under the hood in the Disaggregated COT Report it was both the Managed Money traders and the traders in the 'Nonreportable'/small trader category that decreased their net long positions...the former by 3,664 contracts and 3,977 contracts respectively. It was the 'Other Reportables' that were aggressive buyers on the long side, as they increased their net long position by a further 5,609 contracts.
Doing the math: 3,664 plus 3,977 minus 5,609 equals 2,032 COMEX contracts, the change in the commercial net short position.
The commercial net short position in gold is down to 27.63 million troy ounces, so the change from last week is not material. The Big 8 traders on the other hand are net short 21.07 million troy ounces, or 76 percent of the commercial net short position. Both of these numbers are up a hair from last week. So despite all the deliveries and the short covering, their short position remains unchanged. Ted will certainly have something to say about this in his weekly review later today.
Ted also noted that the huge drop in open interest in gold was mainly due to huge spread trade positions being lifted, plus physical delivery -- and that made his estimates in gold a little foggy.
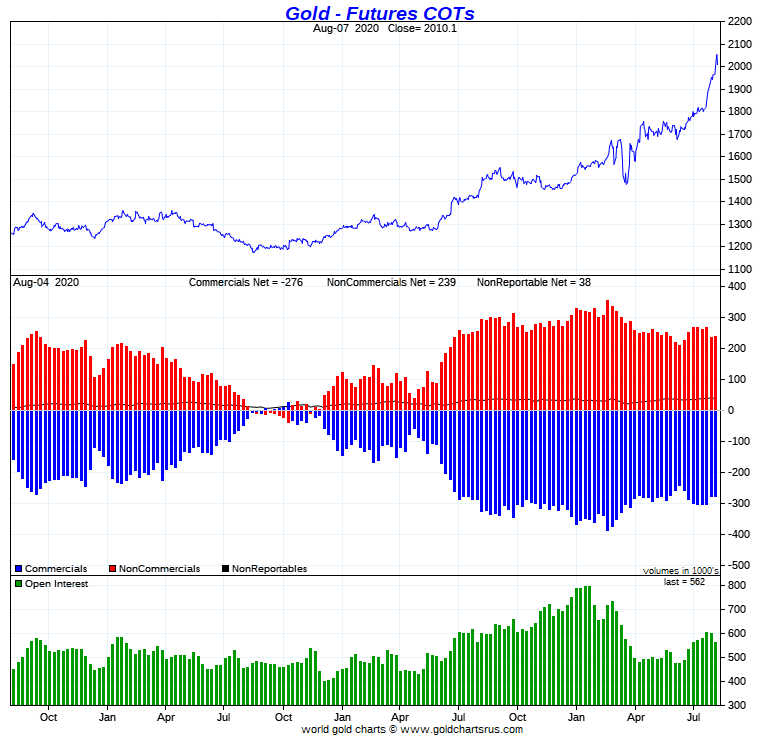
Here's the COT chart for gold, courtesy of Nick Laird -- and updated with Friday's data. There's not much to see. Click to enlarge.
|
|
So it was yet another week where there were big price advances in both silver and gold that involved no huge Managed Money buying and/or commercial selling -- and that is wildly bullish on its face.
Of course there have been some rather dramatic price moves, both up and down in silver and gold since the Tuesday cut-off. But that doesn't change anything, as the Big 8 are still firmly trapped on the short side in both these precious metals -- and improvements, if any, as of Friday's close, won't be material.
The other thing that I'll point out once again is the fact that the Big 8 traders actually increased their short position in gold by a whisker during the reporting week -- and increased their short position in silver by more than a bit. So none of the expected short covering occurred.
And lastly, as Ted has been pointing out for quite a while now, the commercial traders haven't been adding to their short positions since these rallies in gold and silver began back in March -- and that fact is extremely bullish for the price going forward...as it has been since then.
In the other metals, the Managed Money traders in palladium decreased their net long position by 297 COMEX contracts during the last reporting week -- and are net long the palladium market by 3,296 contracts...around 32 percent of the total open interest...down from 35 percent last week. As you know, the COMEX palladium futures market is a market in name only. In platinum, the Managed Money traders traders decreased their net long position by 3,735 COMEX contracts -- but are still net long the platinum market by 13,012 COMEX contracts...about 23 percent of the total open interest. The other four categories in platinum [Other Reportables/Nonreportable, and even the Swap Dealers] continue to be net long against JPMorgan et al. In copper, the Managed Money traders decreased their net long position by 5,940 COMEX contracts during this last reporting week -- and are net long copper by 53,351 COMEX contracts...1.33 billion pounds of the stuff...about 23 percent of total open interest, down from 25 percent from last week.
Here's Nick Laird's "Days to Cover" chart, updated with the COT data for positions held at the close of COMEX trading on Tuesday, July 28. It shows the days of world production that it would take to cover the short positions of the Big 4 - and Big '5 through 8' traders in each physically traded commodity on the COMEX. Click to enlarge.
|
|
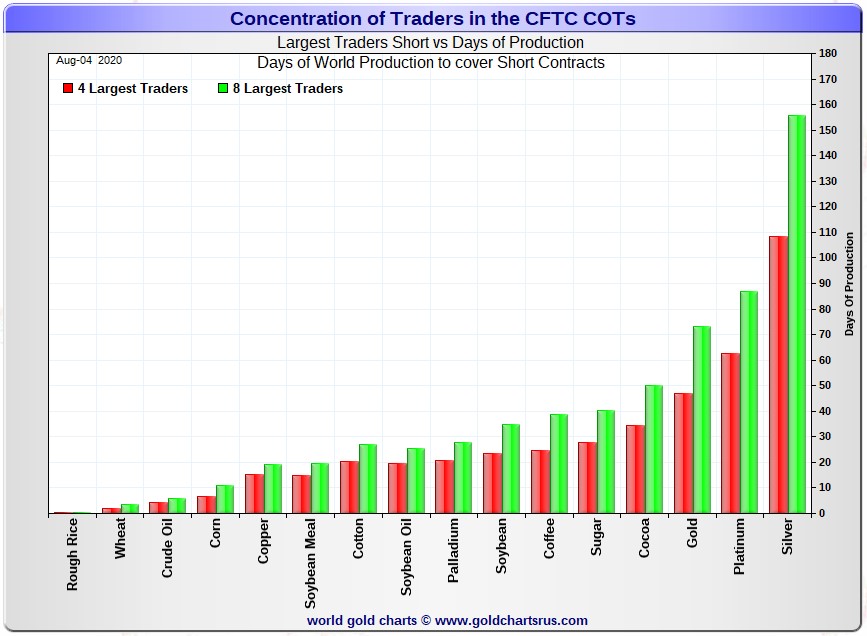
The Big 4 traders are short about 108 days of world silver production, up 3 days from last week's report. The '5 through 8' large traders are short an additional 48 days of world silver production...unchanged from last week's COT Report - for a total of about 156 days that the Big 8 are short...up 3 days from last week's report. This represents five months of world silver production, or about 364 million troy ounces of paper silver held short by the Big 8. [In the prior reporting week, the Big 8 were short 153 days of world silver production.]
In the COT Report above, the Commercial net short position in silver was reported by the CME Group as 256 million troy ounces. As mentioned in the previous paragraph, the short position of the Big 8 traders is around 364 million troy ounces. So the short position of the Big 8 traders is larger than the total Commercial net short position by about 364-256=108 million troy ounces...which is down about 22 million ounces from last week's report.
The reason for the difference in those numbers...as it always is...is that Ted's raptors, the 28-odd small commercial traders other than the Big 8, are net long that amount.
Another way of stating this [as I say every week in this spot] is that if you remove the Big 8 commercial traders from that category, the remaining traders in the commercial category are net long the COMEX silver market. It's the Big 8 [sans JPMorgan] against everyone else...a situation that has existed for over three decades in both silver and gold -- and in platinum and palladium as well.
As per the first paragraph above, the Big 4 traders in silver are short around 108 days of world silver production in total. That's about 27 days of world silver production each, on average...up a bit from last week's report. The four big traders in the '5 through 8' category are short 48 days of world silver production in total, which is 12 days of world silver production each, on average...unchanged from last week.
The Big 8 commercial traders are short 35.4 percent of the entire open interest in silver in the COMEX futures market, which is down a bit from the 38.7 percent they were short in last week's COT report. And once whatever market-neutral spread trades are subtracted out, that percentage would be a bit over the 40 percent mark. In gold, it's 37.5 percent of the total COMEX open interest that the Big 8 are short, which is up a bit from the 35.1 percent they were short in last week's report -- and a bit under 45 percent once the market-neutral spread trades are subtracted out. [It should be noted that this week's increase in gold is almost entirely due to the drop in open interest because of deliveries, plus the liquidation of spread trades]
In gold, the Big 4 are short 47 days of world gold production, unchanged from last week's COT Report. The '5 through 8' are short another 26 days of world production, also unchanged from last week's report...for a total of 73 days of world gold production held short by the Big 8...of course unchanged from last week's COT Report. Based on these numbers, the Big 4 in gold hold about 64 percent of the total short position held by the Big 8...unchanged from last week's report.
According to Ted, JPMorgan is still net long 2-3,000 contracts in silver, down from about 5,000 contracts he said they were long a week ago. In gold, Ted figures that they sold their entire approximately 5,000 contract long position -- and are now market neutral.
The "concentrated short position within a concentrated short position" in silver, platinum and palladium held by the Big 4 commercial traders are about 69, 72 and 75 percent respectively of the short positions held by the Big 8...the red and green bars on the above chart. Silver is up a percent from last week's COT Report...platinum is unchanged from a week ago -- and palladium is up 3 percentage point week-over-week.
The Big 8 shorts are still hugely exposed in all four precious metal, at least in the COMEX futures market -- and for the reporting week, their short position in gold was up a hair -- and also up a small amount in silver. For all intents and purposes, this week's COT Report showed virtually no change in anything.
But there's no question about it, there are big things going on under the hood in the precious metals world...with all the signs point to a paradigm shift in their respective prices in the not-too-distant future. That process has already begun in both silver and gold.
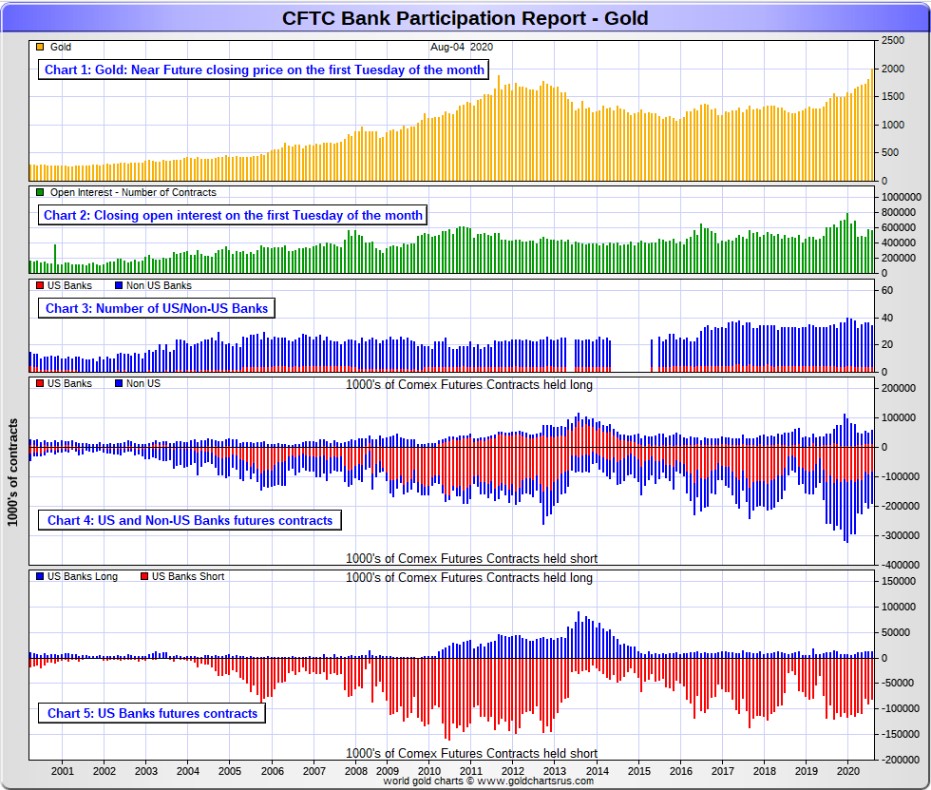
The August Bank Participation Report [BPR] data is extracted directly from yesterday's Commitment of Traders Report. It shows the number of futures contracts, both long and short, that are held by all the U.S. and non-U.S. banks as of Tuesday's cut-off in all COMEX-traded products. For this one day a month we get to see what the world's banks are up to in the precious metals -and they're usually up to quite a bit.
[The August Bank Participation Report covers the time period from July 8 to August 4 inclusive.]
In gold, 4 U.S. banks are net short 68,185 COMEX contracts in the August BPR. In July's Bank Participation Report [BPR] these same 4 U.S. banks were net short 77,647 contracts, so there was a decrease of 9,462 COMEX contracts from four weeks ago. This is a remarkable turn of events considering the price increase in gold over that time period.
Citigroup, HSBC USA and I suspect Goldman Sachs would hold the lion's share of this short position -- and that's certainly been born out when you look at August gold deliveries. As to who other U.S. bank might be that is short in this BPR, I haven't a clue, but it's a given that their short position would not be material.
Also in gold, 30 non-U.S. banks are net short 63,576 COMEX gold contracts. In July's BPR, 32 non-U.S. banks were net short 80,523 COMEX contracts...so the month-over-month change shows a very decent decrease...13,872 contracts.
But at the low back in the August 2018 BPR...these same non-U.S. banks held a net short position in gold of only 1,960 contacts -- and they've been back on the short side in a big way ever since.
However, as I always say at this point, I suspect that there's at least two large non-U.S. bank in this group, one of which would be Scotiabank/Scotia Capital. I'm starting to have suspicions about Dutch Bank ABN Amro, plus Australia's Macquarie as well. But August deliveries show that French bank BNP Paribas is another big foreign bank that is short. Other than that small handful, the short positions in gold held by the vast majority of non-U.S. banks are immaterial.
As of this Bank Participation Report, 34 banks [both U.S. and foreign] are net short 23.5 percent of the entire open interest in gold in the COMEX futures market, which is down a decent amount from the 27.7 percent they were short in the July BPR.
Here's Nick's BPR chart for gold going back to 2000. Charts #4 and #5 are the key ones here. Note the blow-out in the short positions of the non-U.S. banks [the blue bars in chart #4] when Scotiabank's COMEX short position was outed by the CFTC in October of 2012. Click to enlarge.
|
|
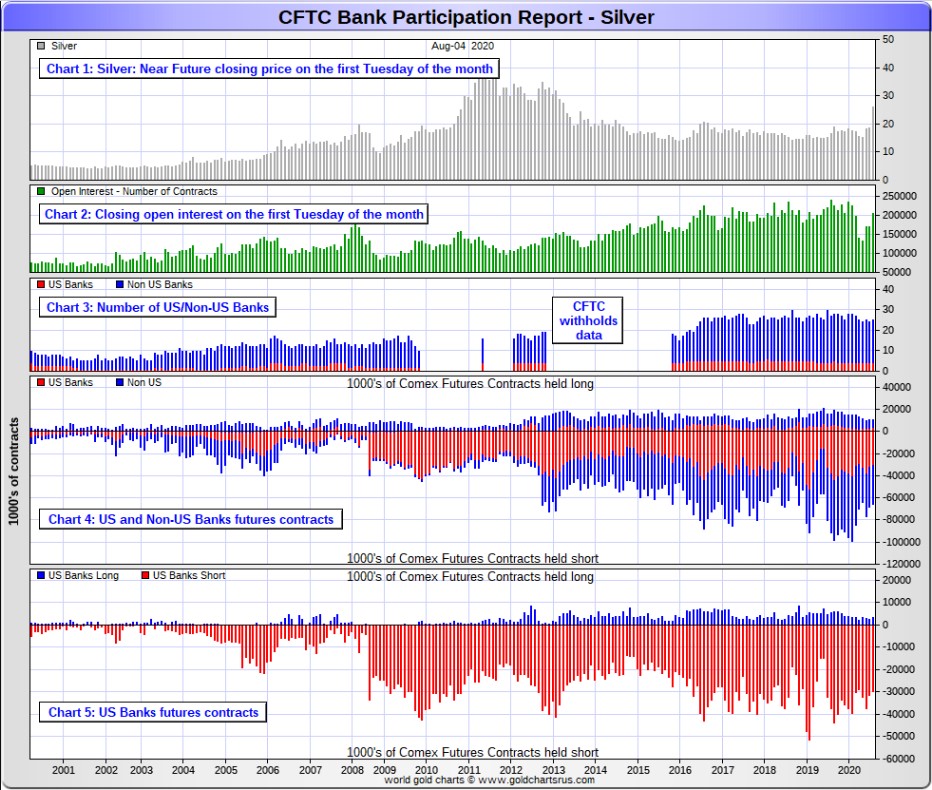
In silver, 4 U.S. banks are net short 26,392 COMEX contracts in August's BPR. In July's BPR, the net short position of these same 4 U.S. banks was 28,547 contracts, so the short position of the U.S. banks has decreased by 2,155 contracts month-over-month. Like in gold this is an eye-opening change, considering the huge price rise in silver during that time period.
As in gold, the three biggest short holders in silver of the four U.S. banks in total, would be Citigroup, HSBC USA -- and Goldman in No. 3 spot -- and whoever the remaining U.S. bank may be, their short position, like the short position of the smallest U.S. bank in gold, would be immaterial in the grand scheme of things.
Also in silver, 21 non-U.S. banks are net short 28,874 COMEX contracts in the August BPR...which is virtually unchanged from the 28,788 contracts that 20 non-U.S. banks were short in the July BPR. I would suspect that Canada's Scotiabank/Scotia Capital holds a goodly chunk of the short position of these non-U.S. banks. I also suspect that a number of the remaining 20 non-U.S. banks may actually be net long the COMEX futures market in silver. But even if they aren't, the remaining short positions divided up between these other 20 non-U.S. banks are immaterial - and have always been so.
As of August's Bank Participation Report, 25 banks [both U.S. and foreign] are net short 26.9 percent of the entire open interest in the COMEX futures market in silver-down a very decent amount from the 33.8 percent that 20 banks were net short in the July BPR. And much, much more than the lion's share of that is held by Citigroup, HSBC USA, Goldman, Scotiabank -- and maybe one other non-U.S. bank.
Here's the BPR chart for silver. Note in Chart #4 the blow-out in the non-U.S. bank short position [blue bars] in October of 2012 when Scotiabank was brought in from the cold. Also note August 2008 when JPMorgan took over the silver short position of Bear Stearns-the red bars. It's very noticeable in Chart #4-and really stands out like the proverbial sore thumb it is in chart #5. Click to enlarge.
|
|
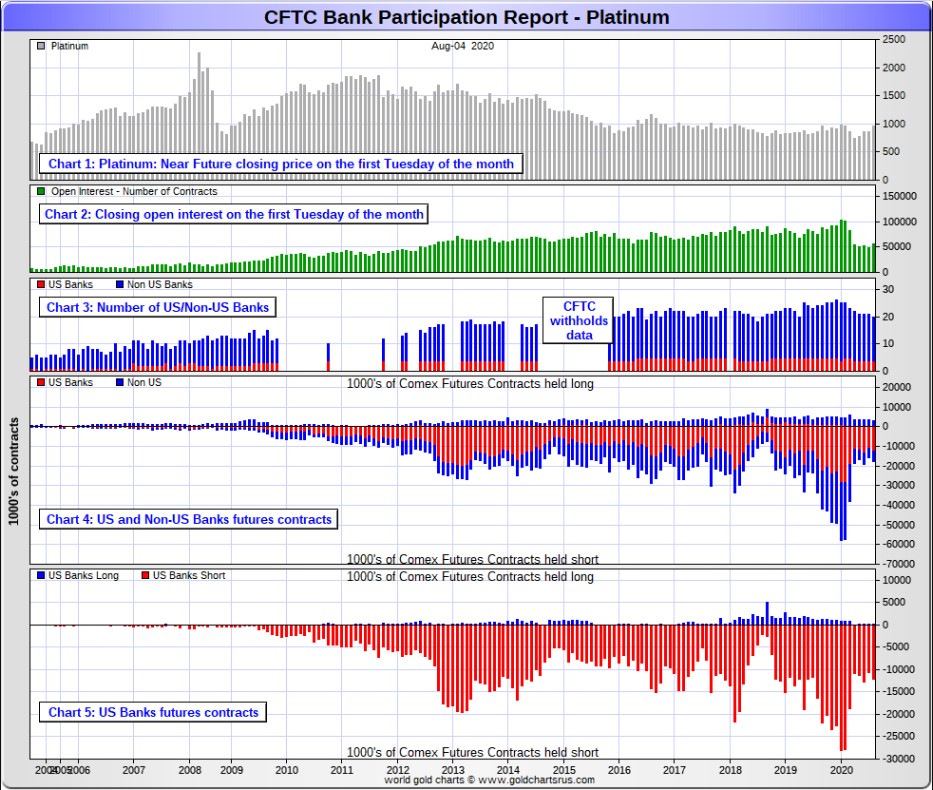
In platinum, 4 U.S. banks are net short 11,898 COMEX contracts in the August Bank Participation Report. In the July BPR, 4 U.S. banks were net short 10,563 COMEX contracts...so there's been a decent-sized increase in the short position of the big 4 U.S. banks month-over-month.
[At the 'low' back in July of 2018, these same U.S. banks were actually net long the platinum market by 2,573 contracts -- and they've still got a long way to go to get back to that number, if they ever do.]
Also in platinum, 16 non-U.S. banks are net short 2,674 COMEX contracts in the August BPR, which is up from the 1,659 COMEX contracts that 17 non-U.S. banks were net short in the July BPR.
[Note: Back at the July 2018 low, these same non-U.S. banks were net short only 1,192 COMEX contracts.]
And as of August's Bank Participation Report, 20 banks [both U.S. and foreign] are net short 26.1 percent of platinum's total open interest in the COMEX futures market, which is up a bit from the 24.9 percent that 21 banks were net short in July's BPR. The short position in platinum has certainly come down a lot from what it was just seven short months ago. But it's the U.S. banks, or most likely their clients, that are on the short hook big time.
Here's the Bank Participation Report chart for platinum. Click to enlarge.
|
|
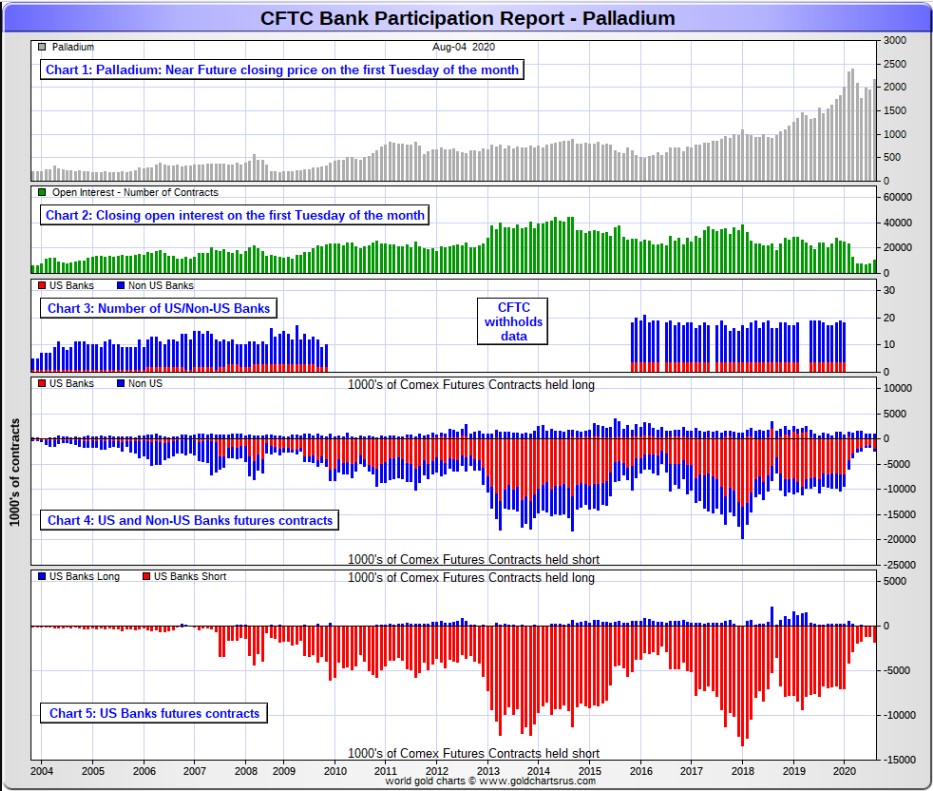
In palladium, '3 or less' U.S. banks are net short 1,761 COMEX contracts in the August BPR, up from the 1,194 contracts that these same 3 or less U.S. banks were net short in the July BPR. Nothing to see here.
Also in palladium, '9 or more' non-U.S. banks are net long 322 COMEX contracts-compared to the 561 COMEX contracts that '14 or more' non-U.S. banks were net long in the July BPR. Nothing to see here, either.
And as I've been commenting for almost forever now, the COMEX futures market in palladium is a market in name only, because it so illiquid and thinly-traded.
As of this Bank Participation Report, 12 banks [both U.S. and foreign] are net short 14.1 percent of the entire COMEX open interest in palladium...up from the 8.5 percent of total open interest that 14 banks were net short in May. Because of the small numbers of contracts involved, along with a tiny open interest, these numbers are pretty much meaningless. So, for the sixth month in a row, the world's banks are no longer involved in the palladium market in a material way -- and if they are, I suspect that it's their clients that are on the hook.
Here's the palladium BPR chart. And as I point out every month, you should note that the U.S. banks were almost nowhere to be seen in the COMEX futures market in this precious metal until the middle of 2007-and they became the predominant and controlling factor by the end of Q1 of 2013. But, as I mentioned above, they have imploded into insignificance over the last six Bank Participation Reports -- and it remains to be seen if they return as short sellers again at some point like they've done in the past. Click to enlarge.
|
|
Except for palladium, only a small handful of the world's banks still have meaningful short positions in the other three precious metals -- and judging from August deliveries, a lot of their clients are the ones on the short hook.
JPMorgan is out of its short positions in both silver and gold -- and may be in platinum and palladium as well, but there's no way to know that.
The precious metals are certainly set up for a rocket ride higher when JPMorgan allows it -- and we're already off the launch pad. But when things get really serious to the upside, it will be very much to the detriment of those Big 8 shorts in particular -- and the rest of the shorts in general, as their short covering will be the rocket fuel that drives precious metal prices to the moon, particularly silver.
I have a decent number of stories, articles and videos for you today. And included in the list are a couple that I've been saving for today's column for length and/or content reasons.
CRITICAL READS
Trump Was Right: "Big" Payroll Number Smashes Expectations as 1.76 Million Jobs Added
With analyst and trader expectations about today's payrolls report fluctuating wildly, with some expecting a sizable drop after this week's disappointing ADP report and ISM employment components not to mention rolling over high frequency date...
... while others hoping the recent trend of payrolls increases continues after president Trump tried to stoke optimism saying to expect a "big number", moments ago the BLS reported that in the end the good news won out with the US economy adding 1.763MM, which while above the 1.48 million estimate was still well below June's record 4.8MM surge.
Still, as the ADP payrolls report hinted, the manufacturing sector is starting to sputter, with just 26K jobs added in July. Click to enlarge.
|
|
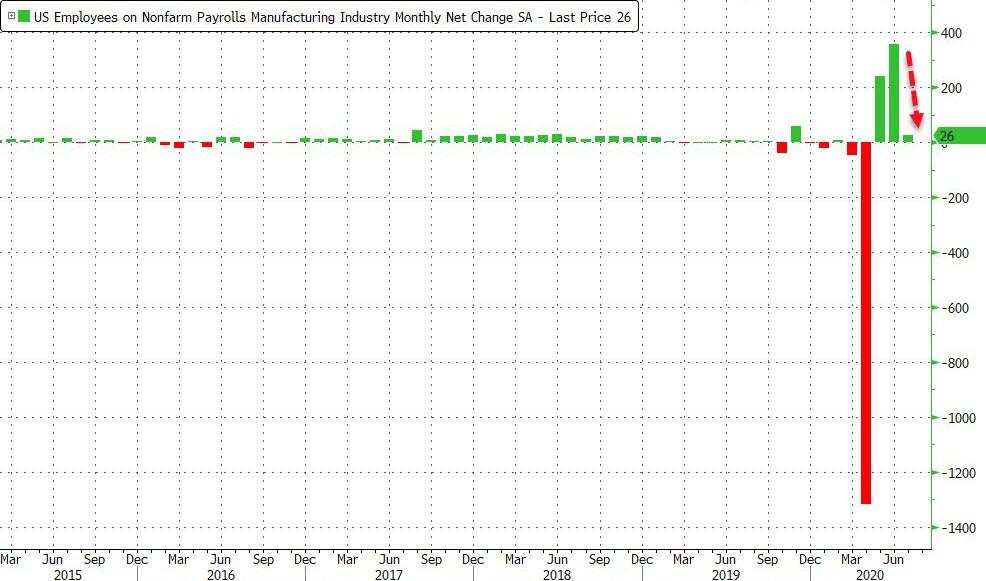
The question is: at what point do all these millions in "temporary layoffs" become permanent.
Looking at the details of the jobs report, the largest employment increases in July occurred in leisure and hospitality, government, retail trade, professional and business services, other services, and health care.
This longish and chart-filled commentary showed up on the Zero Hedge website at 9:50 a.m. on Friday morning EDT -- and it's the first contribution of the day from Brad Robertson. Another link to it is here. Then there was this Bloomberg story on this subject headlined "Job Growth Tops Estimates, Signaling U.S. Rebound Is Grinding On" -- and I thank Swedish reader Patrik Ekdahl for sharing it with us.
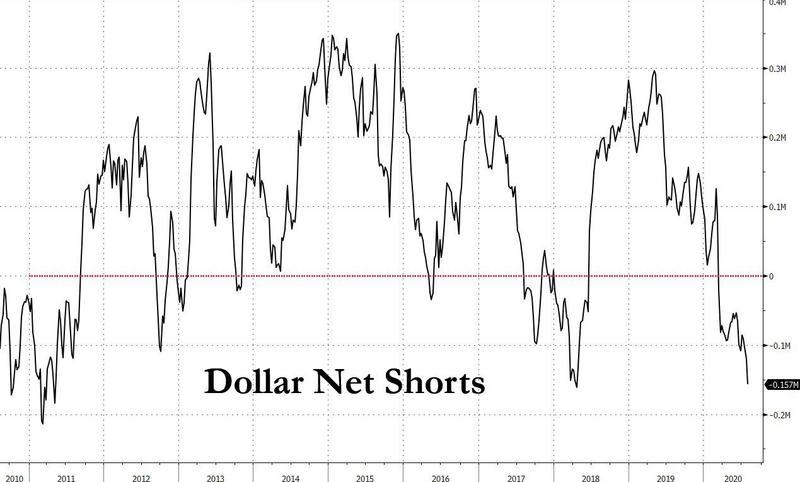
Morgan Stanley Covers Dollar Short; Goldman Gets More Bearish
The U.S. dollar surged Friday after President Trump issued executive orders banning the Chinese messaging app WeChat and video-sharing app TikTok. The ban will take effect in 45 days has sparked further deterioration in Sino-U.S. relations.
The dollar rebound against the Swiss franc, the pound, and the euro, as the safe-haven trade was ignited by what could seemingly be a technology war between the U.S. and China.
Morgan Stanley published a note Friday (seen by Reuters) indicating the greenback is at the most oversold level in 40 years, with rising probabilities of a near term reversal.
The investment bank recently exited its dollar-bearish trade as it turned "tactically neutral" on the safe-haven currency while closing longs in euro and Australian dollar.
Morgan Stanley said its Combined Market Timing Indicator for equity markets triggered a "sell" signal, the first time since January 2018.
"With global markets appearing tactically stretched a sell signal on our MTI (market timing indicator) would certainly add to the notion that upside on markets may be capped near term," the bank warned clients.
As Morgan Stanley recognizes a short squeeze in the greenback could be ahead, we noted last week the short dollar trade has likely become an overcrowded trade shown via CFTC data. Click to enlarge.
|
|
Shorting the dollar accelerated this summer. Goldman's FX strategist continues to push out bearish notes...
As you should know, a short covering 'rally' in the dollar index, either by design or circumstance, is something that I've been watching for a while now. This Zero Hedge article put in an appearance on their website at 11:50 a.m. EDT on Friday morning -- and comes courtesy of Brad Robertson. Another link to it is here. Gregory Mannarino's post market close rant for Friday is also courtesy of Brad Robertson. I have it on good authority from reader Mac P....plus from my daughter, who had this to say about it in an e-mail to me last night..."it quickly became "adult entertainment" right after the 12 minute mark. And it continues through the rest of it... when you least expect it of course."...so you have been forewarned! The link is here.
U.S. Consumer Credit Rises For the First Time Since the Covid Crisis
After three months of record declines, total U.S. consumer credit posted its first increase in the month of June since the covid crisis, rising by a modest $8.9 billion, below the $10 billion expected, but the positive print since February nonetheless. Click to enlarge.
|
|
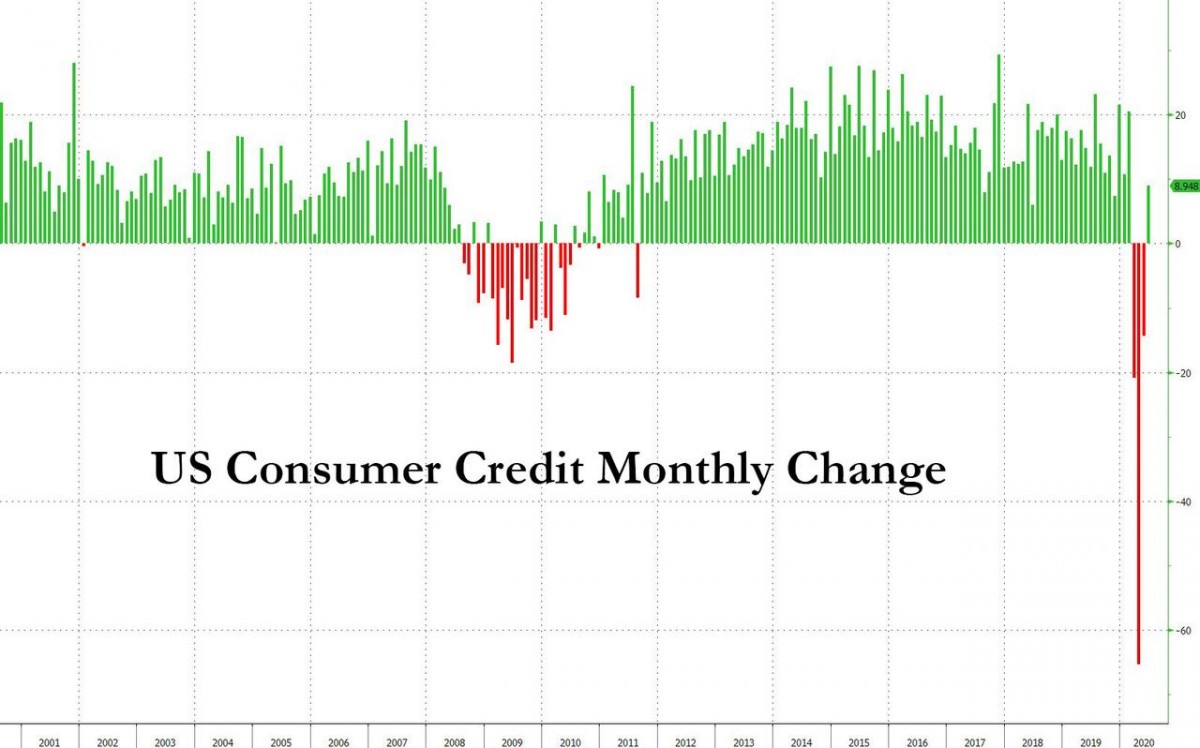
In total, June consumer credit rose 2.6% at an annual rate to $4.125 trillion up from $4.116 trillion in May, according to the latest G.19 statement.
Broken up into its components, revolving credit actually posted another modest drop, but nothing compared to the record credit card repayment seen in April when credit card balances shrank by nearly $60 billion.
Finally, when looking at the biggest component of U.S. household debt after mortgages, namely auto loans and student loans, it's as if nothing every happened, with both series hitting new all time highs.
With total credit now once again positive, and revolving credit likely having gone green in July, it appears that life in America - where virtually everyone spends well beyond their means - is back to normal. At least until the next forced state shutdowns a few weeks from now to ensure that the economy is in complete shambles by the time November 3 rolls by.
This Zero Hedge story was posted on their website at 3:30 p.m. on Friday afternoon EDT -- and another link to it is here.
David Stockman: The Biggest Threat to Your Prosperity and What You Can Do
If you want to understand America's dangerously deepening travails, you have to start at the Federal Reserve's Eccles Building.
After a 30-year rolling coup d'etat, its occupants have imposed a regime of destructive falsification on America's financial, economic, political, and social life.
It has become the heart of mushrooming darkness taking prosperity, liberty, and democracy down for the count.
How do we get 50 million unemployed... the stock market at record highs... companies trashing their balance sheets to buy back stock and do vastly overpriced M&A deals... doctors and politicians savaging the economy and the livelihoods of millions... and Washington going incontinent on the fiscal front?
The answer is simple: the rapidly-spreading dysfunction is rooted in the giant financial fraud embedded in the Federal Reserve's $7 trillion balance sheet.
This very short, for David, commentary was posted on the internationalman.com Internet site on Friday sometime -- and another link to it is here.
Filling the Gaps in America's Economy -- Bill Bonner
Whee!
What fun! Like visiting an insane asylum every day, just for laughs.
But first, let's look at the grim news:
The big CARES Act giveaways are winding down. The Paycheck Protection Program, for example, expires tomorrow...
But last week, 1.2 million people filed for U.I. (unemployment insurance compensation)... the 20th week in a row with more than 1 million new claims.
Already, the U.I. checks are coming in a little light, since the $600 per week supplement is drying up, too.
And landlords are now free to evict their tenants.
But don't give up - you farmers, longshoremen, brain surgeons (and especially you, cronies and insiders) - more help is on the way.
Though temporarily stalled in a partisan battle between Republicans and Democrats, each side trying to score political points in the run up to the election, we have 100% confidence that more fake money is practically on its way.
This interesting commentary from Bill appeared on the rogueeconomics.com Internet site on Friday sometime -- and another link to it is here.
Doug Noland: Global Lender of Last Resort
March's financial dislocation - the "seizing up" of global markets - corroborated the global Bubble thesis. International data along with myriad anecdotes over recent years have pointed to an unprecedented post-crisis expansion of global leveraged speculation. March saw the powerful explosion of de-risking/deleveraging swiftly bring global finance to its knees.
It was integral to my analysis that the Fed's restart of QE last September - so-called "insurance" stimulus - stoked "terminal phase" speculative excess at home and abroad.
An even greater dislocation erupted in international markets for dollar-denominated bonds and dollar-related derivatives. This followed years of unprecedented growth in dollar debt globally, along with corresponding levered speculation in these instruments (and related derivatives).
With "non-bank" dollar-denominated liabilities having doubled over the past decade to $12 TN - and FX swaps expanding to an estimated $40 TN - you're talking massive proliferation of "offshore" dollar obligations. March's "seizing up" confirmed that way too much speculative leverage had accumulated internationally. This helps explain why massive ($3 TN) Federal Reserve liquidity injections were required to reverse de-risking/deleveraging dynamics. As the BIS stated: "With the GFC [great financial crisis] as precursor, the role of the Federal Reserve as a global lender of last resort has been further cemented."
The Fed's interventionist leap into corporate bonds and ETFs clearly exerted profound market impact. Suddenly, the Fed was viewed as providing a direct liquidity backstop, boosting the attractiveness (and prices!) of corporate Credit and fixed-income ETFs in particular. Not generally as appreciated - yet arguably more momentous - the Fed's aggressive liquidity measures and expansion of swap lines with the international central bank community were seen as creating a liquidity backstop for the massive offshore markets for dollar-denominated instruments (bonds and derivatives).
It's not difficult to envisage a scenario where the Fed finds itself stuck deep in geopolitical muck. Pressure to lend to our allies and avoid the others - a process that would seemingly accelerate the transformation to a more bi-polar world. I've for a while now pondered the relationship between the Fed and PBOC when things turn sour between Washington and Beijing. There are enormous amounts of dollar-denominated debt in China and Asia - too much held by leveraged speculators.
The bursting of the global dollar debt Bubble will likely coincide with a major deterioration in the dollar's value as the world's reserve currency. And this seems like a pretty good explanation for surging precious metals prices. Markets these days see nothing that could keep the Fed from aggressively employing endless QE necessary to sustain market Bubbles. There are myriad complexities and challenges being ignored today by the risk markets.
I've been reading Doug's column for twenty years now -- and as you know, it's always a must read for me, with today's offering being no exception. It was posted on his Internet site in the wee hours of Saturday morning EDT -- and another link to it is here. And if you haven't had enough of Doug's thoughts, here's a 62-minute audio interview with him, hosted by the folks over at McAlvany Financial. It's very interesting, but it's also a quick cure for insomnia. It's headlined "It's Too Late To Turn Back Now... I Believe You Should Take Cover!" -- and I thank Elliot Simon for pointing it out. For length reasons, it had to wait for today's column -- and the link to it is here.
Earlier this year, Wall Street On Parade reported that the Chairman of the Federal Reserve, Jerome Powell, had an upward range of $11.6 million invested with the investment management firm, BlackRock, and its iShares Exchange Traded Funds, according to Powell's 2019 financial disclosure form.
Powell's 2020 financial disclosure form is now available. It was signed by Powell on May 15, 2020 and it shows that Powell's holdings in BlackRock investments have reached an upward range of $24.95 million - an increase of $13.35 million over the prior year's upward range.
The date that Powell signed his latest financial disclosure, May 15, is noteworthy. It means that more than 45 days after the New York Fed had hired BlackRock to manage its commercial mortgage-backed securities program and its $750 billion primary and secondary purchases of corporate bonds and ETFs in no-bid contracts, Fed Chairman Powell saw no reason to avoid the conflict of interest of allowing BlackRock to continue managing upwards of $25 million of his own personal money.
According to a statement released by the New York Fed, BlackRock was retained on March 24 to manage the $750 billion corporate bond buying programs for the Fed. The commercial mortgage-backed securities contract was entered into with BlackRock on March 25.
The ethical wall between the New York Fed and BlackRock would have no reason to include the Chairman of the Federal Reserve Board of Governors in Washington, D.C. Despite that, Powell has conducted four confidential phone calls with BlackRock's CEO, Larry Fink, since March, lasting a total of 90 minutes. The first call on March 19 lasted 30 minutes; there were two calls in April, one on April 3 and one on April 9, both lasting 15 minutes. May is the last month of Powell's calendar that is currently available. It shows a call between Powell and Fink on May 13 lasting 30 minutes.
Powell was asked about three of these phone calls by New York Times reporter Jeanna Smialek at his press conference on July 29. The exchange went as follows:
This commentary put in an appearance on the wallstreetonparade.com Internet site on Friday sometime -- and the first person through the door with it was Dennis Miller. Another link to it is here.
Why America shouldn't have nuked Japan -- Opinion
U.S. belief that atomic bombings were necessary to obviate even deadlier invasion of Japan is as false 75 years later as it was at the time
Seventy-five years ago today, the United States unleashed the only nuclear war in history.
Among the truths held self-evident by millions of Americans is the notion that the atomic destruction of Hiroshima and Nagasaki saved lives, both American and Japanese.
The choice, Americans learn, was between atomic bombs and an even bloodier invasion of Japan, whose fanatical citizens would have fought to the death defending their homeland and their emperor.
This narrative is deeply flawed.
'Anxious to terminate'
Japan had in fact been trying to find a way to surrender for months and U.S. leaders knew it. Japan could no longer defend itself from the relentless U.S. air onslaught; ferocious firebombing had reduced most Japanese cities, including Tokyo, to ash.
General Curtis LeMay, commander of strategic bombing, even complained that there was nothing left to bomb but "garbage can targets."
The Allies, through a secret crypt-analysis project code named Magic, had intercepted and decoded secret transmissions from Shigenori Togo, the Japanese foreign minister, to Naotaki Sato, the ambassador in Moscow, stating a desire to end the war.
However, saving face was imperative to the Japanese, which meant retaining their emperor. Unconditional surrender was, for the time being, out of the question.
This interesting opinion piece was posted on the asiatimes.com Internet site on Thursday -- and for obvious reasons, had to wait for today's column. I thank Tolling Jennings for sharing it with us -- and another link to it is here. There's another story about this on the Zero Hedge website -- and it's headlined "The Hiroshima Myth"
Butler, Macleod, and GATA lauded by Eric Sprott in weekly review with Craig Hemke
In his weekly review with the TF Metals Report's Craig Hemke at Sprott Money, mining entrepreneur Eric Sprott marvels at the recent explosion in gold and silver prices. He says that last week for the first time in history the bullion banks were covering their short positions in monetary metals futures contracts.
This short-covering, Sprott says, caused the recent price increases in gold and silver. For years only the bullion banks had been selling, Sprott says, and now, as physical demand begins to overtake derivative selling and the banks want to cover, there is no one else to take their place as sellers.
Sprott compliments silver market analyst and market manipulation whistleblower Ted Butler and says he followed the advice of Butler's newsletter to buy out-of-the-money calls on the exchange-traded silver fund SLV.
Sprott reiterates his enthusiasm for silver's prospects -- he foresees the gold-silver ratio returning to the historic level around 15 to 1 -- and discusses several mining companies in which he has invested.
The discussion is 25 minutes long and was conducted on Friday morning EDT. It was posted on the sprottmoney.com Internet site early yesterday afternoon -- and I borrowed all of the above intro from a GATA dispatch. Another link to it is here.
Record bullion prices give South African gold miners a lifeline while risks remain
South African gold miners are looking to cut debt and boost dividends as bullion hits record highs, with analysts and fund managers predicting a sectoral growth spurt over the next two years amid rising investor interest.
Shunned by investors due to mines that are old, deep, and difficult to extract metal from, the country's gold miners have traded at a discount to their global peers for years.
Higher prices, as spot gold roared past $2,000 an ounce for the first time, coupled with a weaker rand currency, come as a lifeline.
Interviews with companies executives, analysts, and fund managers show that higher gold prices could see some local miners bring their net debt to zero and pay healthy dividends over the next 18 to 24 months.
"Gold-mining companies will spew a lot of cash in the next 12 months," said Franco Lorenzani, an independent mining analyst.
This Reuters story, filed from Johannesburg, appeared on their Internet site at 1:23 a.m. EDT on Friday morning -- and was updated about three hours later. I found it on the gata.org Internet site -- and another link to it is here.
Hong Kong's wealthy move gold out of city on security law fears
Hong Kong's wealthy are moving increasing amounts of their gold out of the financial hub after Beijing imposed a new national security law on the city last month, dealers in the precious metal say.
Private-sector investors have shifted about 10 percent of their physical gold from the territory to countries such as Singapore and Switzerland over the past 12 months, according to Joshua Rotbart, head of J Rotbart & Co, a Hong Kong-based gold dealer and storage provider.
The trend started last year during anti-government protests in the city and has picked up with the passing of the security law, as investors fret about political uncertainty and the rule of law.
"Many clients now perceive Hong Kong as riskier than other jurisdictions," Rotbart said. After the national security law was passed, he could "see an immediate response from Hong Kong residents... asking to store it somewhere else." ...
This gold-related news item showed up on the Financial Times of London website -- and the rest of this story is hidden behind their pay wall. I found it in a GATA dispatch yesterday -- and another link to it is here.
Ted Butler: Don't Forget the Silver Users
Today, I would like to take a stroll down memory lane and revisit an issue that dominated the endless and often heated daily conversations I had with my dearly departed old friend, Israel Friedman. In the early days (circa the mid-1980's), Izzy's interest in my allegations of a short selling scam on the COMEX went to the motivations behind the price suppression and not so much the mechanics of the manipulation. He did issue me the challenge to come up with the explanation for why silver was so cheap in the face of a documented physical shortfall between supply and demand and it did take me a year to come up with the answer - but for some reason, Izzy didn't latch onto it immediately (not many -or actually any - people did).
So Izzy looked instead to the motivation, sort of accepting my COMEX short selling explanation, but shifting the conversation to who was benefiting from the depressed silver prices under the assumption that those benefiting the most were the likely forces behind the paper short selling on the COMEX. It was logical enough to steer me in that direction and I quickly discovered the highly unusual circumstance that silver was the only commodity to have an industrial users association - aptly named the Silver Users Association (SUA). The big members were Eastman Kodak, DuPont and 3M and a slew of silverware manufacturers.
Much in the same manner I've approached the COMEX silver manipulation, since the only conceivable purpose for a commodity users association - no less the only one in existence - was to secure silver at depressed prices, I engaged in a years-long effort to attack the SUA, with everyone I thought had jurisdiction, certainly including the Justice Department on antitrust and price-fixing grounds. As it turned out, there wasn't much evidence that the SUA was behind the short selling on the COMEX, but they sure as heck had a lot to do with the US Government disposing all of its massive silver stockpile. I can't find a working link for an article I wrote in 2001, "Silver Users, Silver Abusers," but here's an excerpt -
"The chief purpose of the Silver Users Association, when it was formed 54 years ago, was to lobby and convince the U.S. Government to dispose of its immense stockpile of silver, as much as 4 billion ounces of silver, at as favorable a price as possible. Of course, when I say "favorable", I'm talking about as low a price as possible to the members of the SUA. The prices were decidedly "unfavorable" to the owners of that silver, the citizens of the United States. But, in any event, the SUA was successful beyond imagination. In my opinion they conspired to hold down prices and that's an anti-trust violation. The SUA achieved an almost impossible feat. They made off with the world's largest known stockpile of silver. Let's see - the U.S. Government had billions of ounces of silver the year the SUA was formed, and 54 years later, the U.S. announced it would have no silver left this year. That is truly remarkable. And the best part (or worst part, if you are a regular citizen) is that the SUA got a real "steal" of a price on that silver, roughly one dollar an ounce. Slick and successful would be mild words when judging the accomplishments of the Silver Users Association. So would price fixing." - Taken from Ted Butler's 2001 essay entitled"Silver Users, Silver Abusers"
While the Silver Users Association is for all intents a thing of the past, what's still of utmost importance is the coming role of the world's industrial silver consumers, many of which did not exist back in the late to mid-1980's in my heated discussions with Izzy Friedman. Solar panels and electric cars, to say nothing of I-phones and electronic devices of every type imaginable, simply did not exist back then. So even though the names of the big silver industrial users have changed drastically over the decades, the core of the basic premise that Izzy and I hatched out in incessant daily conversations hasn't changed a bit.
This very worthwhile commentary from Ted put in an appearance on the silverseek.com Internet site on Friday sometime and it's worth reading. Another link to it is here.
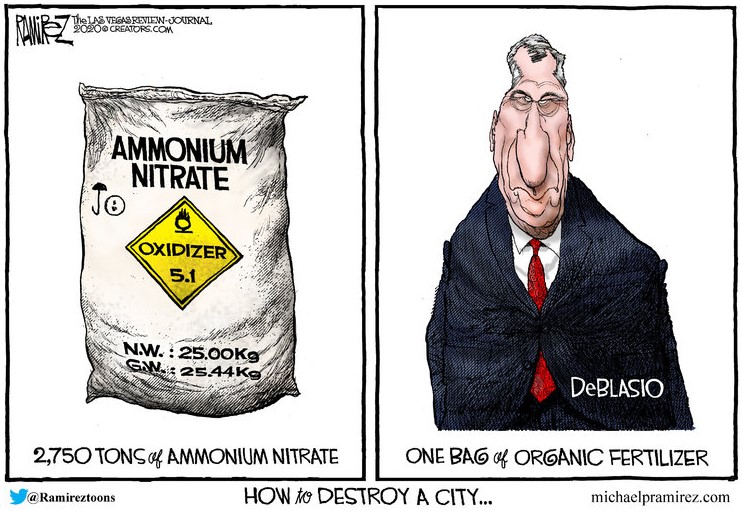
The PHOTOS and the FUNNIES
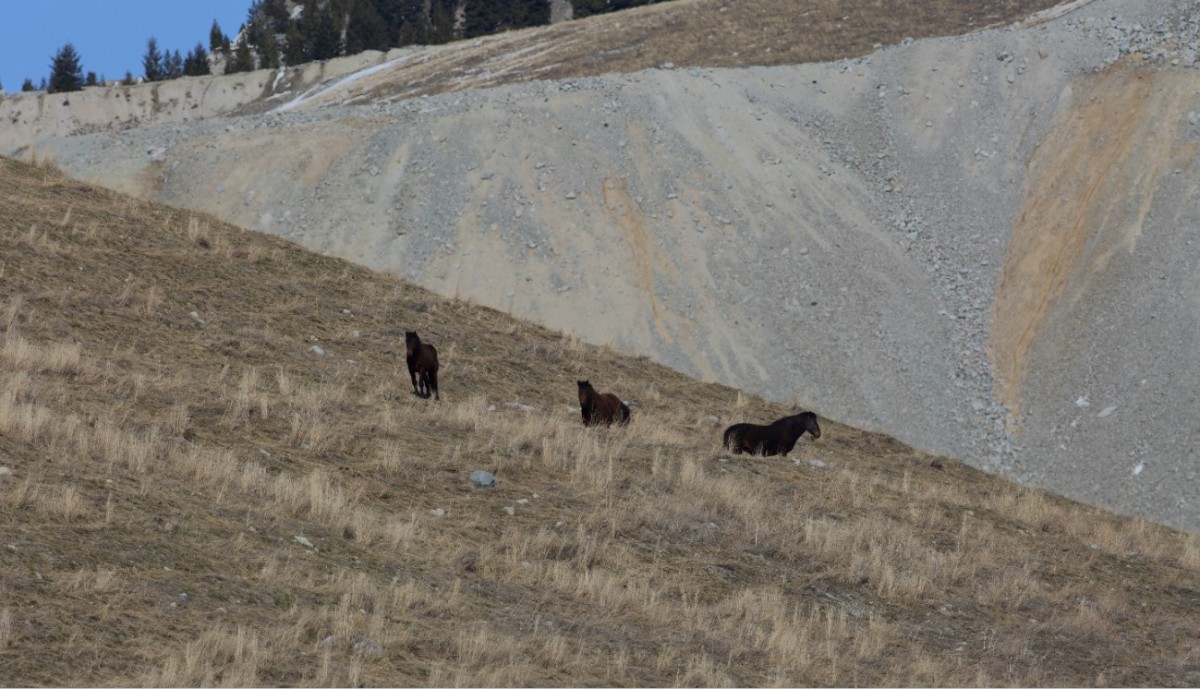
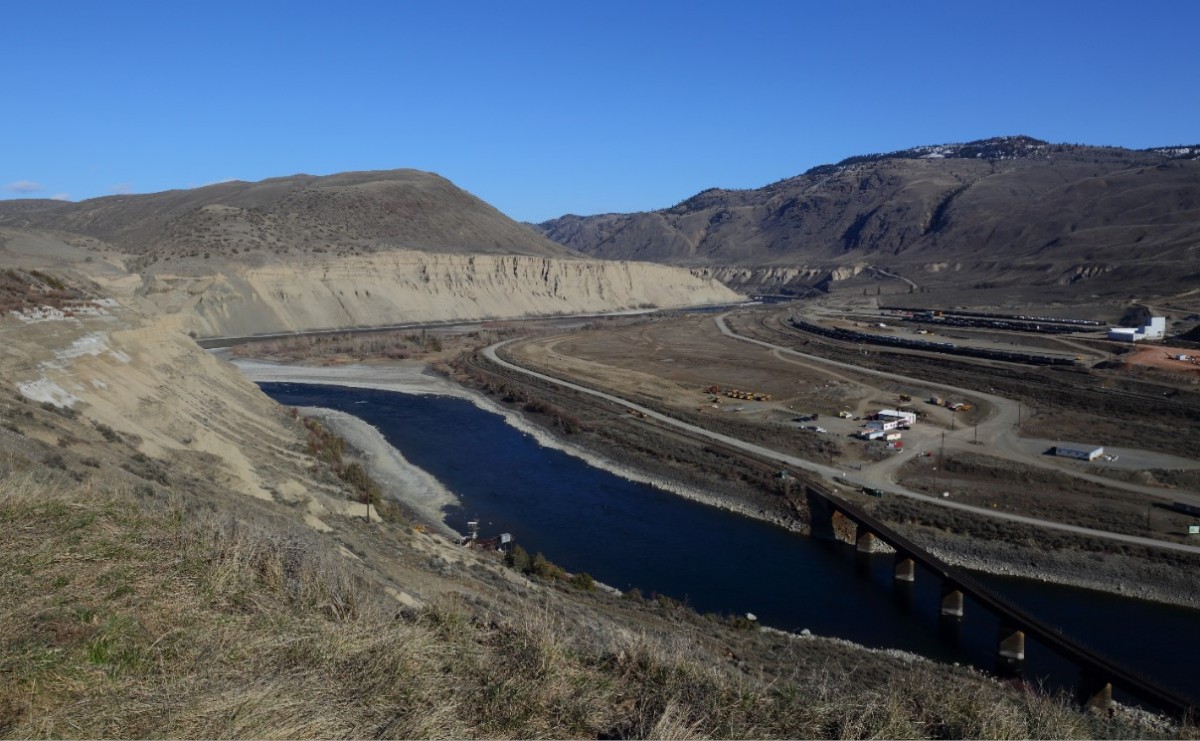
On March 21 -- and under a clear sky, we headed off to Ashcroft via Logan Lake and past the Highland Valley Copper mine on B.C. Highway 97C. The first two shots are of feral/wild horses grazing/resting on reclaimed tailings from the mine. The next photo was taken from the bench just north of Ashcroft, overlooking the CN/CP Rail tracks. Both are on the same side of the Thompson River here, because of the obviously unstable canyon wall on the opposite shore. Turning the camera around 180 degrees from photo 3, reveals a ranch that owes its existence to irrigation, as this particular area of B.C. is the driest region in Canada..., except for the High Arctic. Click to enlarge.
|
|

|
|
|
|
|
|

|
|

|
|
The WRAP
Today's pop 'blast from the past' is one that's been running through my head most of this week -- and by posting it in today's column, I hope to rid my mind of it. It was first recorded by B.W. Stevenson of Dallas, Texas back in 1973 -- and was a huge hit for him. But it was covered 23 years later by country duo Brooks and Dunn -- and it was an equally big hit for them. I prefer the original -- and the link to it is here. But if you prefer the B&D version, the link to that is here.
Today's classical 'blast from the past' is somewhat off the beaten path. I've posted it before, but it's been many years. It's one of the few known works for a solo viola and orchestra that ever shows up in a concert hall. It's a Hector Berlioz composition that dates from way back in 1834 -- and it is considered more a symphony in some respects, rather than a concerto.
Italian violin/viola virtuoso Niccolò Paganini had encouraged Berlioz to compose the work for him, but was disappointed when he heard the completed first movement -- and rejected it because he "wanted to be playing continuously."
Paganini did not hear the work he had commissioned until 16 December 1838; then he was so overwhelmed by it that, following the performance, he dragged Berlioz onto the stage and there knelt and kissed his hand before a wildly cheering audience and applauding musicians. A few days later he sent Berlioz a letter of congratulations, enclosing a bank draft for 20,000 francs.
Here's the Frankfurt Radio Symphony performing the work at the Rheingau Musik Festival back on 24 June 2018. The link is here.
Well, the expected engineered price declines in the precious metals materialized on Friday, along with an equally engineered price rally in the U.S. dollar index. But 'da boyz' had to work at it, as they didn't get started until about twenty minutes after the job numbers hit the tape -- and to their dismay, the precious metals began to head north with some conviction, as the dollar index headed south...so they had to step in.
To make matters worse, the moment they stopped their efforts, gold and silver prices were quick to recover a lot of their losses -- and finished well off their lows of the day. So Friday's efforts certainly didn't help the Big 8 shorts, as all they managed to do was blow out some of the newer long contracts that had been placed over the preceding few trading days.
Is there more down-side price action to come next week? The short answer is...I don't know. So is the long answer.
However, it's a very reasonable bet that a decent amount of the "low-hanging fruit" that Ted has been going on about for the last few weeks, got picked during the COMEX trading session in New York. And if a COT Report could be generated as of the close of trading yesterday, it would most likely show a futures market set-up even more bullish than it is already.
But as I've pointed out in this missive earlier -- and will do so again here...silver and gold are still overbought -- and the U.S. dollar is still hugely oversold. But does it matter this time?
As Ted has mentioned on many occasions over the years, at some point in time the COT Report will no longer be a useful guide in the price path of the precious metals going forward. We've already reached that point with it, starting in March -- and it remains to be seen if what happens in the currency markets going forward, will have any relationship to what has happened in the past.
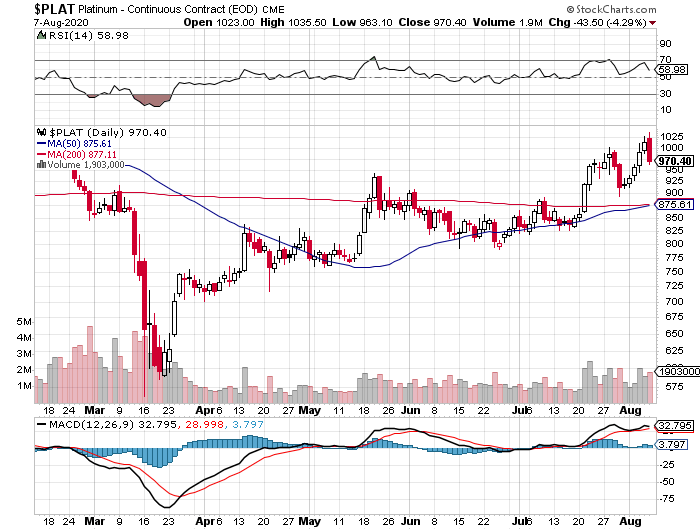
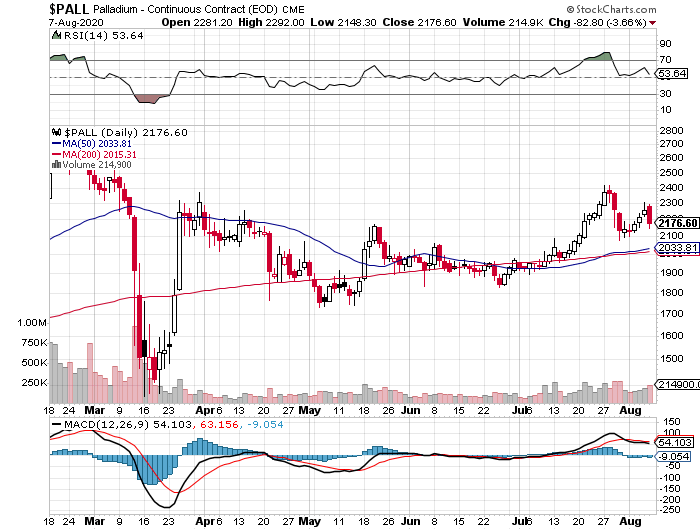
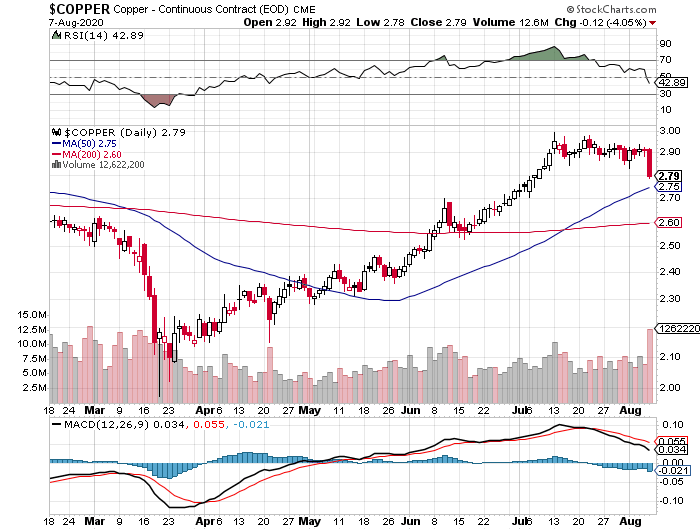
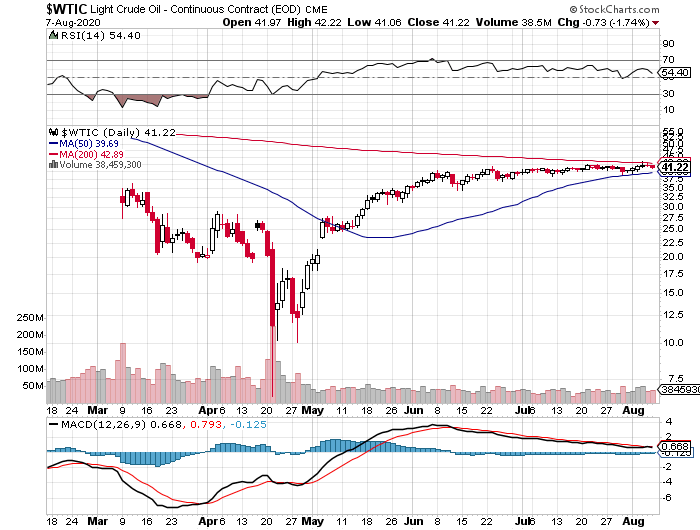
Here are the 6-month charts for the Big 6 commodities, thanks to stockcharts.com -- and I've already discussed the damage wrought by 'da boyz' in precious metals. They also beat the living snot out of copper as well, closing it lower by 12 cents. WTIC continues to trade very unnaturally sideways -- and it was closed down by 73 cents a barrel on Friday. Click to enlarge.
|
|
|
|
|
|
|
|
|
|
|
|
To say that the world's economic, financial and monetary systems are are now broken beyond repair, would be an understatement. There's nobody out there in the circles that you and I travel in, that doesn't know that if it wasn't for Wiemar-style money printing by the world's central banks, especially those in the U.S. and China, the world would have been a smouldering ruin decades ago.
I'm not going to wax philosophically on what may or may not happen going forward, as I don't wish to reinvent the wheel in today column. But my thoughts are unchanged -- and if you wish to review them, you can read The Wrap section of my column from two weeks ago -- and linked here.
As I've stated before, as have many others in the public domain, the hallucination that passes for a financial and monetary system for our entire adult lives, is on its very last legs -- and the general population, having been become the proverbial frogs in the near-boiling water, will be swept away when the reset comes...whether it be next week, next month...or next year.
All I'm on high alert about now is what event will happen either by design or circumstance that will be allowed set off the final denouement.
I'm also watching the flows of physical metal into the world's mutual funds and ETFs, which continues unabated -- and at a rabid pace. The amount of silver and gold going into these funds continues to outpace world mining production -- and the amount of silver that JPMorgan has been ordered to part with, or is prepared to sell, is finite. The same can be said of how much unallocated gold there is available in London, as that's most certainly the source for a large percentage of the gold that's vanishing into these mutual funds and ETFs.
And having worked in the retail bullion business for four years, I'm tied into what's happening on that level. There is virtually nothing available for immediate delivery at any of the major retail stores in the U.S. or Canada. Delivery times are weeks or months -- and I'll go on record as stating that this state of affairs is now permanent.
At all levels that I'm aware of, the precious metals world is running out of road.
I'm still "all in" -- and I'll see you here on Tuesday.
Ed
About the author
