
Read the article in full on SilverSeek.com
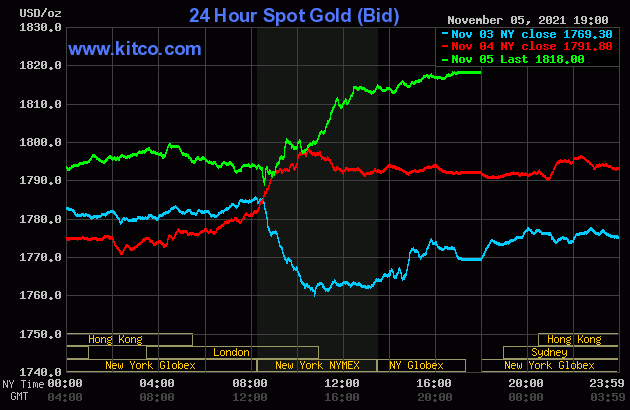
The gold price didn't do much until around 9 a.m. China Standard Time on their Friday morning -- and from that point it began to head a bit higher. That lasted until around 8:25 a.m. in London -- and it was then sold quietly lower until its spike low tick was set around 8:30 a.m. in New York. A serious rally began at that juncture -- and that lasted until 12:30 p.m. EDT. From there it continued to creep quietly higher until the market closed at 5:00 p.m.
The low and high ticks were recorded by the CME Group as $1,785.30 and $1,820.10 in the December contract. The December/February price spread differential in gold at the close yesterday was $2.20...February/April was $1.60 -- and April/June was only $1.40 an ounce.
Gold finished the Friday session in New York at $1,818.00 spot, up $26.20 from Thursday's close. Net volume was extremely heavy at a bit over 242,000 contracts -- and there was a hefty 72,500 contracts worth of roll-over/switch volume out of December and into future months...mostly February.
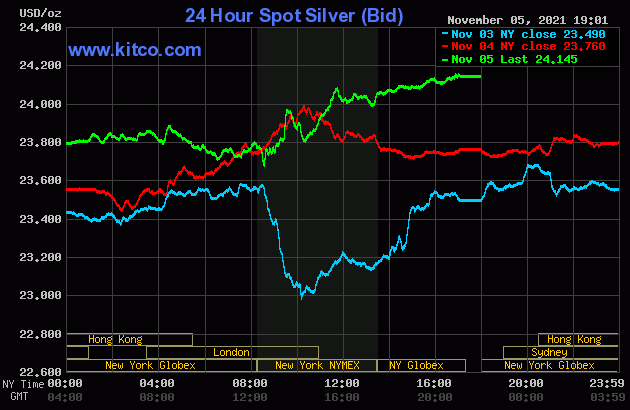
For all intents and purposes, the price action in silver was mostly similar to gold's, at least up until its 8:31 a.m. low tick was set in New York on Friday morning. But its rally from there ran into a fair amount of resistance -- and ended around 11:40 a.m. in COMEX trading...about an hour before the gold price got stepped on. Also like gold, it continued to creep higher until the market closed at 5:00 p.m. EDT.
The low and high ticks in silver were reported as $23.665 and $24.255 in the December contract. The December/March price spread differential in silver at the close yesterday was 4.9 cents...March/May was 3.3 cents -- and May/July was 3.4 cents an ounce.
Silver finished the Friday session in New York at $24.145 spot, up 38.5 cents on the day and, like gold, almost on its high tick. Net volume was a bit elevated at a bit over 54,500 contracts -- and there was a very hefty 22,500 contracts worth of roll-over/switch volume out of December and into future months...mostly March.
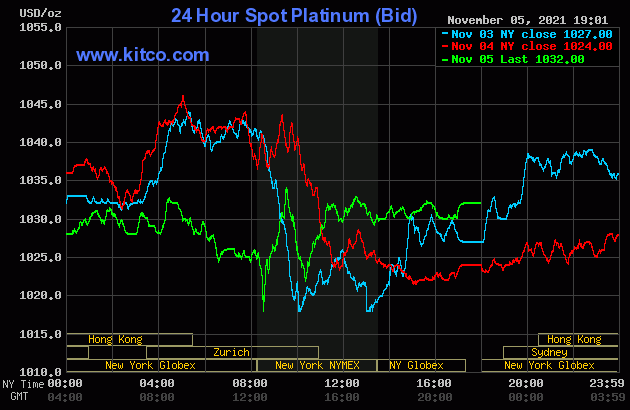
The platinum price wandered higher until, like silver and gold, ran into 'something' around 9:25 a.m. in Zurich. It was sold lower from there -- and its spike low tick also came a minute after 8:30 a.m. in New York. It then had a pretty vicious up/down/up move that ended about fifteen minutes after 11 a.m. EDT Zurich close. After that, its price chopped quietly sideways until trading ended at 5:00 p.m. EDT. Platinum was closed at $1,032 spot, up 8 dollars on the day.
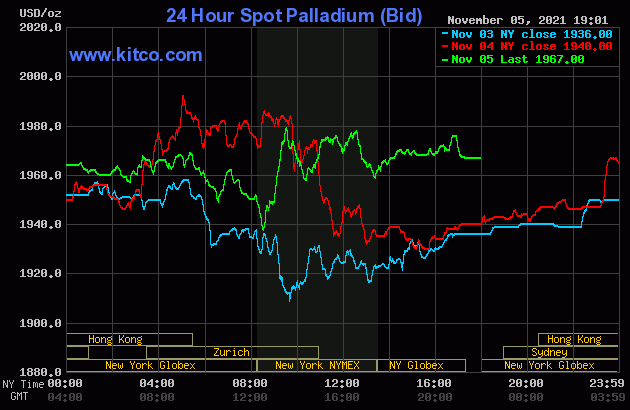
Palladium edged higher until very shortly after 11 a.m. China Standard Time on their Friday morning -- and it then jumped up a bunch. It wandered quietly sideways from there until shortly before 10:30 a.m. in Zurich -- and like the other three precious metals was sold lower until around 8:30 a.m. in New York...its low tick of the day. Its ensuing rally got capped and turned lower around 9:30 a.m. EDT -- and it wandered quietly and unevenly sideways until trading ended at 5:00 p.m. Palladium was closed at $1,967 spot, up 27 bucks from Thursday.
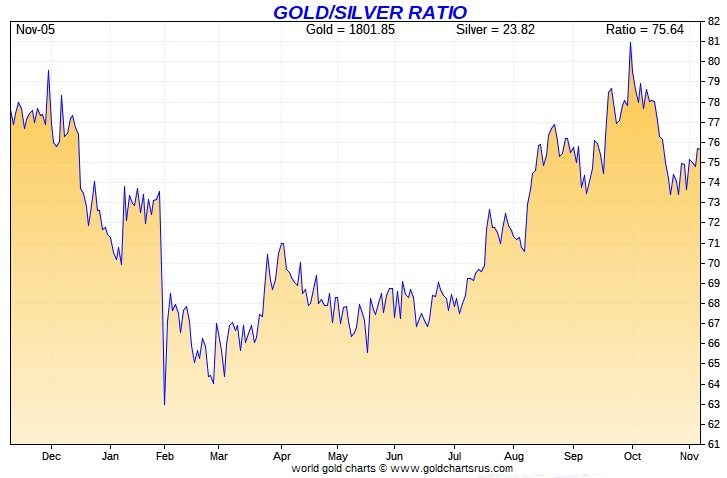
Based on the kitco.com spot closing prices in silver and gold posted above, the gold/silver ratio worked out to 75.3 to 1 on Friday...compared to 75.4 to 1 on Thursday.
Here's Nick's 1-year Gold/Silver Ratio chart, updated with the last five days of data. Click to enlarge.
![]()
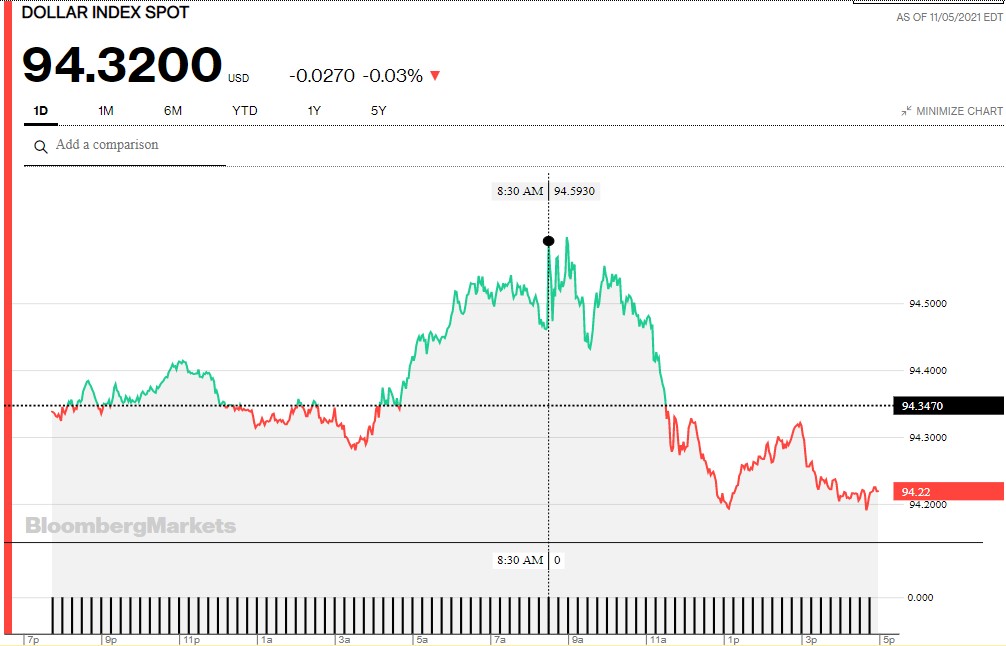
The dollar index closed very late on Thursday afternoon in New York at 94.347 -- and opened higher by 1 basis point once trading commenced around 7:45 p.m. EDT on Thursday evening, which was 7:45 a.m. China Standard Time on their Friday morning. It rallied a bit until 11:05 a.m. CST -- and then crept quietly lower until 3:25 p.m. CST. Its 'rally' from there topped out at 8:30 a.m. in New York -- and about thirty minutes later, began to head lower. The low tick was set at 1:08 p.m. -- and from that juncture it had a quiet up/down move going into the 5:00 p.m. EDT close.
The dollar index finished the Friday trading session at 94.320...down about 3 basis points from its close on Thursday...but a full 10 basis points above its indicated spot close on the DXY chart below. One has to wonder what that was about.
Here's the DXY chart for Friday, thanks to Bloomberg as always -- and the above discrepancy should be duly noted. Click to enlarge.
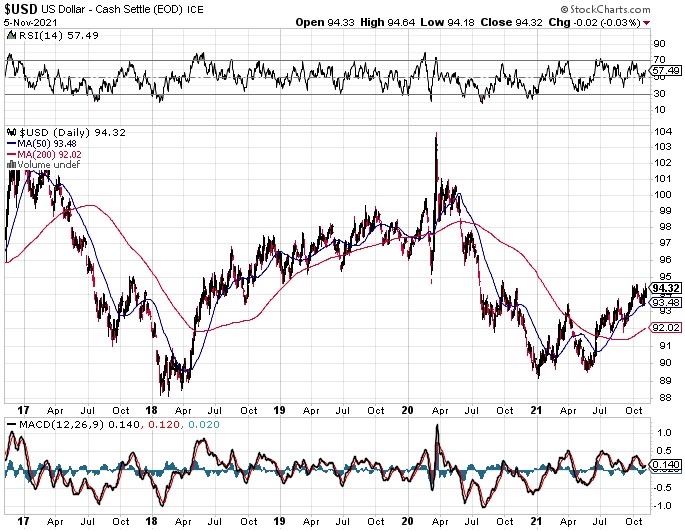
And here's the 5-year U.S. dollar index chart that appears in this spot in every Saturday column...thanks to stockcharts.com as always. The delta between its close...94.32...and the close on the DXY chart above, was basically nothing at all from its spot close on Friday. Click to enlarge as well.
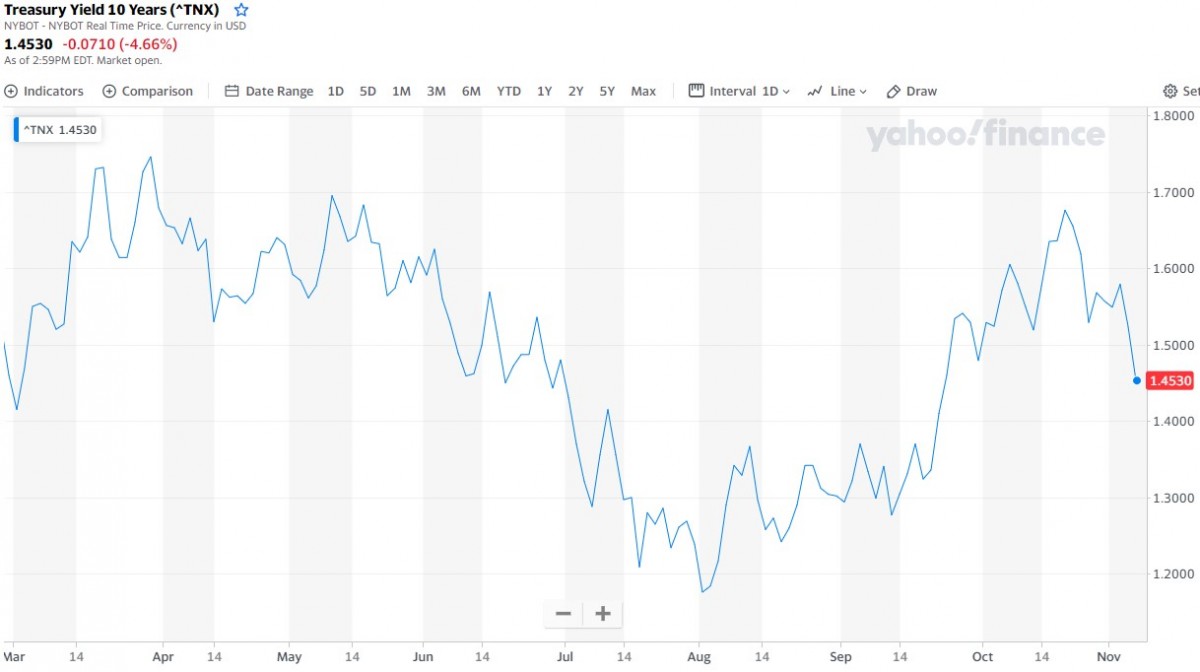
U.S. 10-Year Treasury: 1.4530%...down 0.0710 (-4.66%)...as of 2:59 p.m. EDT.
Here's the one-year 10-year U.S. Treasury chart, courtesy of yahoo.com as always -- and as I keep pointing out, you can see where the Fed began yield curve control in March. That upward bias that started at the beginning of August, became far more pronounced starting on September 21.
However, looking at the chart below -- and as I said in this space last week, I'm wondering if the peak in the yield was capped on October 20...its very recent high tick, as the trend has been mostly lower since -- and accelerated further this past week. Click to enlarge.
![]()
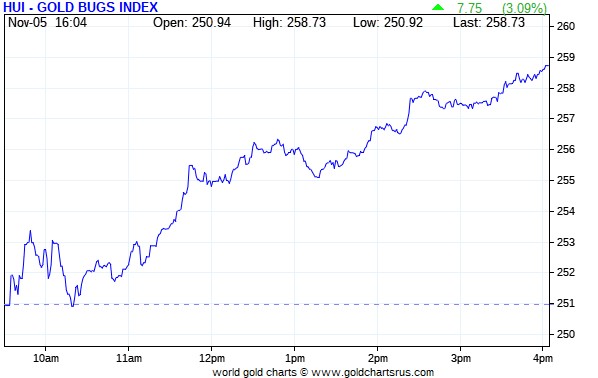
The gold stocks had a brief up/down move starting at the 9:30 open in New York yesterday morning -- and that lasted until around 10:15 a.m. EDT. From there, it was onwards and ever upwards until the market closed at 4:00 p.m. The HUI closed higher by 3.09 percent.
The silver equities traded a mostly similar fashion, except for a two hour chop sideways starting around 11:45 a.m. in New York trading. Because of that, Nick Laird's Intraday Silver Sentiment/Silver 7 Index only closed up 2.62 percent...not helped by the underperformance of Peñoles. Click to enlarge if necessary.
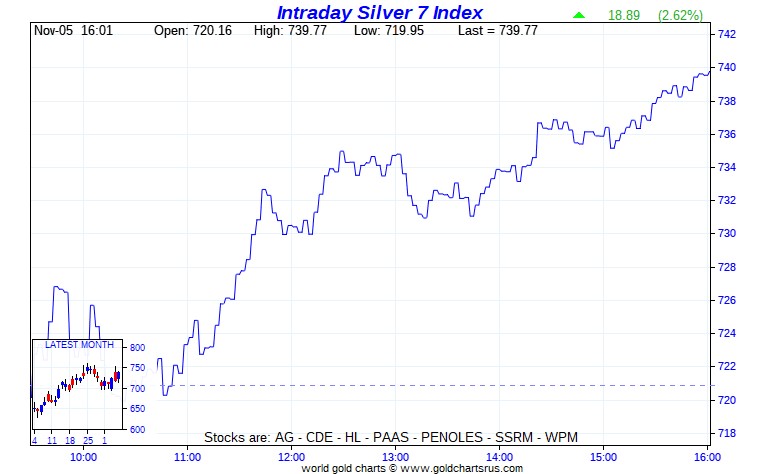
Computed manually, the above index closed higher by 2.78 percent.
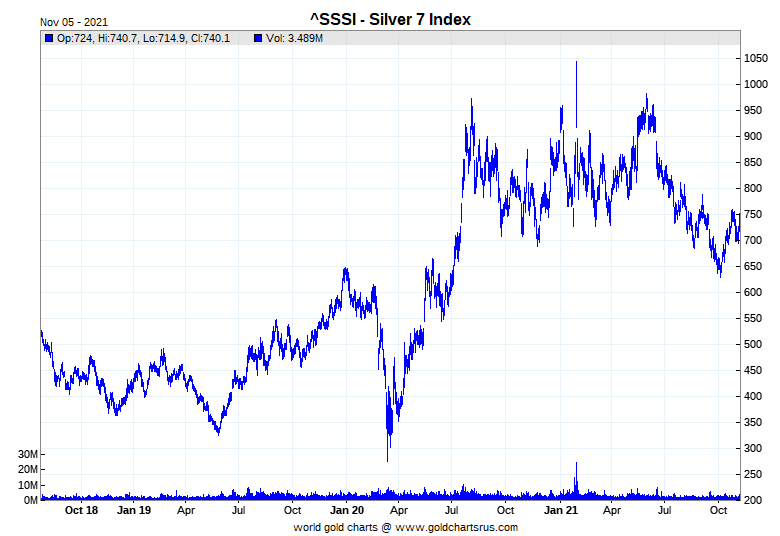
And here's Nick's 3-year Silver Sentiment/Silver 7 Index chart, updated with Friday's candle. Click to enlarge as well.
The star was First Majestic Silver, as it closed higher by 5.84 percent -- and not far behind was Hecla Mining, closing up 5.09 percent. The aforesaid mentioned Peñoles was the dog of the day, as it closed down 1.27 percent on very decent volume for it.
Yesterday was the big scheduled raid in the physical market by the 'apes' over at the reddit.com/Wallstreetsilver website -- and they were a busy bunch. There's lot of silver eye candy for you today -- and that's linked here.
![]()
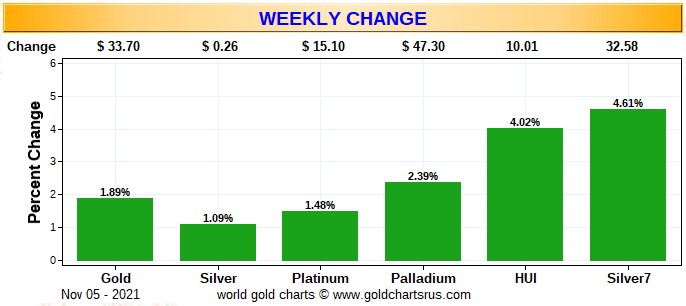
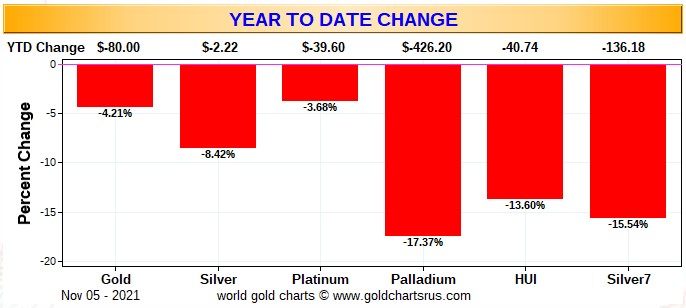
Here are two of the usual three charts that show up in every Saturday missive. They show the changes in gold, silver, platinum and palladium in both percent and dollar and cents terms, as of their Friday closes in New York — along with the changes in the HUI and the Silver 7 Index.
Here's the weekly chart, which doubles as the month-to-date chart for this week only -- and from wall-to-wall red last week, it's wall-to-wall green this week. The silver equities are back to outperforming their golden cousins -- and this week by a wide margin. Click to enlarge.
Here's the year-to-date chart -- and it's still wall-to-wall ugly. The silver equities...although underperforming the most...are doing better than the gold stocks vs. their respective underlying precious metals. And when silver is finally allowed to trade freely, it and its associated equities, will bury everything gold related. Click to enlarge.
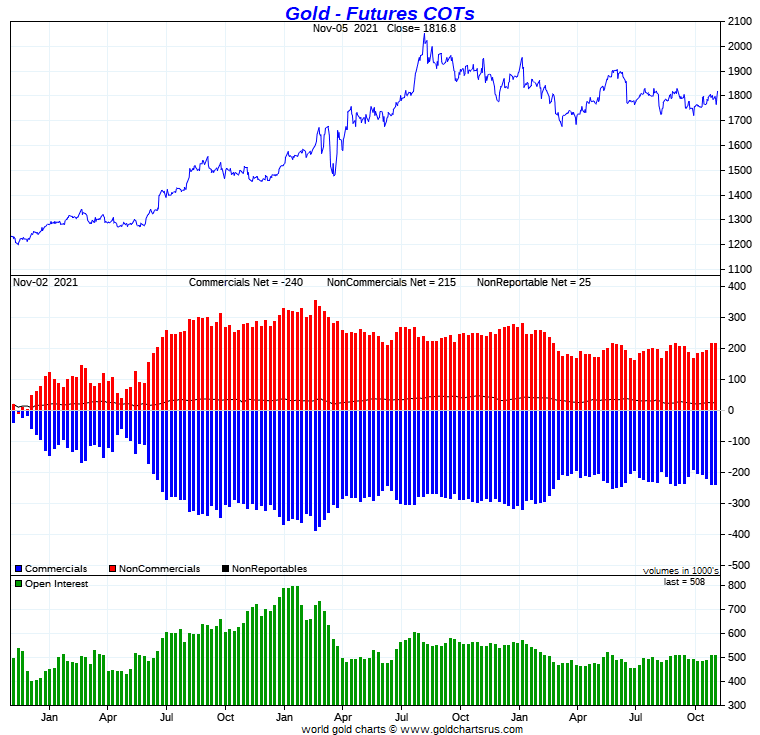
As Ted Butler has mentioned on many occasions, the short positions of the Big 4/8traders are the sole reason that precious metal prices aren't at the moon already, as every other group of traders in the COMEX futures market, including most of the rest of the commercial traders, are net long against them.
In the COT discussion further down, the commercial net short position in silver decreased by a bit, but the commercial net short position in gold increased, but only by a hair.
The Big 8 commercial traders overall have made little progress in their attempts to reduce their monstrous short position in gold, silver and platinum. They're certainly down from their highs of earlier this year, but they still remain obscene and grotesque nonetheless. They increased their short position in silver by a bit, but reduced it in gold by a bit during this reporting week...however not by any amount that really mattered. It's a good bet that they've added to their short positions in both because of the rallies on Thursday and Friday.
The CME Daily Delivery Report showed that 1 gold and 13 silver contracts were posted for delivery within the COMEX-approved depositories on Tuesday.
In gold, the lone short/issuer was Stonex Financial -- and JPMorgan stopped it. Both transactions involved their respective client accounts.
In silver, the lone short/issuer there was Advantage -- and the lone long/stopper was ADM. Like in gold, both transactions involved their respective client accounts.
The link to yesterday's Issuers and Stoppers Report is here.
Month-to-date November deliveries in gold and silver are 559 and 922 COMEX contracts respectively.
The CME Preliminary Report for the Friday trading session showed that gold open interest in November increased by 197 COMEX contracts, leaving 580 still open, minus the 1 contract mentioned a few paragraphs ago. Thursday's Daily Delivery Report showed that 2 gold contracts were actually posted for delivery on Monday, so that means that 197+2=199 more gold contracts were added to the November delivery month. Silver o.i. in November increased by 21 contracts, leaving 49 still around, minus the 13 mentioned a few paragraphs ago. Thursday's Daily Delivery Report showed that zero silver contracts were posted for delivery on Monday, so that obviously means that 21 more silver contacts jut got added to November.
Total gold open interest at the close yesterday exploded by 32,751 COMEX contracts, a very depressing number -- and I'm hoping/praying that it's spread related. Total silver o.i. only rose by only 1,862 contracts...a number I was happy to see.
Much to my surprise, there were no reported changes in GLD -- and an even bigger surprise was that there was 509,010 troy ounces of silver removed from SLV. However, it may have represented an exchange of SLV shares for physical. I'll be interested in what Ted has to say about this.
In other gold and silver ETFs and mutual funds on Planet Earth on Friday, net of any changes in COMEX, GLD & SLV inventories, there was a net 77,853 troy ounces of gold taken out, but a net 586,673 troy ounces of silver was added...all into iShares/SVR and Deutsche Bank.
There was no sales report from the U.S. Mint yesterday.
Month-to-date, if the numbers can be trusted, the mint has sold 20,000 troy ounces of gold eagles -- 474,500 silver eagles -- and 7,900 one-ounce platinum eagles. The sales numbers on the mint's gold buffalo page still shows eagle sales only for the entire year -- a no gold buffalo sales at all. This is getting weirder by the day.
In my phone call with Ted yesterday, he reiterated his opinion that the mint is definitely withholding production/sales from the market in order not to exacerbate an already tight-as-a-drum wholesale market in physical silver.
I don't have the space for the charts in my column today, but "The Perth Mint sold 59,750 troy ounces of gold and 1,352,275 troy ounces of silver in minted product form during October."
The only physical activity in gold over at the COMEX-approved depositories on the U.S. east coast on Thursday was the 128.600 troy ounces/six kilobars that was shipped out of Brink's, Inc. There was no 'in' activity once again. There was a bit of paper activity, as 6,751.710 troy ounces/210 kilobars was transferred from the Registered category and back into Eligible over at HSBC USA. The link to this is here.
It was far busier in silver, as 1,394,605 troy ounces was reported received -- and 180,187 troy ounces was shipped out.
In the 'in' category, there were two truckloads...1,280,232 troy ounces...that were dropped off at Brink's, Inc. -- and the remaining 114,372 troy ounces ended up at CNT. All of the 'out' activity happened over at JPMorgan.
There was a bit of paper activity, as 54,071 troy ounces was transferred from the Registered category and back into Eligible over at Manfra, Tordella & Brookes, Inc. The link to all of the COMEX silver activity on Thursday is here.
It was also pretty busy over at the COMEX-approved gold kilobar depositories in Hong Kong on their Thursday. They reported receiving 3,158 of them -- and shipped out 2,000 kilobars. Except for the 150 kilobars that arrived at Loomis International, all of the remaining in/out activity took place at Brink's, Inc. as always. The link to that, in troy ounces, is here.
![]()
Here are the usual two 20-year charts that show up in this space every Saturday. They show the total amount of physical gold and silver held in all know depositories, ETFs and mutual funds as of the close of business on Friday.
For the week just past, there was a net 230,000 troy ounces of gold removed -- and in silver, there was a net 556,000 troy ounces of silver withdrawn as well. All of that silver number, plus a bit more, is a result of withdrawals/conversion or shares in SLV, or net withdrawals from the COMEX warehouses. The 'rest of the world' ETFs and mutual funds experienced small net inflows. Click to enlarge.
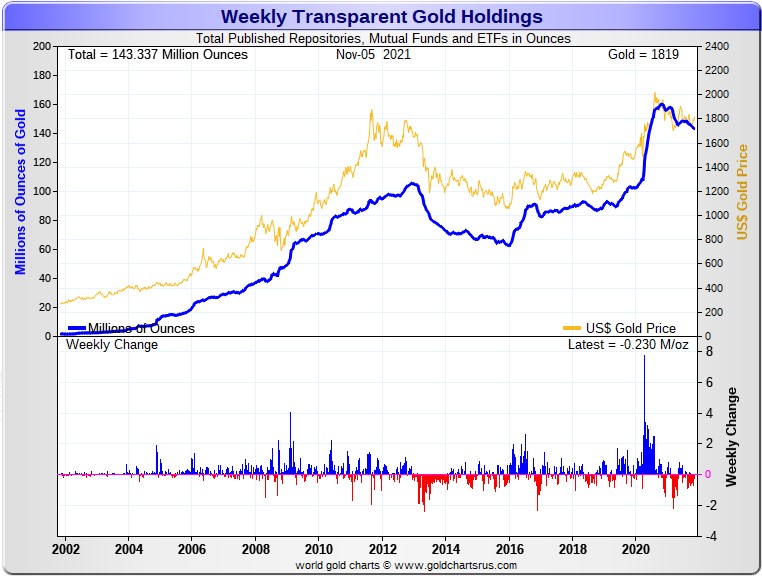
As I point out every week, looking at the above two charts, one would never know that eye-watering engineered price declines had ever occurred in silver and gold since mid June, although as time as gone along, you can see the sign of it in gold now, but it's not excessive. It's quite the opposite in silver.
And considering the price activity over that time period, the above charts continue to show how tightly held the physical precious metals are...especially silver -- and that's despite the punishment handed out by the Big 8 commercial shorts over the last five months or so.
As I'll never stop repeating, these two precious metals are being held by the strongest of hands...including ours.
![]()
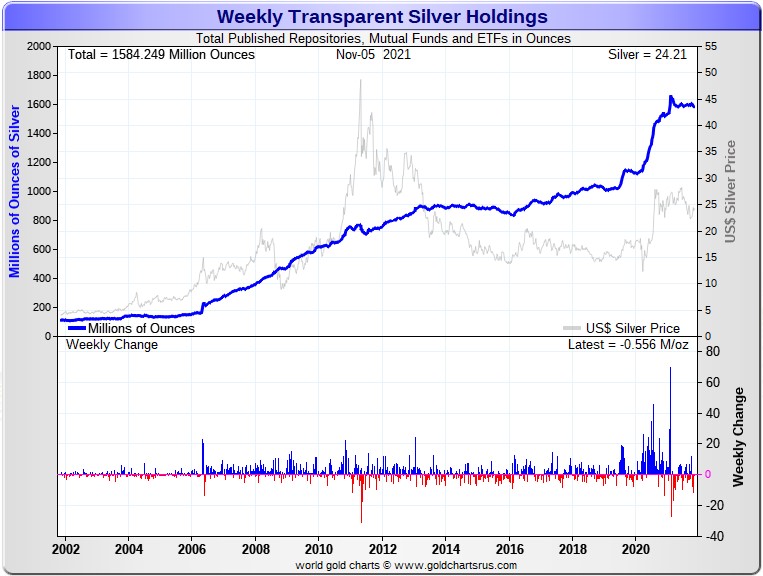
The Commitment of Traders Report, for positions held at the close of COMEX trading on Tuesday, showed the hoped for decline in the Commercial net short position in silver, but a tiny increase in the commercial net short position in gold.
In silver, the Commercial net short position decreased by 2,644 COMEX contracts, or 13.2 million troy ounces.
They arrived at that number by increasing their long position by 2,184 contracts -- and also reduced their short position by 460 contracts. It's the sum of those two numbers that represents their change for the reporting week.
Under the hood in the Disaggregated COT Report, it was all Managed Money traders -- and much more as, the decreased their net long position by 5,163 COMEX contracts.
Of course that meant that the other two groups of traders increased their net long positions during the reporting week -- and they did...the Other Reportables by 746 contracts -- and the Nonreportable/small traders by 1,773 contracts.
Doing the math: 5,163 minus 746 minus 1,773 equals 2,644 COMEX contracts, the change in the Commercial net short position, which it must do.
The Commercial net short position in silver now sits at 244.3 million troy ounces...down from the 257.5 million troy ounces that they were short in last week's COT Report.
The Big 8 are short 316.7 million troy ounces in this week's COT Report, up a bit from the 309.4 million troy ounces they were short in last week's COT Report...an increase of 7.3 million troy ounces worth, or 1,460 COMEX contracts.
But since the headline number showed an decrease in the short position of 13.2 million troy ounces, it was Ted's raptors, the small commercial traders other than the Big 8 that were that were the big buyers of long positions during the reporting week...to the tune of 13.2 plus 7.3 equals 20.5 million troy ounces.
Don't forget that despite their small size, Ted's raptors are still commercial traders in the commercial category -- and their buying of long positions during this past reporting week had the mathematical effect of decreasing the Commercial net short position.
There's much more on this in the 'Days to Cover' discussion further down.
The Big 8 are short 316.7/244.3 equals about 130 percent of the Commercial net short position, compared to the 120 percent they were short in last week's COT Report.
Here's the 3-year COT chart for silver, courtesy of Nick Laird as always and the change is worth noting. Click to enlarge.
I certainly wasn't happy to see that increase in the short position of the Big 8 traders during the reporting week -- and also suspect that it has increased even more since the Tuesday cut-off.
In gold, the commercial net short position actually increased during the reporting week, but by an insignificant 223 COMEX contracts, or 22,300 troy ounces.
They arrived at that number by reducing their long position by 2,731 contracts -- and also reduced their short position by 2,508 contracts. It's the difference between those two numbers that represents their change for the reporting week.
With such a small change in the headline number, the changes under the hood in the Disaggregated COT Report weren't overly large, either.
The Managed Money Traders decreased their net long position by 1,123 COMEX contracts, as the did the traders in the Nonreportable/small traders category...them by 346 contracts. The traders in the Other Reportables category obviously increased their net long position during the reporting week -- and they did so to the tune of 1,692 contracts.
Doing the math: 1,692 minus 1,123 minus 346 equals 223 COMEX contracts, the change in the commercial net short position.
The commercial net short position in gold now sits at 23.99 million troy ounces, up an insignificant amount from the 23.97 million troy ounces they were short in last week's COT Report.
The short position of the Big 8 traders is 23.00 million troy ounces, down 140,000 troy ounces from the 23.14 million troy ounces they were short in last week's COT Report, which is not a very big decrease at all.
But the headline commercial net short position increased by 22,300 troy ounces, so that means that Ted's raptors, the small commercial traders other than the Big 8, had to have sold 140,000 plus 22,300 troy ounces equals 163,300 troy ounces/1,633 COMEX contracts to make these numbers balance -- and that's what they did.
Their selling had the mathematical effect of increasing the commercial net short position.
Don't forget that, like in silver, despite their small size, Ted's raptors are still commercial traders in the commercial category.
From the above numbers, the Big 8 traders are short 23.00/23.99=96 percent of the commercial net short position in gold...down from the 97 percent they were net short in last week's COT Report, which means that Ted's raptors are net short gold by a tiny bit for the second week in a row.
Here's Nick Laird's 3-year COT chart for gold, updated with Friday's data -- and the change is microscopic. Click to enlarge.
Ted said that the encouraging thing about this week's COT Report in gold is that the Big 4 shorts reduced their short position by a decent amount. But on the other side of the coin, the Big 5-8 traders actually increased their net short position in gold by a bit.
Of course after the last two big up days in gold, I'm sure that the Big 8 traders have returned to the short side, but that's speculation at the moment.
Ted's 'whale' on the long side in the Other Reportables category, which he believes is John Paulson, is still intact at around the 35,000 contract mark -- and because of that Ted says that the commercial net short position in gold should really be reduced by that amount, as this a long-term trade that he's got on. He's certainly well into the money on it already -- and I'm sure he's going to ride the rally for all its worth.
In the other metals, the Managed Money traders in palladium increased their net short position by a further 346 COMEX contracts during the last reporting week -- and are net short the palladium market by 2,873 COMEX contracts. Only the commercial traders in the Swap Dealer category are net long palladium at the moment. In platinum, the Managed Money traders increased their net long position by 1,233 contracts during the reporting week -- and are net long the COMEX futures market by 7,359 COMEX contracts. Only the commercial traders in the Producer/Merchant category are short platinum. In copper, the Managed Money traders decreased their net long position by a chunky 12,129 COMEX contracts -- and are net long copper by 34,940 COMEX contracts...about 874 million pounds of the stuff -- and about 16 percent of total open interest...down about 5 percentage points from last week. It was their selling that drove copper prices lower during the reporting week.
![]()
Here’s Nick Laird’s “Days to Cover” chart, updated with the COT data for positions held at the close of COMEX trading on Tuesday, November 2. It shows the days of world production that it would take to cover the short positions of the Big 4 — and Big '5 through 8' traders in each physically traded commodity on the COMEX.
I consider this to be the most important chart that shows up in the COT series -- and it deserves a minute of your time. Click to enlarge.
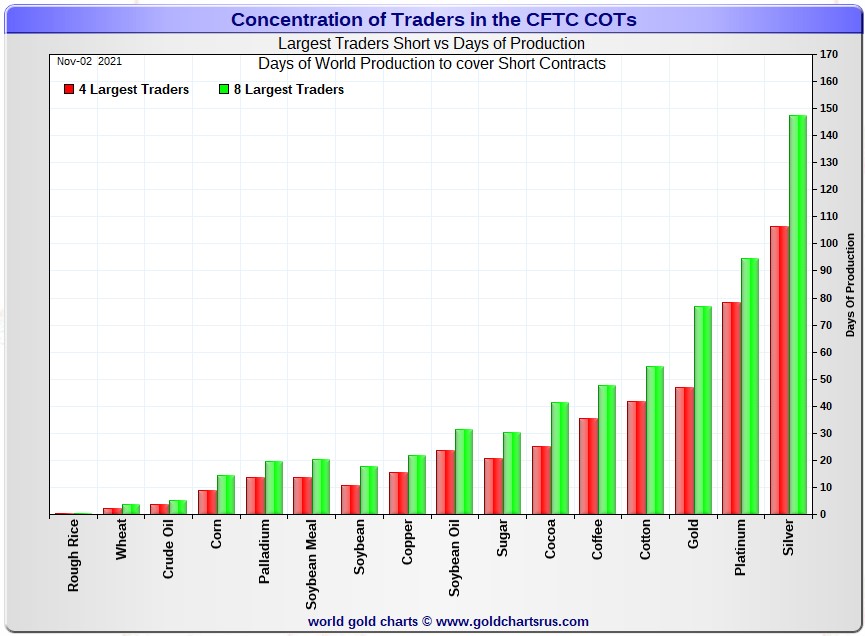
In this week's 'Days to Cover' chart, the Big 4 traders are short about 106 days of world silver production, up two days from last week's COT Report. The ‘5 through 8’ large traders are short an additional 41 days of world silver production, up one day from last week, for a total of about 147 days that the Big 8 are short, up about three days from last week's report. [In last week's COT Report, they were short 144 days of world production.]
That 147 days that the Big 8 are short, represents just about five months of world silver production, or 316.7 million troy ounces of paper silver held short by the Big 8.
In the COT Report above, the Commercial net short position in silver was reported by the CME Group at 244.3 million troy ounces. As mentioned in the previous paragraph, the short position of the Big 4/8 traders is 316.7 million troy ounces. So the short position of the Big 4/8 traders is larger than the total Commercial net short position by 316.7-244.3=72.4 million troy ounces...up 20.5 million troy ounces from the 51.9 million troy ounces in last week's report.
It was the raptor buying of that 20.5 million troy ounces/4,100 COMEX contracts that made up for most of the change in the commercial net short position in silver in the above COT Report.
The reason for the difference in those numbers two paragraphs ago...as it always is...is that Ted's raptors, the 28-odd small commercial traders other than the Big 8, are net long that amount...72.4 million troy ounces.
Another way of stating this [as I say every week in this spot] is that if you remove the Big 8 shorts from the commercial category, the remaining traders in the commercial category are net long the COMEX silver market. It's the Big 8 against everyone else...a situation that has existed for almost five decades in silver, platinum and palladium -- and for ten weeks in gold, except the last two.
As per the first paragraph above, the Big 4 traders in silver are short around 106 days of world silver production in total. That's about 26.5 days of world silver production each, on average...up a bit from last week's report. The four big traders in the '5 through 8' category are short 41 days of world silver production in total...a bit over 10 days of world silver production each on average -- and up a hair from last week's COT Report.
The Big 8 traders are short 44.8 percent of the entire open interest in silver in the COMEX futures market, which is up a bit from the 43.7 percent they were short in last week's COT report. And once whatever market-neutral spread trades are subtracted out, that percentage would be a bit over the 50 percent mark. In gold, it's 45.3 percent of the total COMEX open interest that the Big 8 are short, which is down an insignificant amount from the 45.4 percent they were short in last week's COT Report -- and also a bit over 50 percent mark once their market-neutral spread trades are subtracted out.
In gold, the Big 4 are short 47 days of world gold production, down one day from last week's report. The '5 through 8' are short 30 days of world production, unchanged from a week ago...for a total of 77 days of world gold production held short by the Big 8 -- and obviously down one day from last week's COT Report. Based on these numbers, the Big 4 in gold hold about 61 percent of the total short position held by the Big 8...down about one day from last week's report.
The "concentrated short position within a concentrated short position" in silver, platinum and palladium held by the Big 4 commercial traders are about 72, 83 and 70 percent respectively of the short positions held by the Big 8...the red and green bars on the above chart. Silver is about unchanged from last week...platinum is up 1 percentage point from a week ago -- and palladium is up about 2 percentage points week-over-week.
The Big 4/8 traders are still firmly stuck on the short side in both gold and silver -- and their short position increased a bit in this week's COT Report in silver -- and decreased a bit in gold. But it's pretty much a given that they've increased their short position in both since the Tuesday cut-off.
But that won't be known for sure until we see next Friday's COT Report -- and there are still two more trading days left in the reporting week.
The situation regarding the Big 4/8 shorts in silver, gold [and platinum] continues to be beyond obscene, twisted and grotesque -- and as Ted correctly points out ad nauseam, its resolution will be the sole determinant of precious metal prices going forward.
Nothing else matters.
![]()
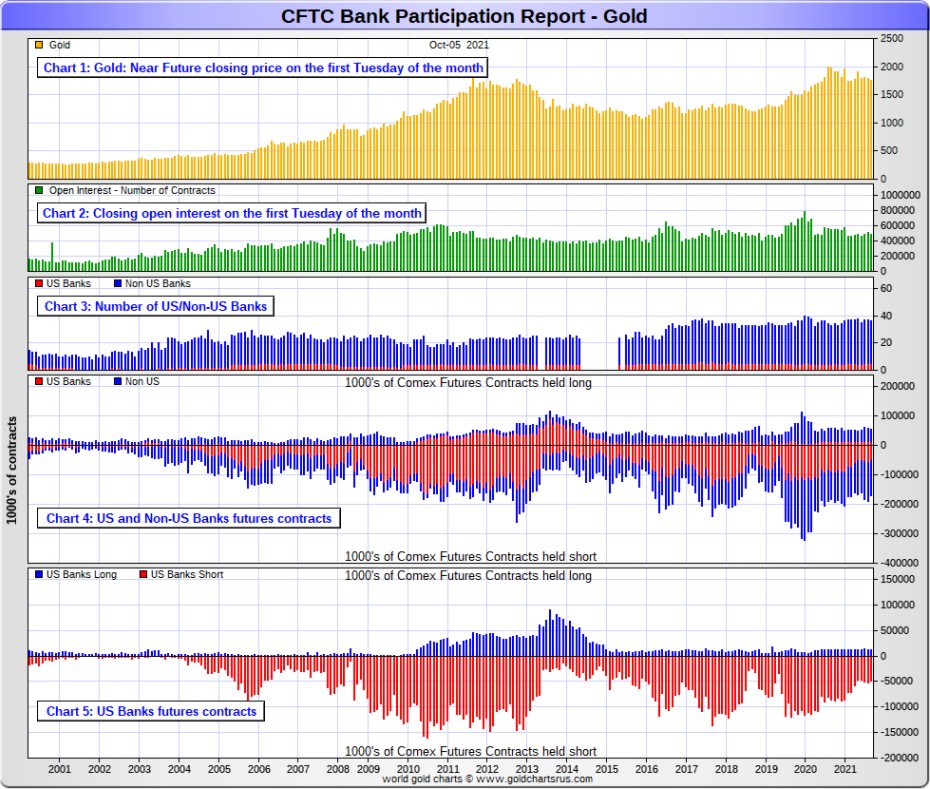
The November Bank Participation Report [BPR] data is extracted directly from yesterday's Commitment of Traders Report. It shows the number of futures contracts, both long and short, that are held by all the U.S. and non-U.S. banks as of Tuesday’s cut-off in all COMEX-traded products. For this one day a month we get to see what the world’s banks are up to in the precious metals. They’re usually up to quite a bit -- and they certainly were again this past month.
[The November Bank Participation Report covers the time period from October 5 to November 2 inclusive.]
In gold, 5 U.S. banks are net short 33,734 COMEX contracts in the November BPR. In October’s Bank Participation Report [BPR] these same 5 U.S. banks were net short 35,832 contracts, so there was a decrease of 2,098 COMEX contracts month over month.
This is the lowest short position in gold that the U.S. banks have held since March 2018.
Citigroup, HSBC USA, Bank of America and Morgan Stanley would most likely be the U.S. banks that are short this amount of gold. I still have my usual suspicions about the Exchange Stabilization Fund, although if they're involved, they are most likely just backstopping these banks.
Also in gold, 33 non-U.S. banks are net short 93,492 COMEX gold contracts. In October's BPR, 31 non-U.S. banks were net short 80,389 contracts...so the month-over-month change shows a big increase of 13,103 COMEX contracts. This is the largest short position in gold that the non-U.S. banks have held since March 2020.
At the low back in the August 2018 BPR...these same non-U.S. banks held a net short position in gold of only 1,960 contacts -- and they've been back on the short side in an enormous way ever since.
I suspect that there's at least three large banks in this group, HSBC, Barclays and Deutsche Bank. I also have my suspicions about Scotiabank/Scotia Capital, Dutch Bank ABN Amro, French bank BNP Paribas, plus Australia's Macquarie Futures as well. Other than that small handful, the short positions in gold held by the vast majority of non-U.S. banks are immaterial and, like in silver, have always been so.
As of this Bank Participation Report, 38 banks [both U.S. and foreign] are net short 24.1 percent of the entire open interest in gold in the COMEX futures market, which is exactly unchanged from the 24.1 percent that 36 banks were net short in the October BPR.
Here’s Nick’s BPR chart for gold going back to 2000. Charts #4 and #5 are the key ones here. Note the blow-out in the short positions of the non-U.S. banks [the blue bars in chart #4] when Scotiabank’s COMEX short position was outed by the CFTC in October of 2012. Click to enlarge.
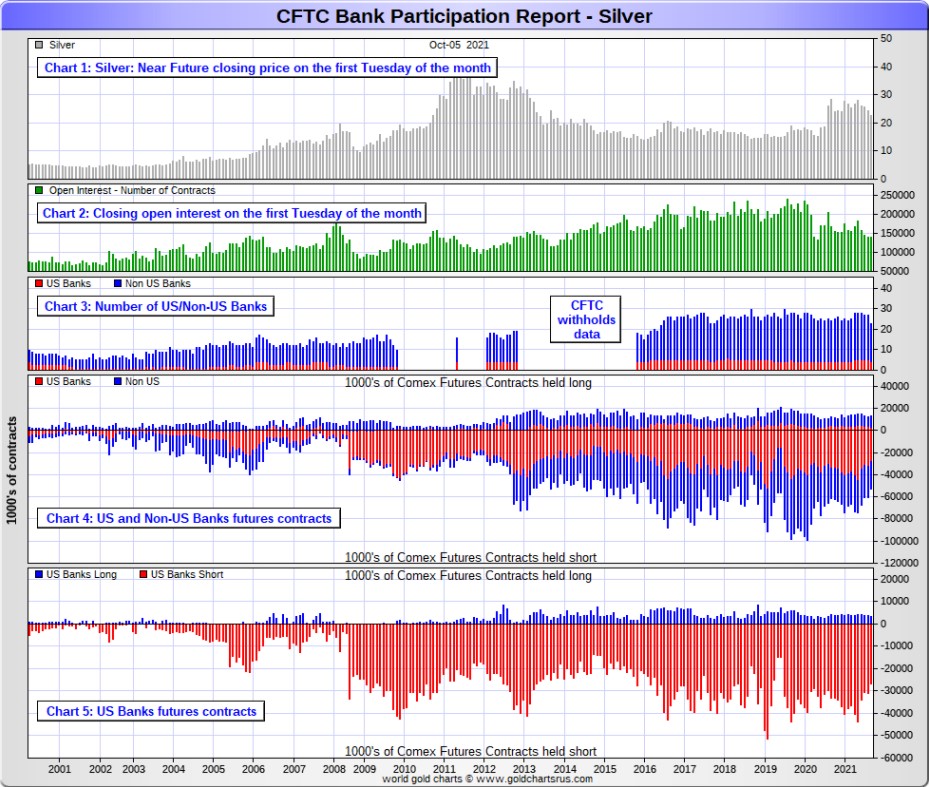
In silver, 4 U.S. banks are net short 27,646 COMEX contracts in November's BPR. In October's BPR, the net short position of 5 U.S. banks was 23,579 contracts, so the short position of the U.S. banks increased by 4,067 contracts month-over-month.
As in gold, the four biggest short holders in silver of the five U.S. banks in total, would be Citigroup, HSBC USA, Bank of America and most likely Morgan Stanley...and NOT Goldman Sachs. And, like in gold, I have my suspicions about the Exchange Stabilization Fund's role in all this...although, also like in gold, not directly.
Also in silver, 21 non-U.S. banks are net short 23,516 COMEX contracts in the November BPR...which is up a chunky 6,809 contracts from the 16,707 contracts that 19 non-U.S. banks were short in the October BPR.
I would suspect that HSBC and Barclays holds a goodly chunk of the short position of these non-U.S. banks...plus some by Canada's Scotiabank/Scotia Capital still. I'm not sure about Deutsche Bank. I also suspect that a number of the remaining non-U.S. banks may actually be net long the COMEX futures market in silver. But even if they aren’t, the remaining short positions divided up between these other 18 or so non-U.S. banks are immaterial — and have always been so.
As of November's Bank Participation Report, 25 banks [both U.S. and foreign] are net short 36.2 percent of the entire open interest in the COMEX futures market in silver—up a very decent amount from the 28.9 percent that 23 banks were net short in the October BPR. And much, much more than the lion’s share of that is held by Citigroup, HSBC, Bank of America, Barclays -- and Scotiabank -- and possibly one other non-U.S. bank...all of which are card-carrying members of the Big 8 shorts.
I'll point out here that Goldman Sachs has no derivatives in the COMEX futures market in any of the four precious metals.
Here’s the BPR chart for silver. Note in Chart #4 the blow-out in the non-U.S. bank short position [blue bars] in October of 2012 when Scotiabank was brought in from the cold. Also note August 2008 when JPMorgan took over the silver short position of Bear Stearns—the red bars. It’s very noticeable in Chart #4—and really stands out like the proverbial sore thumb it is in chart #5. But as of March of 2020...they're out of their short positions, not only in silver, but the other three precious metals as well. Click to enlarge.
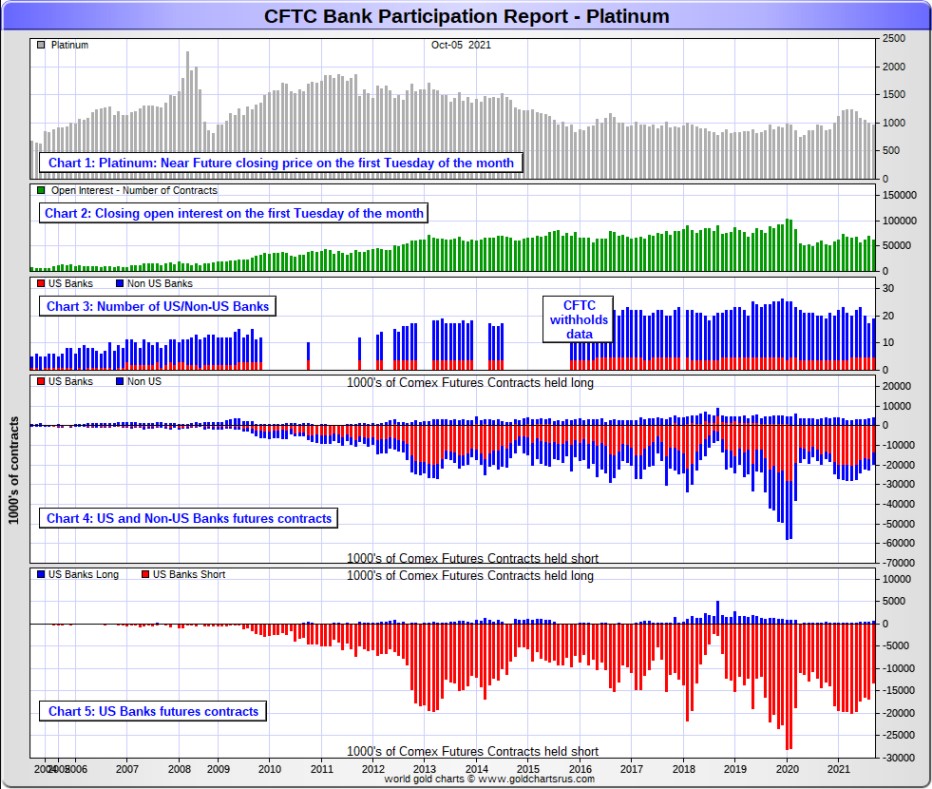
In platinum, 5 U.S. banks are net short 17,481 COMEX contracts in the November Bank Participation Report, which is up big from the 12,516 COMEX contracts that these same 5 U.S. banks were short in the October BPR.
[At the 'low' back in July of 2018, these U.S. banks were actually net long the platinum market by 2,573 contracts] So they have a long way to go to get back to just market neutral in platinum...if they ever intend to, that is.
Also in platinum, 16 non-U.S. banks are net short 3,911 COMEX contracts in the November BPR, which is up a bit from the 3,158 COMEX contracts that 14 non-U.S. banks were net short in the October BPR.
[Note: Back at the July 2018 low, these same non-U.S. banks were net short only 1,192 COMEX contracts.]
And as of November's Bank Participation Report, 21 banks [both U.S. and foreign] are net short 37.8 percent of platinum's total open interest in the COMEX futures market, which is up big from the 25.2 percent that 19 banks were net short in October's BPR.
But it's the U.S. banks that are on the short hook big time -- and the real price managers. They have little chance of delivering into their short positions, although a very large number of platinum contracts have already been delivered during the last 12 months or so. But that fact, like in both silver and gold, has made no difference whatsoever to their short positions held. The situation for them in this precious metal is as equally dire in the COMEX futures market as it is with the other two precious metals...silver and gold...particularly the former.
The reason that they'll never improve their short positions in a big way is the same reason as in gold and silver...the Managed Money traders flatly refuse to go short big time like they used to in the past...although they are net short around 10,000 COMEX contracts at the moment, which is not a large amount on an historical basis.
Here's the Bank Participation Report chart for platinum. Click to enlarge.
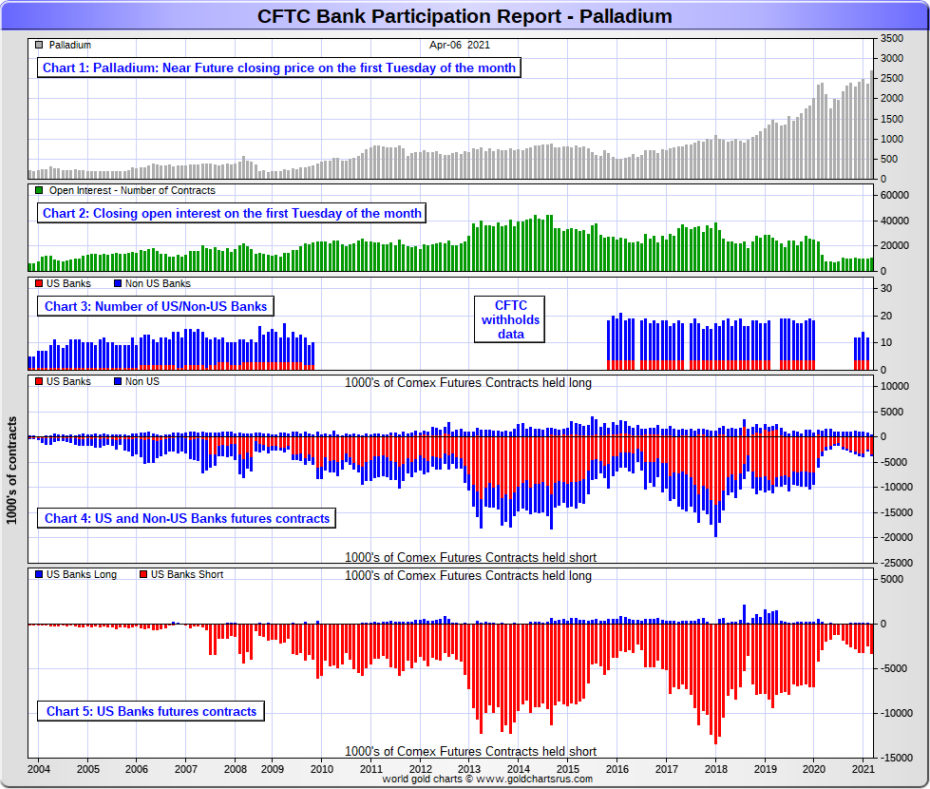
In palladium, '3 or less' U.S. banks are now net long 665 COMEX contracts in the November BPR, which is down a hair from the 706 contracts that these '3 or less' U.S. banks were net short in the October BPR.
Also in palladium, '9 or more' non-U.S. banks are net long 623 COMEX palladium contracts—up from the 600 contracts that these same '9 or more' non-U.S. banks were net long in the October BPR. These non-U.S. banks have been net long by a bit in palladium for the last twenty-two months in a row -- and have now been joined by the U.S. banks on the long side for the second month in a row.
And as I've been commenting for almost forever now, the COMEX futures market in palladium is a market in name only, because it's so illiquid and thinly-traded. Its total open interest at Tuesday's cut-off was only 10,926 contracts...compared to 56,508 contracts of total open interest in platinum...141,394 in silver -- and 507,616 COMEX contracts in gold.
As of this Bank Participation Report, 12 banks [both U.S. and foreign] are net long 11.8 percent of the entire COMEX open interest in palladium...compared to the 13.5 percent of total open interest that these same 12 banks were net long in October's BPR.
And because of the small numbers of contracts involved, along with a tiny open interest, these numbers are pretty much meaningless.
But, having said that, for the last twenty-two months in a row, the world's banks have not been involved in the palladium market in a material way -- and for the second month in a row, they are now net long in unison in this precious metal.
Here’s the palladium BPR chart. Although the world's banks are now net long, it remains to be seen if they return as big short sellers again at some point like they've done in the past. Click to enlarge.
Excluding palladium now -- and for obvious reasons, only a small handful of the world's banks/investment houses, most likely four or so in total -- and mostly U.S-based, except for HSBC, Barclays and maybe Deutsche Bank...continue to have meaningful short positions in the other three precious metals. It's a near certainty that they run this price management scheme from within their own in-house/proprietary trading desks...although it's pretty much a given that their clients are short these metals as well.
The futures positions in silver and gold that JPMorgan holds are immaterial -- and have been since March of last year. It's the new 7+1 shorts et al. that are on the hook in everything precious metals-related.
And as has been the case for over a year now, the short positions held by the Big 4/8 traders/banks is the only thing that matters -- and how it is ultimately resolved [as Ted said earlier] will be the sole determinant of precious metal prices going forward.
The Big 8 shorts continue to have an iron grip on precious metal prices -- and that grip grew even tighter in gold, silver and platinum in the above Bank Participation Report, as the Big 8 are mostly banks.
That situation will persist until they either voluntarily give it up...or are told to step aside, as it now appears that there's no chance that they will ever get overrun. If that possibility had ever existed in reality, it would have happened already. However, considering the current circumstances, I suppose one shouldn't rule it out entirely.
I have a very decent number of stories, articles and videos for you today.
![]()
CRITICAL READS
....
About the author
