On October 28, I wrote that “GDP Stands for One “GROSS Domestic Pig During Election Season.” I claimed the report for GDP was an outright lie. There is no other way to see it. Since then, I have hoped to see others call the Bureau of Economic Analysis out for its lie, but they have not — not even in the alternative press. Yet, the lie is so gross as to be obvious.
Now, I’m going to dissect the pig to fully reveal the lie. I stated in that last article that the lie was the inflation number used to back inflation out of Gross Domestic Product (GDP) because the intent of GDP is to measure actual production levels, not the impact of price changes. The inflation rate used, I said was hogwash:
a deflator of 4.1% is clearly not enough to take the price effect out of GDP, given that all we are supposed to be measuring is actual production in steady dollars, not the effect of price changes.
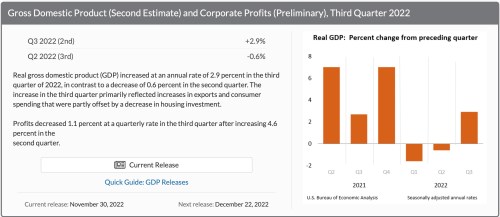
The BEA reported that GDP for each quarter this year looked like this:
You can readily see the two quarters of recession followed by the quarter of monster-pig lies. The sudden leap in third quarter GDP was due reportedly to a major reduction in inflation, glossed over, of course. (We all know that didn’t happen, but I’ll lay it out.) The BEA claims it uses the Personal Consumption Expenditures Index (PCE) for its inflation rate. It lied.
Period.
It grossly manipulated the number. It doesn’t say how it adjusted it, but it did … a lot! Perhaps that is why they call it “gross domestic product.”
In their latest revised numbers (over those I used in the article quoted,) the BEA stated,
The PCE price index increased 4.3 percent…. Excluding food and energy prices, the PCE price index increased 4.6 percent….
Balderdash!
First, let me note that even mentioning the exclusion of food and energy is wrong. Food and energy are both fully included in GDP as major contributors to domestic production. So, you CANNOT exclude the inflation on food and energy if you are trying to factor the impact of inflation out “Real Gross Domestic Production” in order to measure the actual change in production and not simply the changes in the prices of things produced. There is no reason to even mention excluding those items from the “deflator” UNLESS you are also excluding them from the GDP you are “deflating.” It’s ludicrous.
They shouldn’t be using PCE anyway, but they like to use it because it routinely underestimates actual inflation even more than CPI (Consumer Price Index) underestimates it (as I’ll show at the end of this article). Even CPI grossly underestimates inflation due to how it calculates housing prices by the best guesses made by owners on what these largely uninformed people think their houses would rent for, not what they know their house is actually costing them. (And I’ll show that at the end, too.) PCE is a more manipulated and massaged number than CPI, which the BEA prefers because the extra massaging typically manages to get inflation lower.
Regardless, the PCE number they used was a blatant lie!
Let’s prove the lie
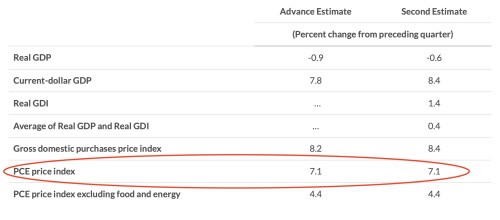
Here is the actual PCE number used in the second quarter, according to the BEA’s own data:
In their notes for the second quarter (to compare to exactly the same line of info quoted above for the third quarter) the BEA reports using the following PCE rate as their deflator (by which they mean how much they deflate GDP to get inflation back out):
The personal consumption expenditures (PCE) price index increased 7.1 percent
Same line of the report. That is the number they used in the second quarter. So, they grossly adjusted their own claimed gross-domestic-product PCE number for the third quarter down from the number they used in the second quarter with no explanation as to why. Based on their own methodology for manipulating the numbers — whatever that may be — they cut the applied rate of 7.1% inflation for the second quarter over the same quarter a year prior down to 4.3% for the third quarter over the same quarter a year prior. That is a 40% drop in the inflation rate being applied! Is there anyone willing to believe we had 40% less inflation year-over-year in the third quarter than we did in the second?
This change should have screamed “fraud” to anyone based on personal experience and any level of reading about the economy. We all know there is no way annualized inflation stepped down 40% from the second quarter to the third! It is ludicrous at face value alone. My point is not that we should go by personal experience or face value, but that the discrepancy should have immediately caught any financial writer’s attention to say, “Whoa, that can’t be right!” and to dig into it.
So, dig further into it I shall, since no one else is.
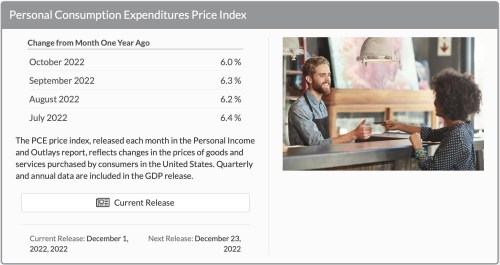
First, let’s show how the PCE rate they report using for deflating GDP does not even come close to the PCE rate of inflation they report in their own numbers elsewhere. To do this, look at what the BEA, itself, reported for year-on-year PCE inflation for each of the months of the third quarter:
Do the math. How do you average the YoY numbers stated there for July through September to come up with a quarterly rate of 4.3%? Clearly the BEA’s rate for the full quarter is 2 full points lower than the rate of the months that make up the quarter. How can the sum be less than the parts?
If you were starting to think maybe the year-on-year difference was due to some major anomaly in the third quarter of 2021, that anomaly would also have to show up as a big jolt in, at least, one of the months of 2022. Yet, each of those months looks reasonably within keeping of the 7.1% quarterly rate the BEA used for the second quarter and nothing like the rate they are using for the quarter that contains those months! There is no single month that plunged so severely it could have brought the full quarter YoY comparison down by 2.8 percentage points. ALL months would have to be down by an average of that much from the year before for the full quarter to be down that much from the year before! It’s simple math!
So, the BEA’s monthly numbers scream that their quarterly number is lying.
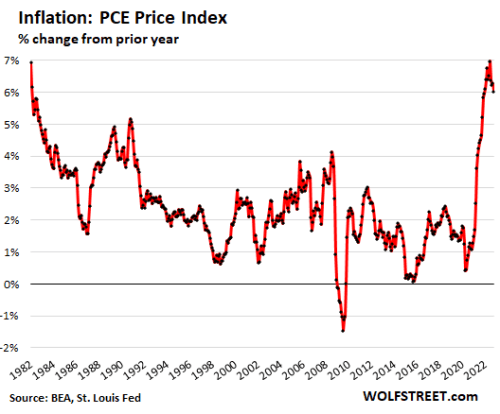
Now let’s look at another graph from an independent source:
Do you see anything in that graph of 2022 PCE Price Index numbers — the number the BEA claims it used to adjust gross domestic product for inflation — that looks even REMOTELY like 4.3%? I see numbers that look like the monthly numbers quoted by the BEA in their MONTHLY statistics for year-on-year comparisons. But I don’t see anything in these year-on-year numbers that would bring what they claim is a year-on-year comparison for the third quarter down to 4.3%! That would be quite the plunge!
So, there is simply no way that is an honest number. Not even close. Yet, no one is questioning why the BEA only reduced its raw annualized “REAL GDP” numbers by 4.3% to factor out the effects of inflation.
All right. Let’s look at another graph that you would certainly expect to be in line with the BEA — the Fed’s graph of PCE:
The numbers in the FED’s graph of PCE doesn’t match ANY of the numbers reported for PCE by the BEA on its GDP pages. The lowest month of the third quarter (September) on the Fed’s graph is at 8.36%. Now that alines with what we have been hearing about inflation all along, and the graph clearly states this is the PCE number. Interestingly the Fed says its own source for the numbers is the very same BEA! And, since the real number for the full quarter was higher than 8.36%, then the BEA understated inflation by almost 50!
Yet, the BEA feels no need whatsoever to explain on its GDP reporting pages why it massaged its own PCE numbers so much over what it reported to the Fed. There is simply no LEGITIMATE justification for claiming the raw price data used for GDP only needed to be deflated by 4.3% to factor the effects of inflation out of a number that is supposed to be measuring production levels in steady dollars because inflation has nothing to do with production levels!
They didn’t adjust the second quarter’s numbers by that huge amount, though they still used inflation numbers that were certainly inadequate to factor out the true affect of inflation on the prices used to measure production.
What numbers should the BEA be using for REAL GDP?
CPI is another measure of inflation the BEA could be using — the number we are all most familiar with — to adjust the effects of inflation out of GDP to get to REAL GDP, but they NEVER use this one because PCE is more open to massaging in how it is calculated, and the BEA likes to report numbers it can massage. Here was CPI (blue line) and the tick that is one point from the end is September:
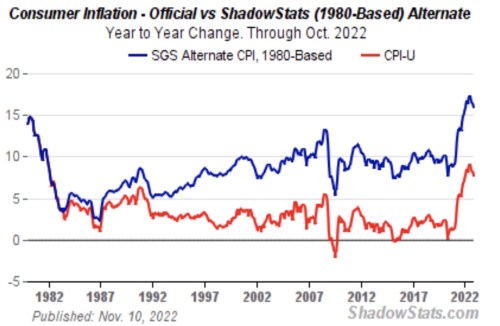
The inflation rate for September there was 8.2%, and all other months of the third quarter were higher than that. On that basis, also, the BEA was underestimating the effects of inflation on its raw GDP data by almost 50%! And, of course, we know that true inflation is worse even than 8.2% if we were to actually measure it the same way the government did back in those horrible inflation days of the seventies and eighties — to which we now match right up:
Lies upon lies upon lies!
Yes, if we measured UNADJUSTED inflation the SAME way we did back in the late seventies and early eighties when inflation dominated the news and financial thinking for years, we are actually worse off! And what does that say about where GDP should be compared to those years if we measured inflation the same way we did IN THOSE YEARS?
So much lying happens in the “adjustments” and isn’t even explained! The devil is in the details, but no one stops to question them, except a rare few like John Williams of Shadowstats and myself who say, “Hold on a minute here!” But no one listens. Not in the entirety of the financial press. They just sleep right on through.
There was a lot of blubber in this pig to try to cut through to get down to the real meat, and no one makes the numbers easy to find.
If you would like to keep seeing reportage that tries to slice through the layers of outright lies by your government, the slight of hand and the subterfuge, please support me at my Patreon page. It is the ONLY way all of this will continue into 2023 because, trust me, no one in the mainstream press is willing to pay me to research articles like this. They would rather ban such articles. Without a lot more support, this will soon all go away because It takes a surprising amount of time to first discover where the error in the number lies, which sometimes NO ONE else seems to be seeing, and then to try to dig through the fog of numbers to see what is really happening.
And thank you to those who have been consistent supporters that have kept this site going this long. The Patron Posts, by the way, are not intended as a paid newsletter, but as an extra I give back to my patrons because what you are really supporting is the entire writing of this website. Without your support none of this can happen.
Liked it? Take a second to support David Haggith on Patreon!


