Two weeks ago, we published This is NOT the Silver Breakout You’re Looking For.
The silver price had gone from $24 to over $26 and the gold price was up about $50/oz over the same period. Our basis indicator made it clear that the rapid runup in prices was driven primarily by paper traders buying futures contracts (with leverage). To say it was clear is an understatement. It was crystal. Here’s another look at the chart we published:
The price of silver promptly dropped around $1.50.
But since then, it is back up to almost the same level. Is this time different, is this move now driven by stackers of physical metal? Or is it, once again, buyers of futures using margin accounts to maximize their hoped-for returns of $$$ on a quick flip of a metal position? Here’s the chart.
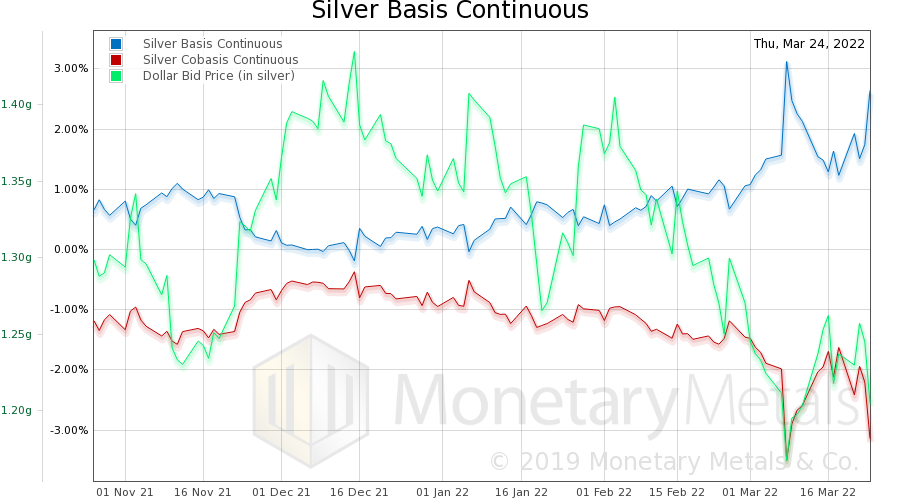
For the uninitiated, the blue line represents the annualized profit (expressed as a percentage) to simultaneously buy metal and sell a futures contract. This is not a bet on the price. It’s an arbitrage, it is trading the spread between futures and spot metal. The more that speculators bid up the price of futures relative to the spot price, the more profitable this arbitrage becomes.
For those looking for an introduction to our basis and cobasis indicators, check out this video which explains how the model works.
That blue line went from about 1%, to over 3% per year! In other words, there was a lot of buying of futures contracts. Then it subsided, as the price came down, though not that much. Which meant that the price drop was mostly the selling of futures. Now, the current move shows a rising basis once again. Buying is led by paper futures once again.
Let’s drill down into the action yesterday (Thursday).
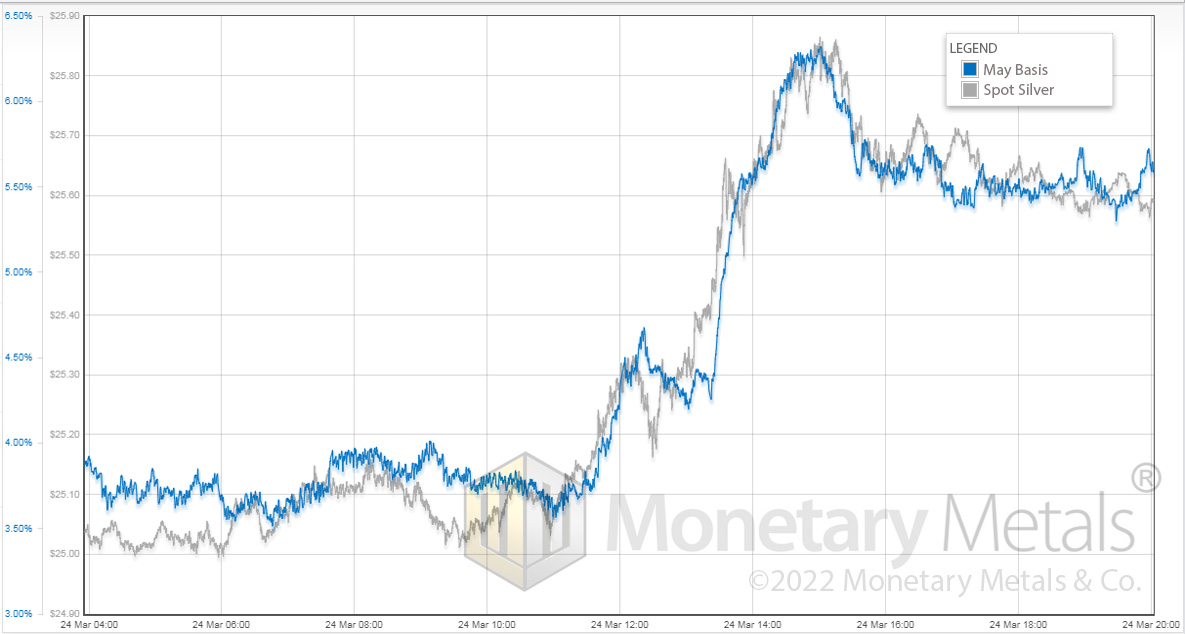
With the price around $25, the May basis (the first chart shows a continuous basis with constant maturity around six months) is around, or just a bit under, 4%. Then *wham*! Someone whacked the price up, like hitting a golf ball with a sand wedge at full speed. In three and a half hours, the price shot up almost a dollar (all times are in London).
And the basis shot up, tick for tick, with it. It hits almost 6.5%. That’s a big deal.
Someone bought a lot of paper. This is a bet on the price of silver, and most likely a short-term bet.
Once the price had topped, it comes down 20 cents and stays in a range. And with it, the basis comes down. This is all futures traders positioning and repositioning in the metal.
Breaking Out? Breaking Down? Or Just Plain Boring?
What’s our take on this price behavior? The fundamentals don’t look to be strengthening. It’s just churn.
This bears further watching (and you can subscribe to receive these updates in your inbox as soon as they hit). We’d put this somewhere between firmly boring (trading in a narrow range, consolidating) to potentially weakening supply and demand fundamentals.
However, there are a lot of tailwinds blowing in support of higher gold prices, and potentially silver too. We discuss those at length in our Gold Outlook Report and give our price predictions for the year. Download it for free here: Send me the Gold Outlook Report 2022
For those looking to earn money the old-fashioned way – by saving and earning interest on gold, you can open an account or find more information here.
We want to hear from you! What should we write about next?
Complete the one question survey at this link to let us know what you’d like our next article to be about.
Whichever option gets the most votes, we will publish as an article.
© Monetary Metals 2022
About the author