
“Well ya know, Gold is down because of Dollar strength…”
Oh good grief are we sick of hearing that. Honest to Pete, knee-jerk “conventional wisdom” is hardly our investing indicator of choice, especially when it comes to owning Gold, which at this writing — in having settled out the week yesterday (Friday) at 1847 — is as cheap as can be. More on that as we move forward.
But let’s begin by (again) debunking the notion of “Dollar strength”. ‘Tis axiomatic that which is worth zero (“0”) — regardless of it being acceptably transacted in exchange for other currencies, goods and services — is at any price still worth “0”. Further to our point — given we oft quip Gold plays no currency favourites — let’s point (►) to past periods (sampled from three-to-four months in duration) of positive correlative strength for both the Dollar and … oh say it ain’t so … Gold! To wit:
► Just after the turn of the century (which for those of you who can do math began with 2001), the Dollar Index (“Dixie”) from 19 Feb ’01 to 21 May ’01 recorded a net gain of +6%: Gold’s net gain for the identical stint was also +6%.
► How about in 2005: from 29 Aug through 28 Nov, Dixie’s net was +7% and Gold’s was +12%.
► Then there were the FinCrisis throes of 2008: from 08 Sep through 08 Dec both Dixie and Gold netted gains of +7%. Are we having fun yet?
► Check out 2010: from 01 Feb through 14 June whilst Dixie gained +7%, Gold nearly tripled same with +20%. They say: “No Way!” … Way.
► Ah, then came infamous 2011: from 27 Jun through 26 Sep Dixie’s net change was +6% … Gold’s was +9%.
► Three years hence from 27 Oct ’14 through 02 Feb ’15 Dixie netted +9% and Gold a still respectable +5%.
► And similarly just last year in 2022 from 10 Jan through 25 Apr, Dixie gain a net +8% and Gold again a net +5%.
Thus to paraphrase the Johnny Paycheck tune from back in ’77, you can ![]() “Take this Dollar strength and shove it.”
“Take this Dollar strength and shove it.”![]()
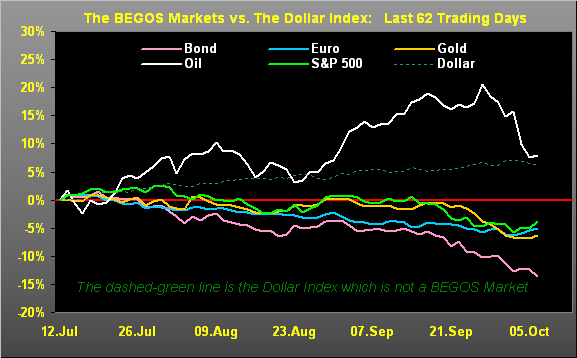
Regardless, as we’ve emphasized, of late ’tis hardly just Gold being pinned down by the Dollar. The primary BEGOS Markets (Bond / Euro / Gold / Oil / Spoo) have all — save somewhat for Oil until just these last few days — been on the skids. The following picture depicts their percentage tracks from some three-months ago-to-date along with the green-dashed Dixie:
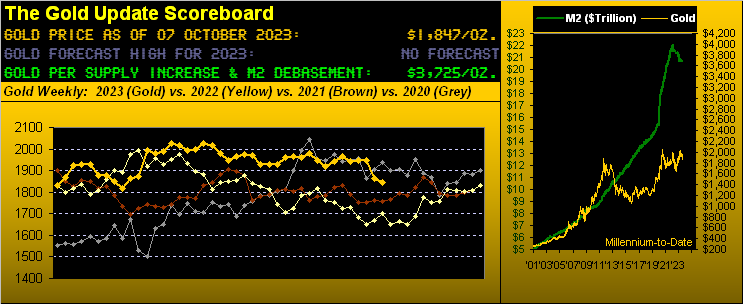
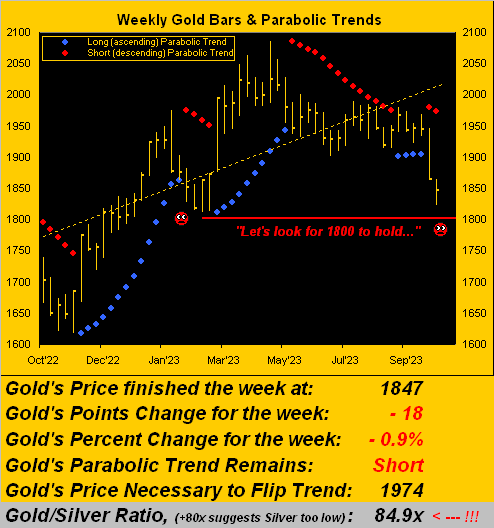
And amongst the selling, Gold was shoved lower for the third straight week, the 1824 low being revisited for the first time since 09 March. So per the price tracks in the opening Gold Scoreboard, Gold today (1847) is lower than ’twas on this day three years ago (1936), even as the U.S money supply (“M2” basis) is +33% higher now than then ($15.6T –> $20.8T). But the market never being wrong, Gold completed its second week of the fresh parabolic Short trend, here per our view of the weekly bars from one year ago-to-date:
Also as anticipated, Silver’s weekly parabolic trend is now Short.
“But are you resolved to ‘how low is low’ for Gold, mmb?“
A side-stepped question that duly warrants a studied answer, Squire. That red line in the above graphic is precisely at the 1800 level, (one ought think another “planned” loading up point for the sovereigns). As for an analysis in the vacuum of averaging: Gold’s average points drop for the past 10 weekly parabolic Short trends from each confirmation is -101 points. Therefore from the “confirmation price” of 1865 two weeks ago, a -101 downside would bring 1764. Indeed the mid-to-upper 1700s were extremely price congestive throughout much of 2021. Yet just this past March (left end of the red line) found Gold buyers coming to the fore. Should that repeat — especially upon recognition that “Dollar strength” can be beat — this new Short trend can well end as short-lived.
“But even if the Fed raises again, mmb?“
Squire, ’tis starting to look like another Federal Open Market Committee vote to boost the cost of FedFunds come 01 November. But again in expunging “conventional wisdom,” you along with many of our long-time valued readers already know Gold can get on the go even in times of rising interest rates, (see 2004-2006). And as we regularly say, with the Gold Scoreboard valuation of 3725 today, price at 1847 is ever so cheap.
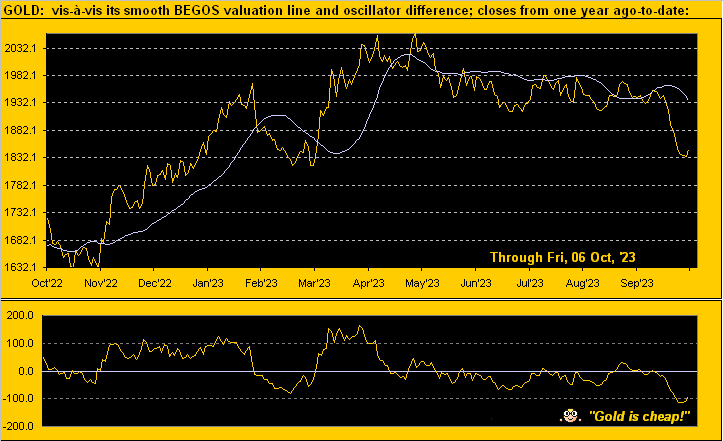
More to the point per the website’s Gold page, here next is the graphic of Gold’s daily closes from one year ago-to-date astride the smooth valuation line (born of price changes relative to those of the primary BEGOS Markets: Bond / Euro / Gold / Oil / Spoo). The lower panel is the difference between price and valuation, which per yesterday’s settle is nearly -100 points “low”, historically an extreme that begs for reversion up to the mean. And now we learn of an incursion in Israël which can have geo-political price ramifications for Gold. Either way, have we mentioned that Gold is cheap? Indeed:
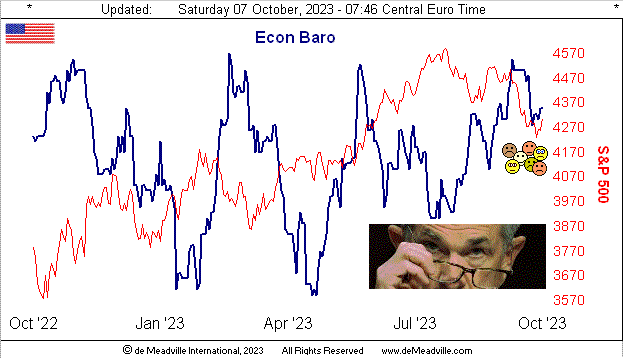
Not appearing so cheap of late is the thrust of the StateSide Economic Barometer. In spite of the hand-wringing over a returning recession, the Econ Baro has been marching right up the road, albeit such apparent “growth” includes “inflated” data. Recall on 28 September the final read of Q2 Gross Domestic Product incorporated a chain deflator implying 44.7% of growth was inflated vs. real. Still, some fairly bold metrics boosted the Baro this past week, notably Labor’s Payrolls numbers for September (+48% over August), although ADP’s Employment data was 180° out-of-phase (-51%). Too, August’s Factory Orders whirled ’round from shrinkage to expansion. But on a scary note: Consumer Credit — a key economic driver — actually shrank in August for the first time since the summer of 2020 when all were cowering under COVID. (Prior to that, Consumer Credit hadn’t shrunk on a monthly basis since its July reading in 2012). Are FedChair Powell and his trusty FOMC able to sleep? Raise ’em and weep? Here’s the Baro:
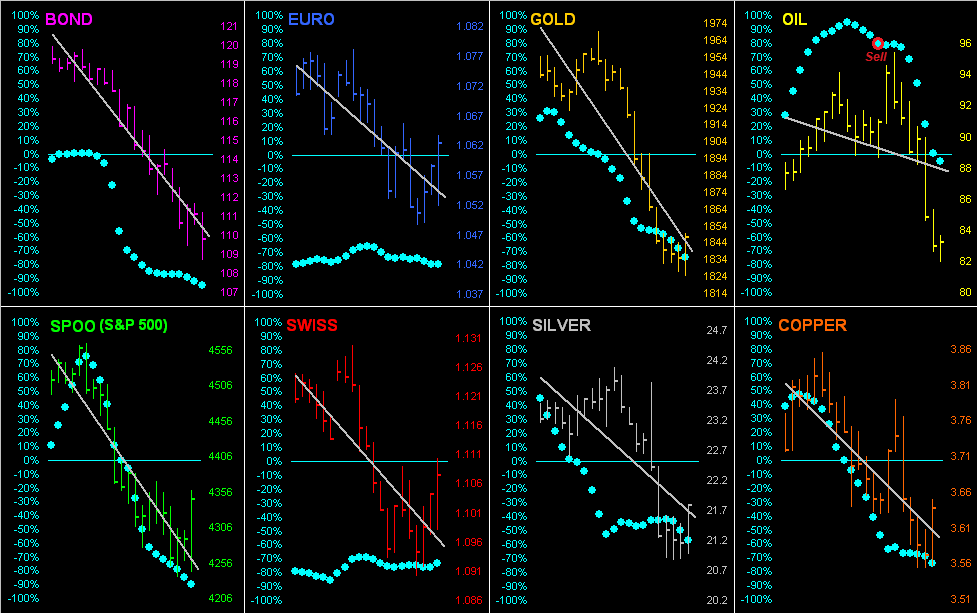
Specific to the markets, let’s now go ’round the horn for all eight BEGOS components. Typically we reserve this view solely for our month-end editions of The Gold Update. But with “Oh that Dollar strength!” ruling the roost, here we’ve the exceptional picture of each market’s grey diagonal trendline heading down across the past 21 trading days (one month) along with their respective baby blue dots of day-to-day trend consistency. Indeed as we tweeted (@deMeadvillePro) this past Thursday with respect to Oil having already issued a Sell signal in the prior week, “Follow the blues, (you know the drill…)”:
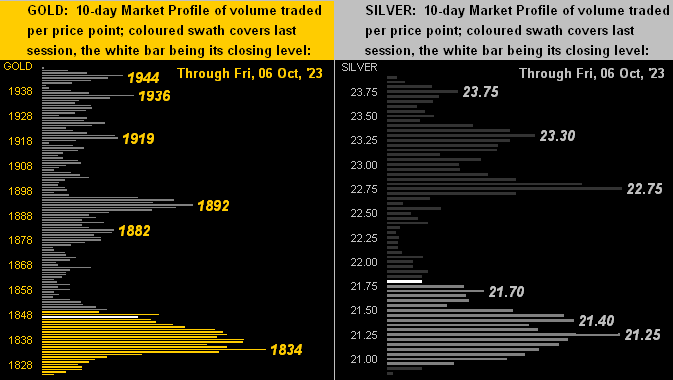
And to specifically drill down into the precious metals, follows are their respective 10-day Market Profiles for Gold on the left and for Silver on the right. Despite the recent selling, both metals at present exhibit trading support below current price (white bar), notably for Gold as labeled at 1834 and for Sister Silver in her 21.70-21.25 zone:
With Q3 Earnings Season underway and 10 metrics due for the Econ Baro in the new week, let’s wrap here with two notes from deMeadville’s vast array of departments.
First from the “Core No More? Dept.” we perused an interesting essay (hat-tip FI’s Todd Bliman) emphasing that the Federal Reserve evaluates inflation and the economy well beyond the oft-mentioned Core Personal Consumption Expenditures Price Index. We (indeed one would assume all of us) agree, albeit the Core PCE month-in and month-out seems very closely aligned with the Fed’s 2% inflation goal. Nevertheless, as hard-wired ad nauseum throughout the FOMC’s Policy Statements, they “…will continue to monitor the implications of incoming information for the economic outlook…” and oh baby as payrolls grow but consumers lie low, which way shall the Fed go? The next Core PCE reading is three trading days prior to the next FOMC vote.
Second from the “They’re Just Figuring This Out Now? Dept.” (the popularity of which is growing by leaps and bounds), Dow Jones Newswires discovered this past week that "Rising Interest Rates Mean Deficits Finally Matter." Otherwise, who knew, right? Moreover, does this (finally) threaten the ongoing Investing Age of Stoopid? Stay tuned…
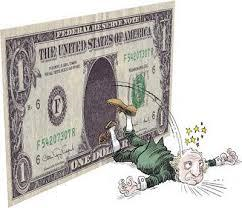
As to ongoing so-called “Dollar strength” ultimately getting shoved, we reprise Daryl Cagle’s oldie-but-goodie graphic given that ultimately 0 = 0: So do stay with Gold and Silver!
Cheers!
…m…
www.TheGoldUpdate.com
www.deMeadville.com
and now on Twitter(“X”): @deMeadvillePro
About the author
