
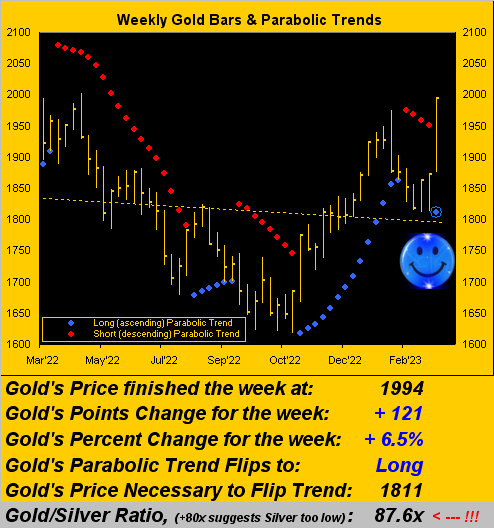
We begin with this penned from two missives ago: "...two robust up weeks from here could end the Short trend with the 2000s then in the offing..."
And that's exactly what Gold did unfold, price ascending from as low as 1813 two weeks ago to as high as 1994 just yesterday (Friday), indeed settling on that high.
Thus by Gold's low-to-high run of +180 points (+9.9%) across just these last eight trading days -- without further ado as accompanied by a little drumroll please -- Gold's rally was more than sufficient to flip the aforementioned trend from Short to now Long per the parabolics for Gold's weekly bars as heralded by the rightmost fresh blue dot:
"But isn't that a 'Hobson Close', mmb?"
Our sharp-eyed Squire never misses a beat, folks. Yes, 'tis a so-called "Hobson Close", i.e. price closing on its high not for just the day, but in this case for the week as well. The technically-oriented Hobson purest takes such occurrence as a "sell signal": to the extent anyone of that bent is still around, 'twould be only natural to see some price retrenchment into the new week. But the fish being fried here is of far broader upside import than archaic ol' Hobson, given Gold's weekly parabolic having flipped to Long.
■ Moreover: the average maximum points follow-through of the past 10 weekly parabolic Long trends (extending back to January 2018) is +168 points. And whilst "average" is no guarantee of "reality", still by Gold's present price: 1994 + 168 = 2162, well in excess of the standing All-Time High of 2089 (on 07 August 2020). Too, within such analytical vacuum, the "average" length of the past 10 weekly parabolic Long trends is 15 weeks, suggestive of Gold achieving the mid-2100s 'round the StateSide Fourth of July... just in case your scoring, indeed BBQ planning, at home. 'Course per present "reality", Gold can get there far faster given its being so geared up!
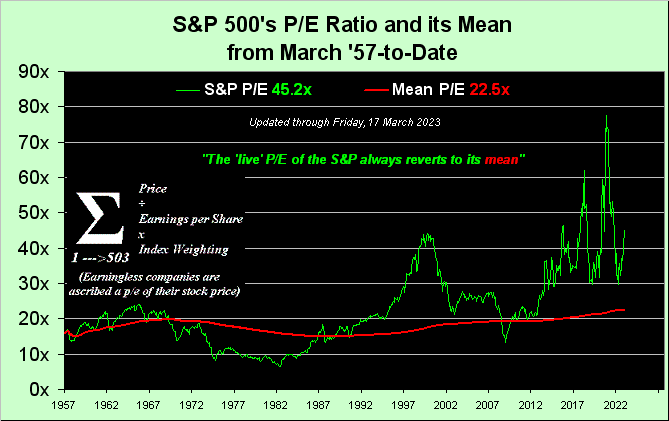
■ Further: unlike Gold's typical "spike n' fade" reaction to geo-political events, (the most glaring of late being but a few weeks into the ongoing RUS/UKR war), yes, Virginia, 'tis different this time. Gold finally is getting a monetary-(or lack thereof)-driven revaluation to long overdue (understatement) higher levels. Dare we say 'tis right in line with our having renamed the stock market's next demise from the "Look Ma! No Earnings!" crash to the "Look Ma! No Money!" crash. Oh to be sure, Gold remains significantly under-owned. But even at a micro level, we sense a growing interest in Gold per email traffic and personal encounters with folks here who otherwise don't speak of the yellow metal.
---> Indeed the contract volume traded in Gold for just for this past week was the most since that ending 14 August 2020 during the weaponization of COVID. And across the 1,159 weeks century-to-date, last week's contract volume ranks 19th, i.e. in the 98th percentile, and more than twice this year's weekly average. "Got Gold?"
One thing money does seem to be getting is stock. How can we say that as the banking world as escalated by the media-at-large apparently is coming to an end?
Cue the "Saved by the Fed Dept." Whether 'tis the mighty Federal Reserve or a consortium of the Big Banks, they're riding onto the stage upon their gilded white horses. "We're saved!" And the numbers are all over the joint: "The banks are coming with $30 billion!", they say. "The Fed's coming with $300 billion!", they say. "No wait, now the Fed's coming with $2 trillion!", they say. We say: watch the stock market. Here's why:
To be sure the S&P 500 is floundering about. Yet rather than crashing, low-to-high this past week the Index gained +4%. How can that be? Surely you website watchers can see. For the MoneyFlow continues to be as robust as ever. Here are its three timely measures in the face of panic, the blue line as the difference between the cumulative points change in the S&P and its MoneyFlow as regressed into S&P points. And as you long-time readers know, this has been a very reliable directionally-leading indicator over these many years:
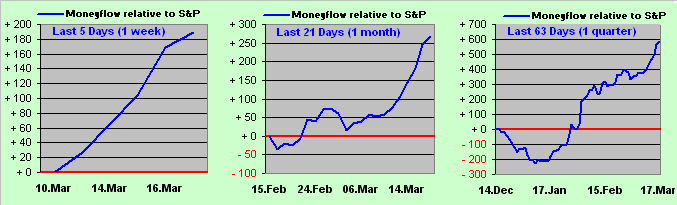
But honestly: whilst those panels suggest the S&P 500 (at present 3917) is en route to gaining some 200-600 points over the near-to-medium term -- as much as we revere the MoneyFlow indicator -- we're ever so cautiously dubious. Why? Because of this next graphic:
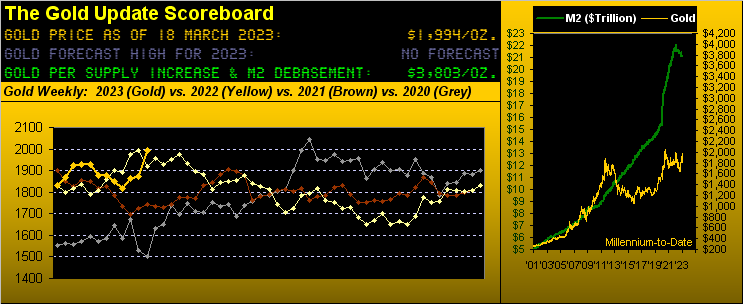
That's right: rather than cheat, we instead honestly do the math. And the "live" price/earnings ratio of the S&P 500 settled yesterday at 45.2x. (See last week's missive as to how the mainstream dishonestly calculates it). And the reason the P/E rocketed up this past week was that money absolutely poured into the highest capitalization-weighted stocks in the S&P: Apple, Microsoft, Amazon, Nvidia and Alphabet (Google) garnered terrific amounts of monetary inflow, keeping the Index ever so high, whilst earnings slept through the show, don't you know. And then there's this:
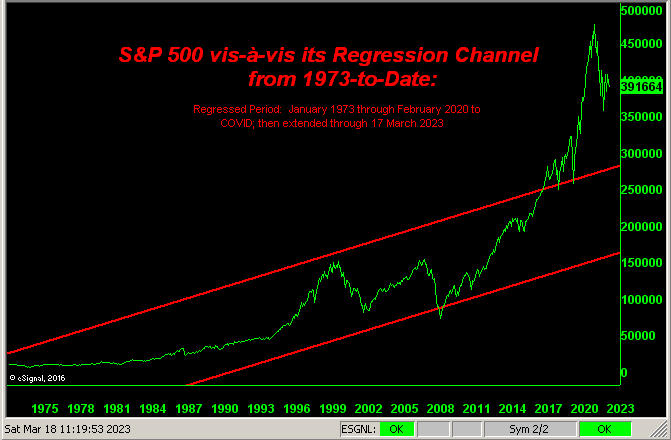
Remember: were it not for COVID and all its attendant inflating of the U.S. Money Supply (as measured by "M2" from $15.8T to as high as $22.1T, i.e. +39% in barely two years), the S&P today per the above regression channel would "likely" be sub-3000. And upon the P/E's next regressing to its lifetime mean, the Index ought be well sub-3000. Thus for the S&P: the MoneyFlow suggests higher levels; earnings suggest lower levels, and 'tis the latter that ultimately dominates, especially with interest rates on the rise.
"But mmb, what if the Fed stops raising because of the banking blow?"
'Tis funny, that, Squire. Not even two weeks ago 'twas the clarion cry through the FinMedia (ourselves included) that the Fed shall re-accelerate their FedFunds increases to increments of +50 basis points. But then as quickly as the banking bilge began, "raise" morphed into "pause". We'll know come this Wednesday (22 March) upon the Federal Open Market Committee's release of their Policy Statement. Either way, Mme. Lagarde didn't pause this past Thursday, her European Central Bank lurking past the liquidity issue with another +50 basis points across its key interest rate triumvirate.
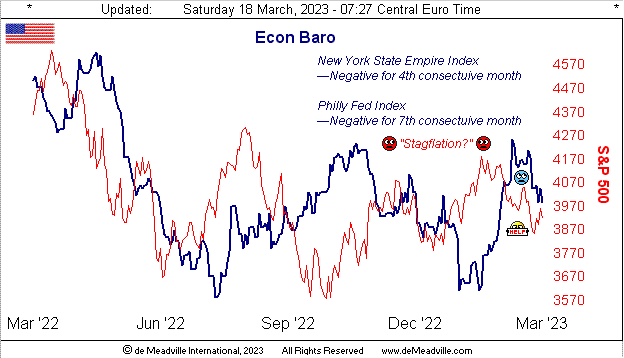
As for StateSide inflation, it remains on the march, albeit at a slightly slower pace. At the retail level, the Consumer Price Index cumulative 12 months' rate went from +6.2% as of January to +5.8% as of February. Respectively for the "leading" (although more volatile) Producer Price Index, the change was from +5.0% to +4.0%. Thus life is costing considerably more than 'twas, but with less of a gouge, (so says the Bureau of Labor Statistics). What says the Economic Barometer? "Stagflation" perhaps? Here 'tis:
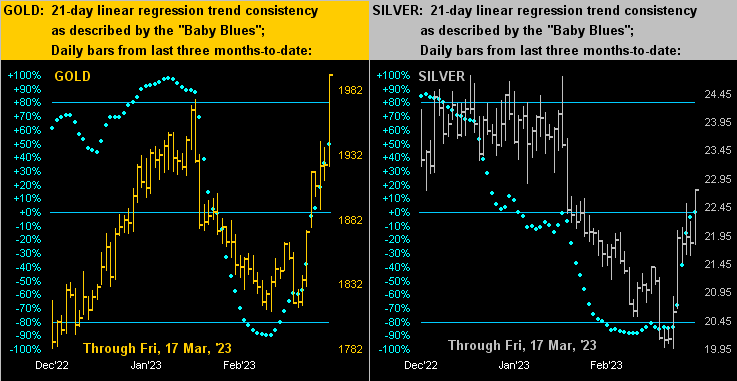
Now to a bullishly brilliant two-panel view of the precious metals by their daily bars from three months ago-to-date. Be it for Gold on the left or Silver on the right, the baby blues dots of linear regression trend consistency are on the move. And you know that old axiom: "Follow the blues, else watch the news and lose yer shoes." Even so, Sister Silver continues to lag Gold, the yellow metal having broken above January's structural resistance, but the white metal still having to break above same. This is made all the more stark by the Gold/Silver ratio still an historically high 87.6x! "C'mon Sister Silver!":
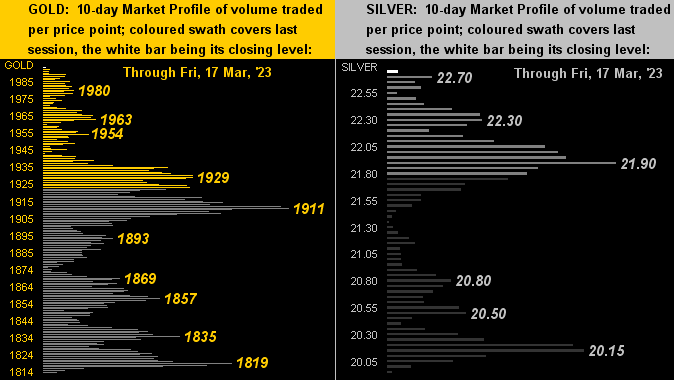
That noted, Silver did catch up a bit toward Gold as we turn to their respective Market Profiles for the past fortnight. Recall in our prior two missives that Gold (below left) was pretty much at the top of its Profile, whereas Silver (below right) was but mid-pack. Now both sit at the very top:
We'll close it here with our Top Headline of the Week, courtesy of Dow Jones Newswires:
"The Party Is Ending for French Retirees", blurted the Wall Street Journal. Indeed we alluded to this back in our 21 January missive. And now 'tis official: if you live and work in beautiful neighbouring France, the pension-eligible retirement age was just "forced" from 62 to 64 essentially via an executive order by President Macron. Clearly "Le Macaron" gets the "Look Ma! No Money!" burden on "les trésors" both public and private. 'Course, much of the western world is having a bit of a snicker over our French friends receiving paid retirement at still such a "young" age. Indeed, we just read per U.S. Census data that some 20% of American folks above the age of 70 with a college degree are still working. Oh to be sure there are many top-flight, hard-working French out there, just as there are many lazy-ass Americans. Regardless, the "conventional optics" which universally have been perceived these many decades since the end of WWII are: working in France on balance is viewed as a necessary annoyance, whereas as StateSide folks in general love their work. Indeed this is supported by data from the Organization for Economic Co-operation and Development that (as of 2020) the average annual U.S. wage is $69k vs. France's $46K (€43k). Vive la différence!
Irrespective, gear up with a little Gold to that and you'll be a fat cat!

Cheers!
...m...
About the author
