
We start with the Federal Reserve, the Open Market Committee scheduled to deliver its next Policy Statement this coming Wednesday, 20 March (at 18:00 GMT).
Obviously the FOMC shall unanimously vote to do nothing with its Bank’s Funds Rate, the devil then being in the Statement’s details, followed by those then exorcised by the FinMedia from Chair Powell during his presser.
Now as you regular readers know, we’ve herein mused (albeit not predicted) since the beginning of this year that the Fed — rather than cut rates as everyone expects — instead have to further raise rates if for no other reason than the math suggests inflation is running well above the Fed’s infamous, annualized 2% “target”.
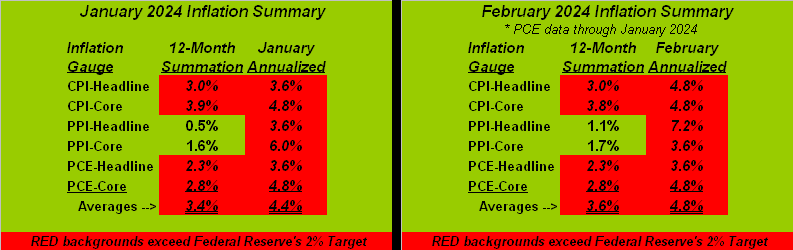
Recall two weeks ago our inflation summary for January. ‘Tis below on the left. Since then, the Bureau of Labor Statistics has chimed in for February with both retail inflation (Consumer Price Index) and wholesale inflation (Producer Price Index). Thus we’ve updated that graphic as now shown below on the right, (February’s Personal Consumption Expenditures not due from the Bureau of Economic Analysis until 29 March). Regardless: look at the “Averages” row at the foot of both panels: we’re continuing to go the wrong way, (i.e. inflation is increasing). And yet conventional wisdom is staying the rate reduction course? “C’mon, man!” Again, if in red, the metric is ostensibly “too high” for the Fed:
But nary a day goes by wherein we don’t read about the “timing” of the Fed’s cutting rates.
So query: what about the “timing” of the Fed instead rightly raising rates? Just sayin’ … for after all, math is a marvelous science for detecting the truth. (‘Course, “Math Class” has been long-removed from many a public school curriculum and replaced with “How to Grow a Tree Class”). Still, the insistance for the Fed to cut rates remains a core issue for the FinMedia. Following all this past week’s increasing inflation metrics for February, here are some choice headlines per the parroters:
- Bloomy: “Fed gets more reasons to delay interest cuts” (why not raise?);
- DJNw: “‘Perpetually optimistic’ investors worry Fed won’t cut rates three times this year” (dumb);
- CNBS: “This week provided a reminder that inflation isn’t going away anytime soon” (duh);
- Bloomy: “Fed Seen Sticking With Three 2024 Cuts Despite Higher Inflation” (denial).
At least Dallas FedPrez Lorie “Logical” Logan gets it, her saying in January: “…we shouldn’t take the possibility of another rate increase off the table just yet…” Too bad she is not (as yet) an FOMC Member.
Also — were the Fed to raise rates — are the fallout issues both for equities and political support. As you know ad nauseum, the S&P 500 is ridiculously over-extended, (see the historical case in last week’s missive for a material “correction” of some 16%-to-18% within these next three months). The last thing the Fed wishes to foster is a rate-hike-elicited stock market collapse, especially in a Presidential election year. As the U.S. Senate in May 2022 extended Fed Chair Powell’s term through May 2026, ’tis favourable for him not to see a power shift therein should higher rates cream equities. On verra…
The bottom line is: if the Fed truly desires annualized inflation not exceed 2%, they need tighten rates, and in turn, tighten belts of America.
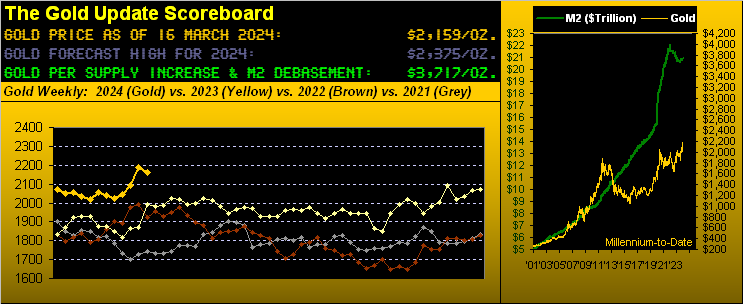
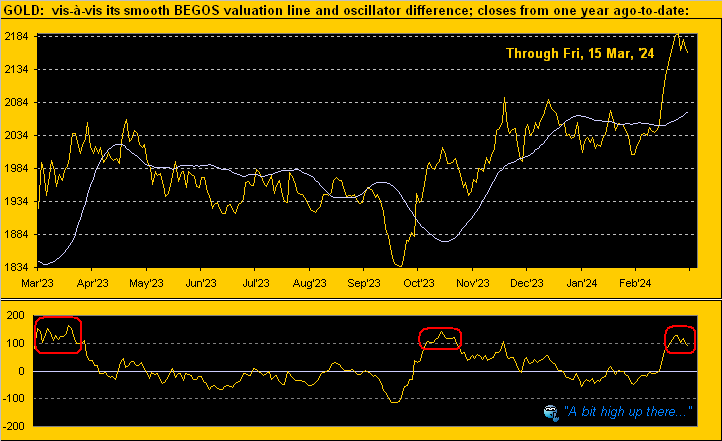
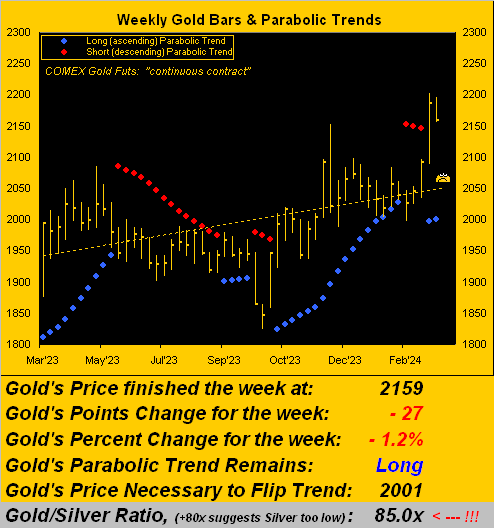
As entitled for “Gold’s Expected Detinue” (which for you WestPalmBeachers down there means “a person or thing detained”), certainly so was Gold’s recent advance. For the week just past, Gold’s net change was -1.2% (-27 points) in settling yesterday (Friday) at 2159. Why “expected?” Recall from last week’s piece this now updated graphic of Gold vis-à-vis its smooth valuation line as derived from the relative movement of the five primary BEGOS Markets (Bond / Euro / Gold /Oil / S&P). Oh to be sure, per the Gold Scoreboard, price (2159) is vastly undervalued given its currency debasement level (3717); but more momentarily per the website’s Market Value graphic, price at present is nearly 100 points “too high” given what near-term typically ensues per the red encircled bits as displayed from one year ago-to-date:
‘Course, across the same time frame by Gold’s weekly bars and parabolic trends, hardly does it get any better than this. And yet with respect to that just displayed for Gold being some 100 points above its BEGOS Market Value, our weekly graphic’s dashed linear regression trend line is similarly about 100 points below price, (that courtesy of the “Means Reversion Dept.”) Here ’tis:
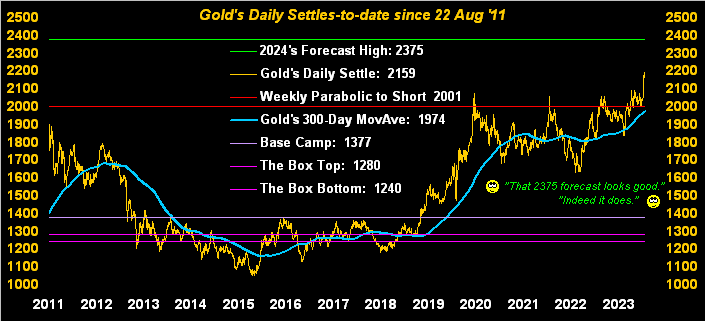
Nonetheless more broadly — indeed by the day since 22 August 2011 (when Gold achieved an All-Time Closing High at 1900) — the upward tilt of price looks nice. This next display retains several of Gold’s more notorious levels of the past, along with this year’s 2375 forecast (green line) as rather ripe for the taking:
But taken for a ride of late — indeed one quite steeply down — is the Economic Barometer. That combined with increasing inflation maintains the reality of stagflation as detailed in our prior two missives. In fact, the StateSide economy did get a net bump for this past week, albeit the increasing CPI and PPI headline levels aided and abetted the Baro given “the rising tide of inflation lifts all boats” … until of course stagflation digs in deeply: “It now costs how much for that?” Not pretty:
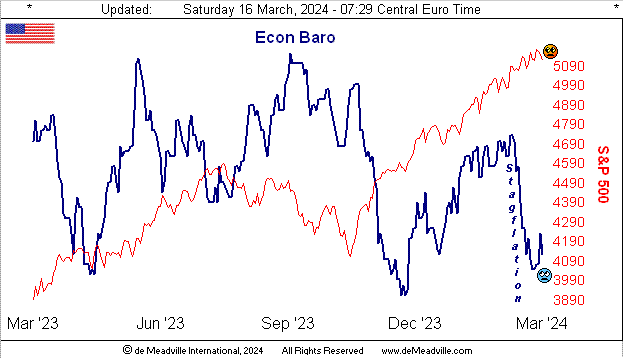
As for the Casino 500, (red line in the Econ Baro chart), its “live” price/earnings ratio is now 45.3x (basically double its inceptive reading a dozen years ago) and the “textbook” measure (a concoction of John Bollinger’s Bands along with the classic measures of Relative Strength and Stochastics) is currently “overbought” through the past 40 consecutive trading days, (historically never sustainable).
Fortunately, both Gold and Silver — especially the latter — remain cheap relative to currency debasement. For Gold to match today’s debasement valuation, price need rise from 2159 to 3717 (i.e. +72%). And with the century-to-date average of the Gold/Silver ratio at 68.1x, priced to that per Gold’s 3717 valuation puts Silver from today’s 25.41 to 54.58 (i.e. +115%) … just in case you’re scoring at home.
Drilling down to the near-term view, here next we’ve the daily bars and baby blue dots of trend consistency from three months ago-to-date for Gold at left and for Silver at right:
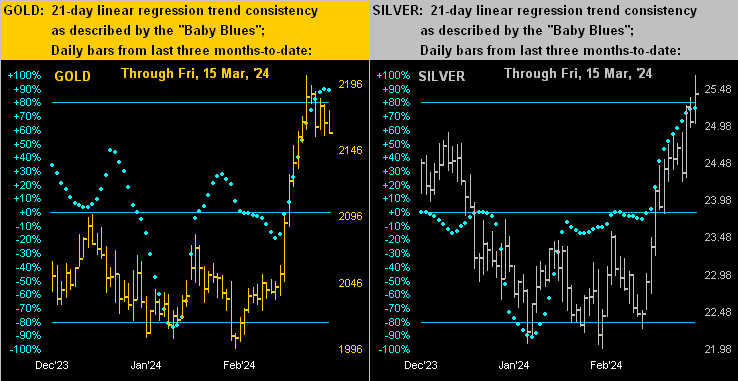
“Both do look over-extended, mmb…“
Squire, they’re clearly stretched to the upside, however great bull markets (or the resumption thereof) do breakout as such. ‘Course, market participation with a buy-side bias is foundational for the bull to run, and credit due both Gold and Silver, their contact trading volume for the past two weeks having been above average.
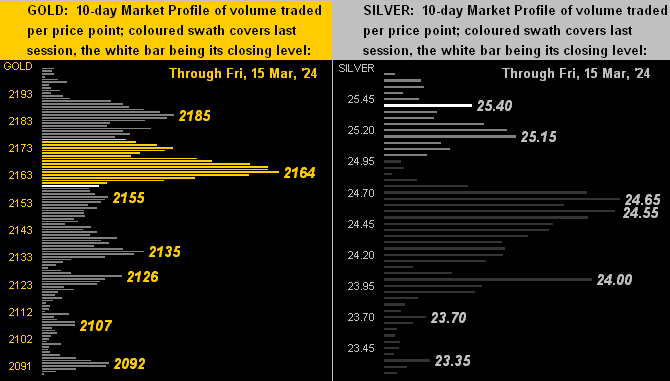
Indeed to further focus on the past two weeks, here we’ve the precious metals’ 10-day Market Profiles for Gold (below left) and for Silver (below right), their respective trading support and resistance levels as labeled. Of note, whilst Gold’s volume is toward the higher prices, that for Silver is around mid-Profile. But the aforementioned Gold/Silver ratio is now 85.0x, down from 89.1x a week ago. So Silver is getting a well-overdue bid, price having just closed above 25.00 for three consecutive days, an event not having occurred since last 29 November through 01 December:
Towards the wrap, here’s The Gold Stack:
The Gold Stack
Gold’s Value per Dollar Debasement, (from our opening “Scoreboard”): 3717
Gold’s All-Time Intra-Day High: 2203 (08 March 2024)
2024’s High: 2203 (08 March)
10-Session directional range: up to 2203 (from 2088) = +115 points or +5.5%
Gold’s All-Time Closing High: 2189 (11 March 2024)
Trading Resistance: 2185 / 2164
Gold Currently: 2159, (expected daily trading range [“EDTR”]: 26 points)
10-Session “volume-weighted” average price magnet: 2157
Trading Support: 2155 / 2135 / 2126 / 2107 / 2092
The 2000’s Triple-Top: 2089 (07 Aug ’20); 2079 (08 Mar ’22); 2085 (04 May ’23)
The Weekly Parabolic Price to flip Short: 2001
2024’s Low: 1996 (14 February)
The 300-Day Moving Average: 1974 and rising
The Gateway to 2000: 1900+
The Final Frontier: 1800-1900
The Northern Front: 1800-1750
On Maneuvers: 1750-1579
The Floor: 1579-1466
Le Sous-sol: Sub-1466
The Support Shelf: 1454-1434
Base Camp: 1377
The 1360s Double-Top: 1369 in Apr ’18 preceded by 1362 in Sep ’17
Neverland: The Whiny 1290s
The Box: 1280-1240
‘Tis a fairly quiet week ahead for incoming Econ Baro metrics: just seven are scheduled, four of which relate to Housing. Still as cited, The Main Event is Wednesday’s FOMC “maintain the target range” decision. But in and amongst the Statement, Powell Presser and FedSpeak, might the phrase “rate increase” slip out … just as a little future possibility? Quel drame, mes amis…
Either way, with Gold paused per its detinue, consider adding more to your metals’ milieu!
Cheers!
…m…
www.TheGoldUpdate.com
www.deMeadville.com
and now on “X”: @deMeadvillePro
About the author
