Prices move up and down, in the restless churn of our irredeemable monetary system. There are several schools of thought whose theories attempt to describe, if not predict, the next price move.
The Different Theories on What Moves Gold and Silver Prices
For example, the Quantity Theory school attempts to relate the quantity (or change in quantity) of dollars, to each commodity. Generally, this theory predicts rising prices based on the reasoning of “more dollars chasing the same or fewer ounces of gold and silver.” The problem is that the new holders of these new dollars are not necessarily bidding up gold and silver (our thorough rebuttal to this is here).
The Conspiracy School thinks that there is a shadowy cabal, a price-manipulation cartel that decides what the gold and silver prices will be (our thorough rebuttal to this is in our Thoughtful Disagreement with Ted Butler).
Other schools attempt to compare mine production with industrial and jewelry demand. Or attempt to hold up a famous buyer of metal, while ignoring the thousands of not-famous sellers who sold the metal to said famous buyer. We should not make too much ado over a move of metal from one corner of the market to another (as we’ll discuss below).
Gold and Silver Fundamental Analysis: Contango, Backwardation and the Basis
None of these schools describes the fundamentals of the gold and silver markets, much less predicts the price moves. To look at the fundamentals, one must look at the gold and silver bases. The basis, to oversimplify slightly, is futures price – spot price. This shows the fundamentals, because a market in scarcity (as oil has been recently) has a lower price for future delivery than for immediate delivery. In other words, buyers prefer their oil now rather than later. And this preference is expressed as a higher price for delivery now, vs. later. This condition—called “backwardation”—is a signal to everyone warehousing the commodity to de-carry it. That is, to sell the commodity in the spot market and buy back their position via a futures contract. They pocket a small but risk-free profit for doing so.
Backwardation in Oil
As of Friday, this profit is about $1.20 for the December crude oil contract—about 17% annualized. No wonder oil has been going up so much!
It is a good indicator of scarcity, because if someone has oil in storage then he has an incentive to de-carry it. Therefore, if the backwardation persists then we know that there are more buyers of spot oil than there are warehousemen storing it.
Conversely, if the price of a futures contract were higher than the spot price—called “contango”—it provides a different incentive. It offers a profit to anyone who can buy spot and simultaneously sell a future. This means that the market values oil in storage more than oil to be consumed today.
Backwardation means that the marginal supply of the commodity is the warehouse. It’s a bullish indicator, because the warehouse has only a finite quantity. Contango means that the marginal demand is the warehouse. It’s a bearish indicator, because the warehousemen will not keep buying indefinitely.
What About the Prices of Gold and Silver?
Now let’s compare gold and silver to oil. Gold has a contango of $1.09. Silver has a contango of $0.03.
Recall that oil has a backwardation of $1.20. This is huge, representing about 1.5% of the price. In gold, $1.09 is about 0.06% of the price. In silver, $0.03 is about 0.1% of the price.
Gold and silver have been mined for thousands of years, and virtually all of that gold is still in human hands (it’s less with silver, though still massive). This means that there is no such thing as scarcity or abundance per se, in the monetary metals. There is scarcity or abundance of the metals to the market. This is why we ignore moves of metal from one place to another.
Scarcity or abundance to the market, is what we are measuring with the basis.
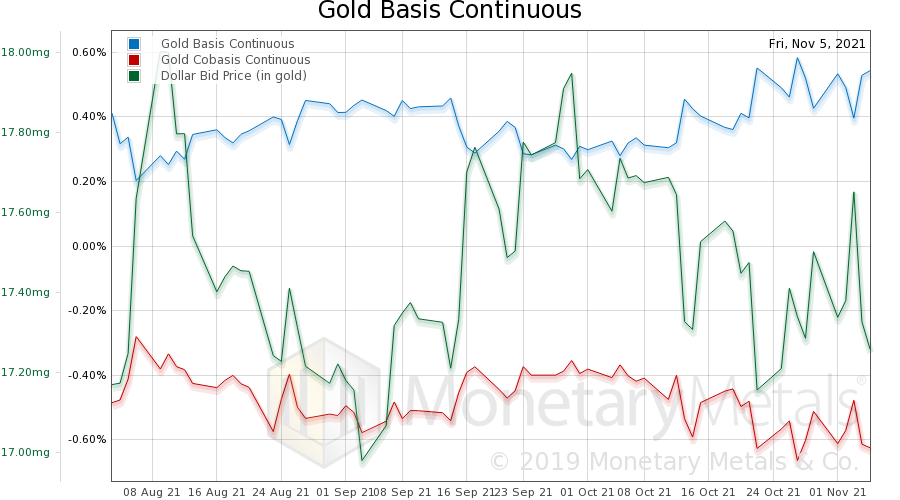
Gold Price Fundamental Analysis – Gold Basis
Since early August, the price of gold has gone nowhere, and the price of silver has dropped about $1, or about 4%. With each gyration on these paths, the cobasis (our measures of scarcity, respectively) has moved inversely to the price of metal, in dollar terms.
On this graph, we show the price of the dollar in gold terms (which is inverse to the price of gold, in dollars). And it’s easy to see that the cobasis (red) moves in the same direction as the dollar (in green). This means that the metal is pulled back from the market, a bit, when the price drops.
Silver Price Fundamental Analysis – Silver Basis
Here is the graph for silver, showing the same pattern.
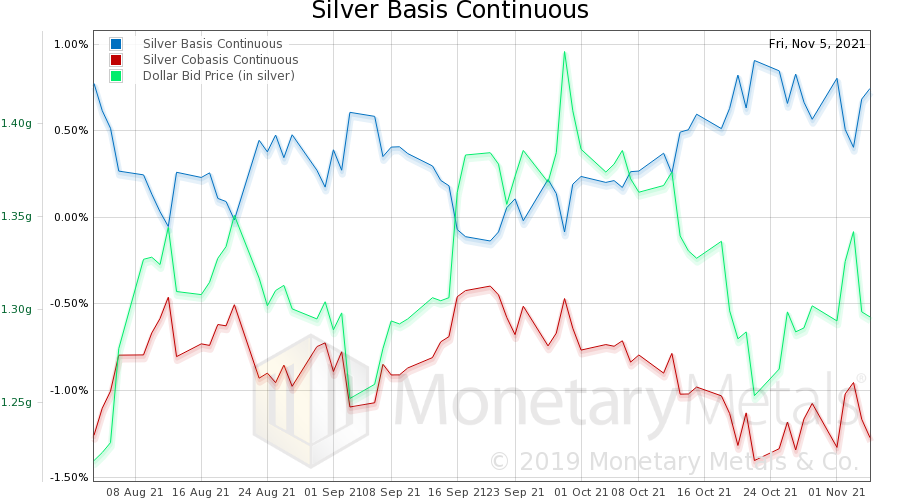
In both metals, the picture shows that investors are merely positioning and repositioning with price. In other words, buy-ups are predominantly the buying of futures. And sell-offs are predominantly the selling of futures. Futures traders have various enablers, motivators, and blockers. But one thing is for sure, they do not create durable moves in price.
This leads to a question. What if we could calculate the effect of the futures traders? Their access to great leverage means they can push or pull the price significantly, at least for a while. What if we could back them out of the market price, and see just the fundamental price, just the price that would clear if traders were only trading physical metal? This would be like the holy grail for metals.
Gold and Silver Fundamental Price Model Update
This is what the Monetary Metals Fundamental Price calculates. It is a model, of course, and so is subject to error. And there can be times of greater error, when the model’s assumptions are broken. “All models are wrong, but some are useful,” is generally attributed to statistician George Box. We have written why, post-covid, our fundamental model was to be taken with a grain of salt.
Gold Fundamental Price Analysis
We believe that the markets are pretty close to back to normal. In any case, we want to take an updated look at the fundamental price graphs to see the direction of the trend. Here is gold, first.
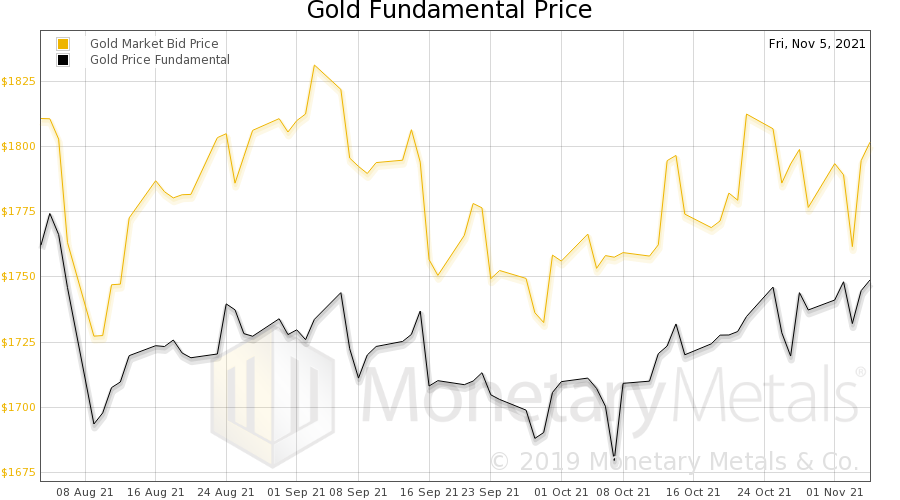
It is moving up, from early October. We would pay less attention to the absolute magnitude ($1,750) and more to the trend. That is, with each zig and zag of price and futures positioning, the fundamentals are getting tighter by over $50.
Silver Fundamental Price Analysis
Here is silver.
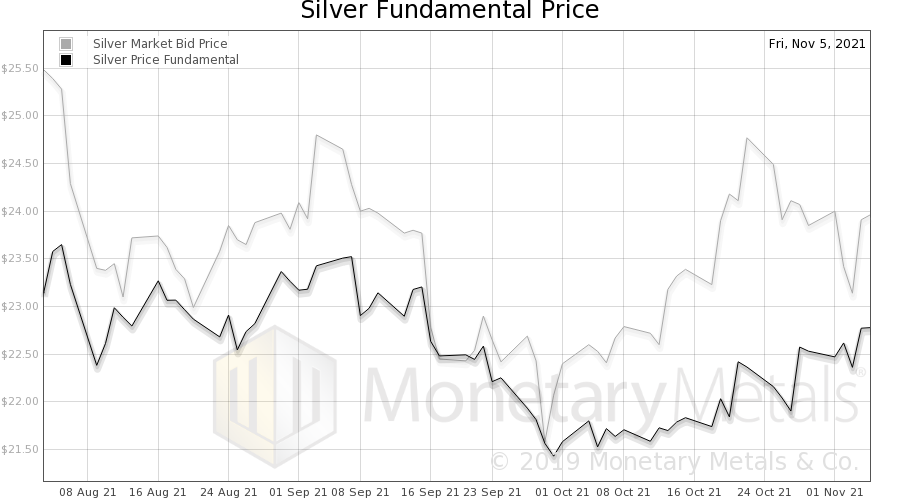
The model calculates a rise of about $1.40 for the fundamental price of silver.
We note one thing, the fundamental price of gold is not quite back up to its level in August. And in silver, the fundamental has another $0.70 to go. This indicator bears watching, to see if it will keep rising. If that happens, especially if the price does not, it could signal a good trade.
© 2021 Monetary Metals
About the author