
This past week, I heard an interview with President Trump, during which he postulated that “this country will go into a depression if she wins the presidency.” Now, believe me, I am no fan of Harris, but I just have to present my perspective that I do not believe this claim to be true. Rather, I think that whomever is going to be the next resident of the White House will likely preside over the start of what may become known as the “Great-er Depression.”
Now, before you start slinging those arrows, I want everyone to remember back in 2016 when the world was so sure that the market was going to crash if Trump was elected. Yet, at the time, I was telling our clients that we were on our way to 2600+ (we were at 2100SPX at the time) as we looked to 2017 “no matter who was elected.” As we now know, the market even exceeded my target and topped out in early 2018 in the 2880SPX region, and then began a correction until we dropped down to the 2300SPX region in late 2018, as per our expectations at the time.
I know this is going to ruffle some feathers when I say it, but it really does not matter who the President is when it comes to the stock market. I know most of you reading this article think that is simply preposterous, yet the empirical evidence supports my proposition.
Moreover, in the autumn of 2007, when Alan Greenspan, the former chair of the US Federal Reserve, was asked by a Swiss newspaper which candidate he was supporting in the forthcoming US presidential election, he surprisingly noted that “it hardly makes any difference who will be the next president. The world is governed by market forces.”
In fact, as more and more studies are conducted about what drives the stock market, we are learning that exogenous factors do not have the effect upon the market as many believe. Let me give you a few examples, which you have likely seen from me before, most of which have been cited in a book I strongly suggest – The Socionomic Theory of Finance by Robert Prechter.
In a 1988 study conducted by Cutler, Poterba, and Summers entitled “What Moves Stock Prices,” they reviewed stock market price action after major economic or other type of news (including major political events) in order to develop a model through which one would be able to predict market moves RETROSPECTIVELY. Yes, you heard me right. They were not even at the stage yet of developing a prospective prediction model.
However, the study concluded that “[m]acroeconomic news . . . explains only about one-fifth of the movements in stock market prices.” In fact, they even noted that “many of the largest market movements in recent years have occurred on days when there were no major news events.” They also concluded that “[t]here is surprisingly small effect [from] big news [of] political developments . . . and international events.” They also suggest that:
“The relatively small market responses to such news, along with evidence that large market moves often occur on days without any identifiable major news releases casts doubt on the view that stock price movements are fully explicable by news. . . “
In August 1998, the Atlanta Journal-Constitution published an article by Tom Walker, who conducted his own study of 42 years’ worth of “surprise” news events and the stock market’s corresponding reactions. His conclusion, which will be surprising to most, was that it was exceptionally difficult to identify a connection between market trading and dramatic surprise news. Based on Walker's study and conclusions, even if you had the news beforehand, you would still not be able to determine the direction of the market only based on such news.
In 2008, another study was conducted, in which they reviewed more than 90,000 news items relevant to hundreds of stocks over a two-year period. They concluded that large movements in the stocks were NOT linked to any news items:
“Most such jumps weren’t directly associated with any news at all, and most news items didn’t cause any jumps.”
Now, let me present you with a study that can put all of this into proper context and explain why exogenous factors are not as imperative as most believe. In a paper entitled “Large Financial Crashes,” published in 1997 in Physica A, a publication of the European Physical Society, the authors, within their conclusions, present a nice summation of the overall herding phenomena within financial markets:
“Stock markets are fascinating structures with analogies to what is arguably the most complex dynamical system found in natural sciences, i.e., the human mind. Instead of the usual interpretation of the Efficient Market Hypothesis in which traders extract and incorporate consciously (by their action) all information contained in market prices, we propose that the market as a whole can exhibit an “emergent” behavior not shared by any of its constituents. In other words, we have in mind the process of the emergence of intelligent behavior at a macroscopic scale that individuals at the microscopic scales have no idea of. This process has been discussed in biology for instance in the animal populations such as ant colonies or in connection with the emergence of consciousness.”
Further studies have identified that we are really dealing with biological responses that originate in the most primitive segment of the human brain, the limbic region or reptilian/primitive region, which drives the unconscious, non-rational herding we see in the financial markets.
So, maybe you can now begin to understand why Alan Greenspan commented as he did. Even more surprisingly, and along the lines of our discussion above, he also noted the following:
“I always believed in animal spirits. It's not their existence that is new. It's the fact that they are not random events, but actually replicate in-bred qualities of human nature which create those animal spirits.”
I want to now introduce the work of Ralph Nelson Elliott, who identified that these unconscious, non-rational reactions in the finance markets follow a repeating fractal pattern, which means they move in variably self-similar patterns. This repeating fractal represents overall societal sentiment which is governed by the natural law of the universe as represented through Fibonacci Mathematics.
To be clear, it’s not the patterns that drive society, but rather the social mood of society en masse is displayed through these fractal patterns we see in the market.
As Elliott noted:
“Very extensive research in connection with . . . human activities indicates that practically all developments which result from our social-economic processes follow a law that causes them to repeat themselves in similar and constantly recurring series of waves or impulses of definite number and pattern.”
He further stated:
“The causes of these cyclical changes seem clearly to have their origin in the immutable natural law that governs all things, including the various moods of human behavior. Causes, therefore, tend to become relatively unimportant in the long-term progress of the cycle. This fundamental law cannot be subverted or set aside by statutes or restrictions. Current news and political developments are of only incidental importance, soon forgotten; their presumed influence on market trends is not as weighty as is commonly believed.”
Moreover, when Elliott tied these movements to Fibonacci ratios, he noted:
“These [Fibonacci] ratios and series have been controlling and limited the extent and duration of price trends, irrespective of wars, politics, production indices, the supply of money, general purchasing power, and other generally accepted methods of determining stock values.”
Most specifically, Elliott theorized that public sentiment and mass psychology move in 5 waves within a primary trend, and 3 waves within a counter-trend. Once a 5 wave move in public sentiment has been completed, then it is time for the subconscious sentiment of the public to shift in the opposite direction, which is simply the natural cycle within the human psyche, and not the operative effect of some form of “news.”
Now, with all that being said, maybe you can now understand why I stated at the start that it really makes no difference to the stock market who wins in November. Rather, it seems that the market is completing a very large multi-decade bull market, and will soon be transitioning into a very long-term bear market.
You can see an example of a standard Elliott Wave fractal pattern in this chart below.
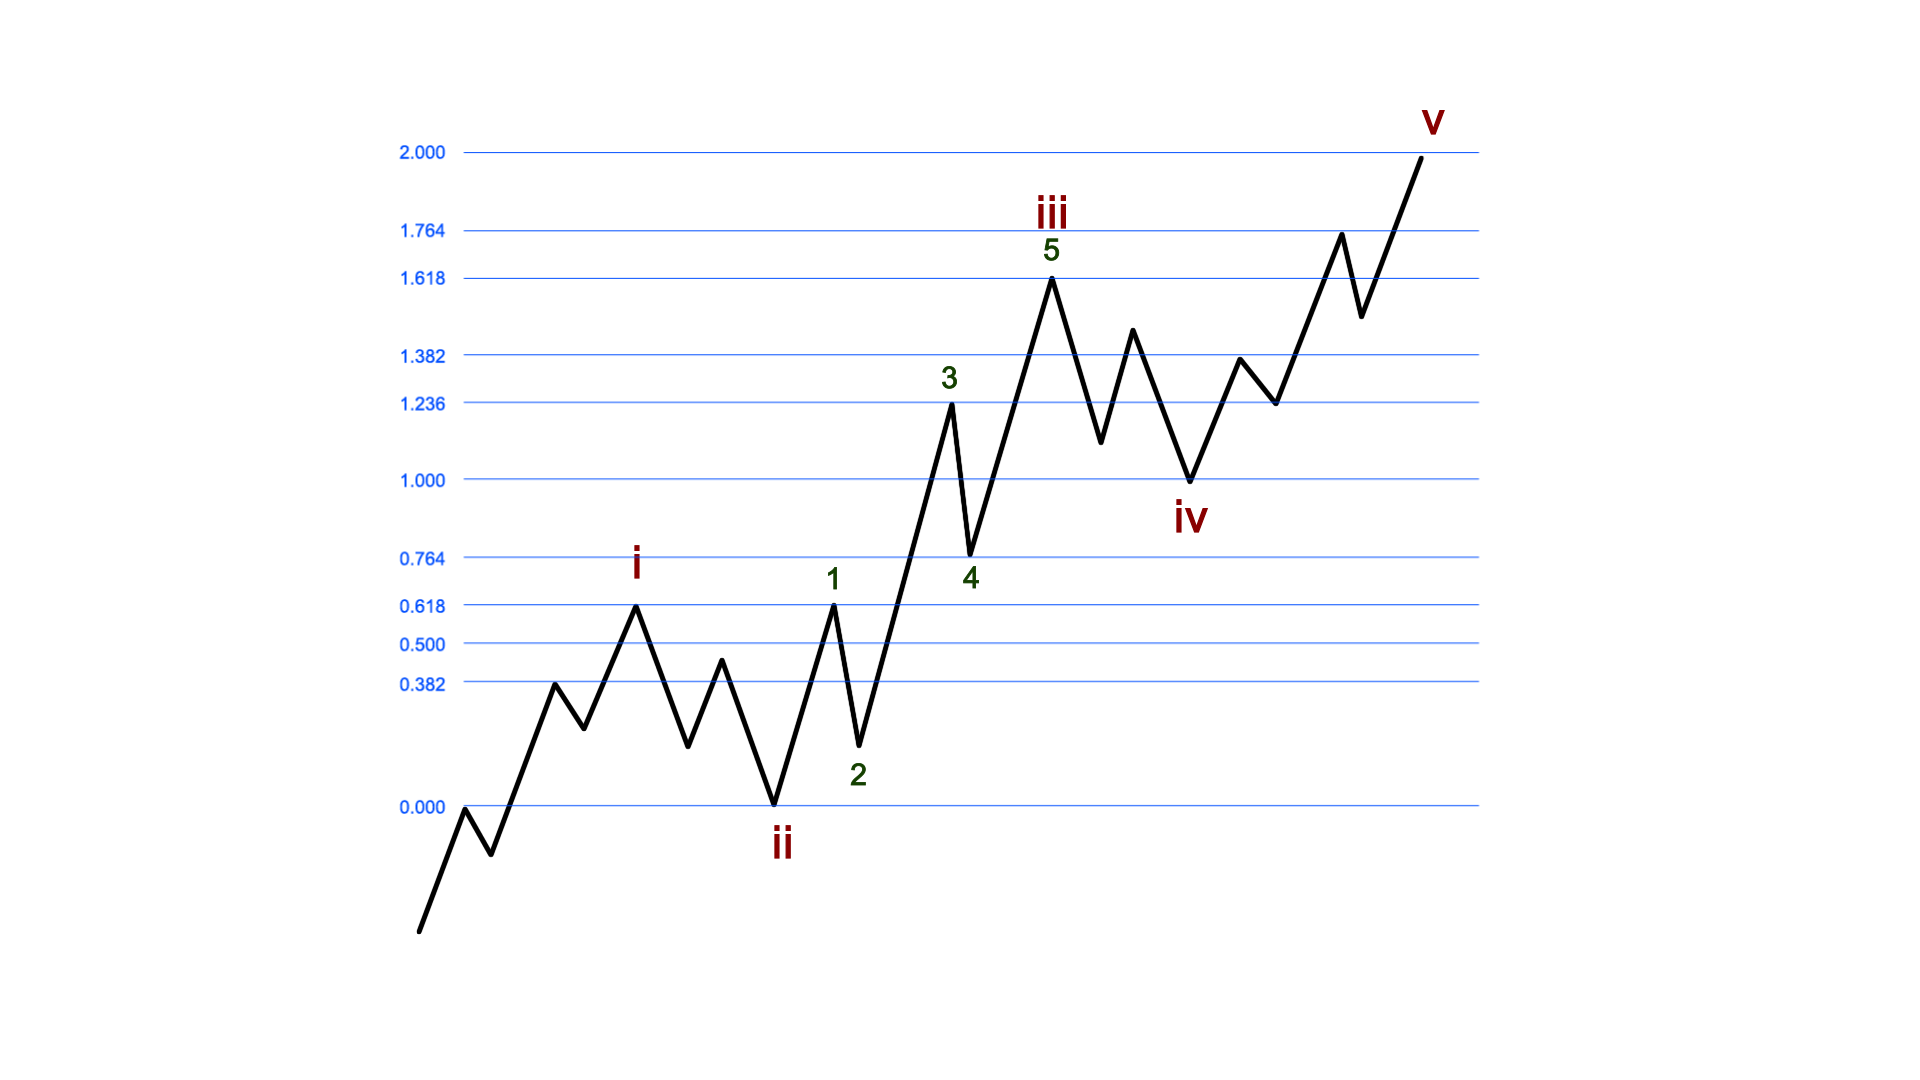
Take note that waves 1, 3, and 5 move in the direction of the general trend, and waves 2 and 4 are counter-trend moves. Moreover, take note that waves 1, 3, and 5 further break down into 5-wave structures, whereas the corrective, counter-trend moves of waves 2 and 4 break down into 3-wave structures.
The rally I am tracking as nearing completion is one that began at the lows struck after the 1929 stock market crash. That was the larger degree 2nd wave low, which, when struck, saw the market turn up at the start of a multi-decade bull market representing a 3rd wave, which is what I am seeing nearing completion.
You can see the bigger picture in this chart, which was put together by Garrett Patten at Elliottwavetrader.net.
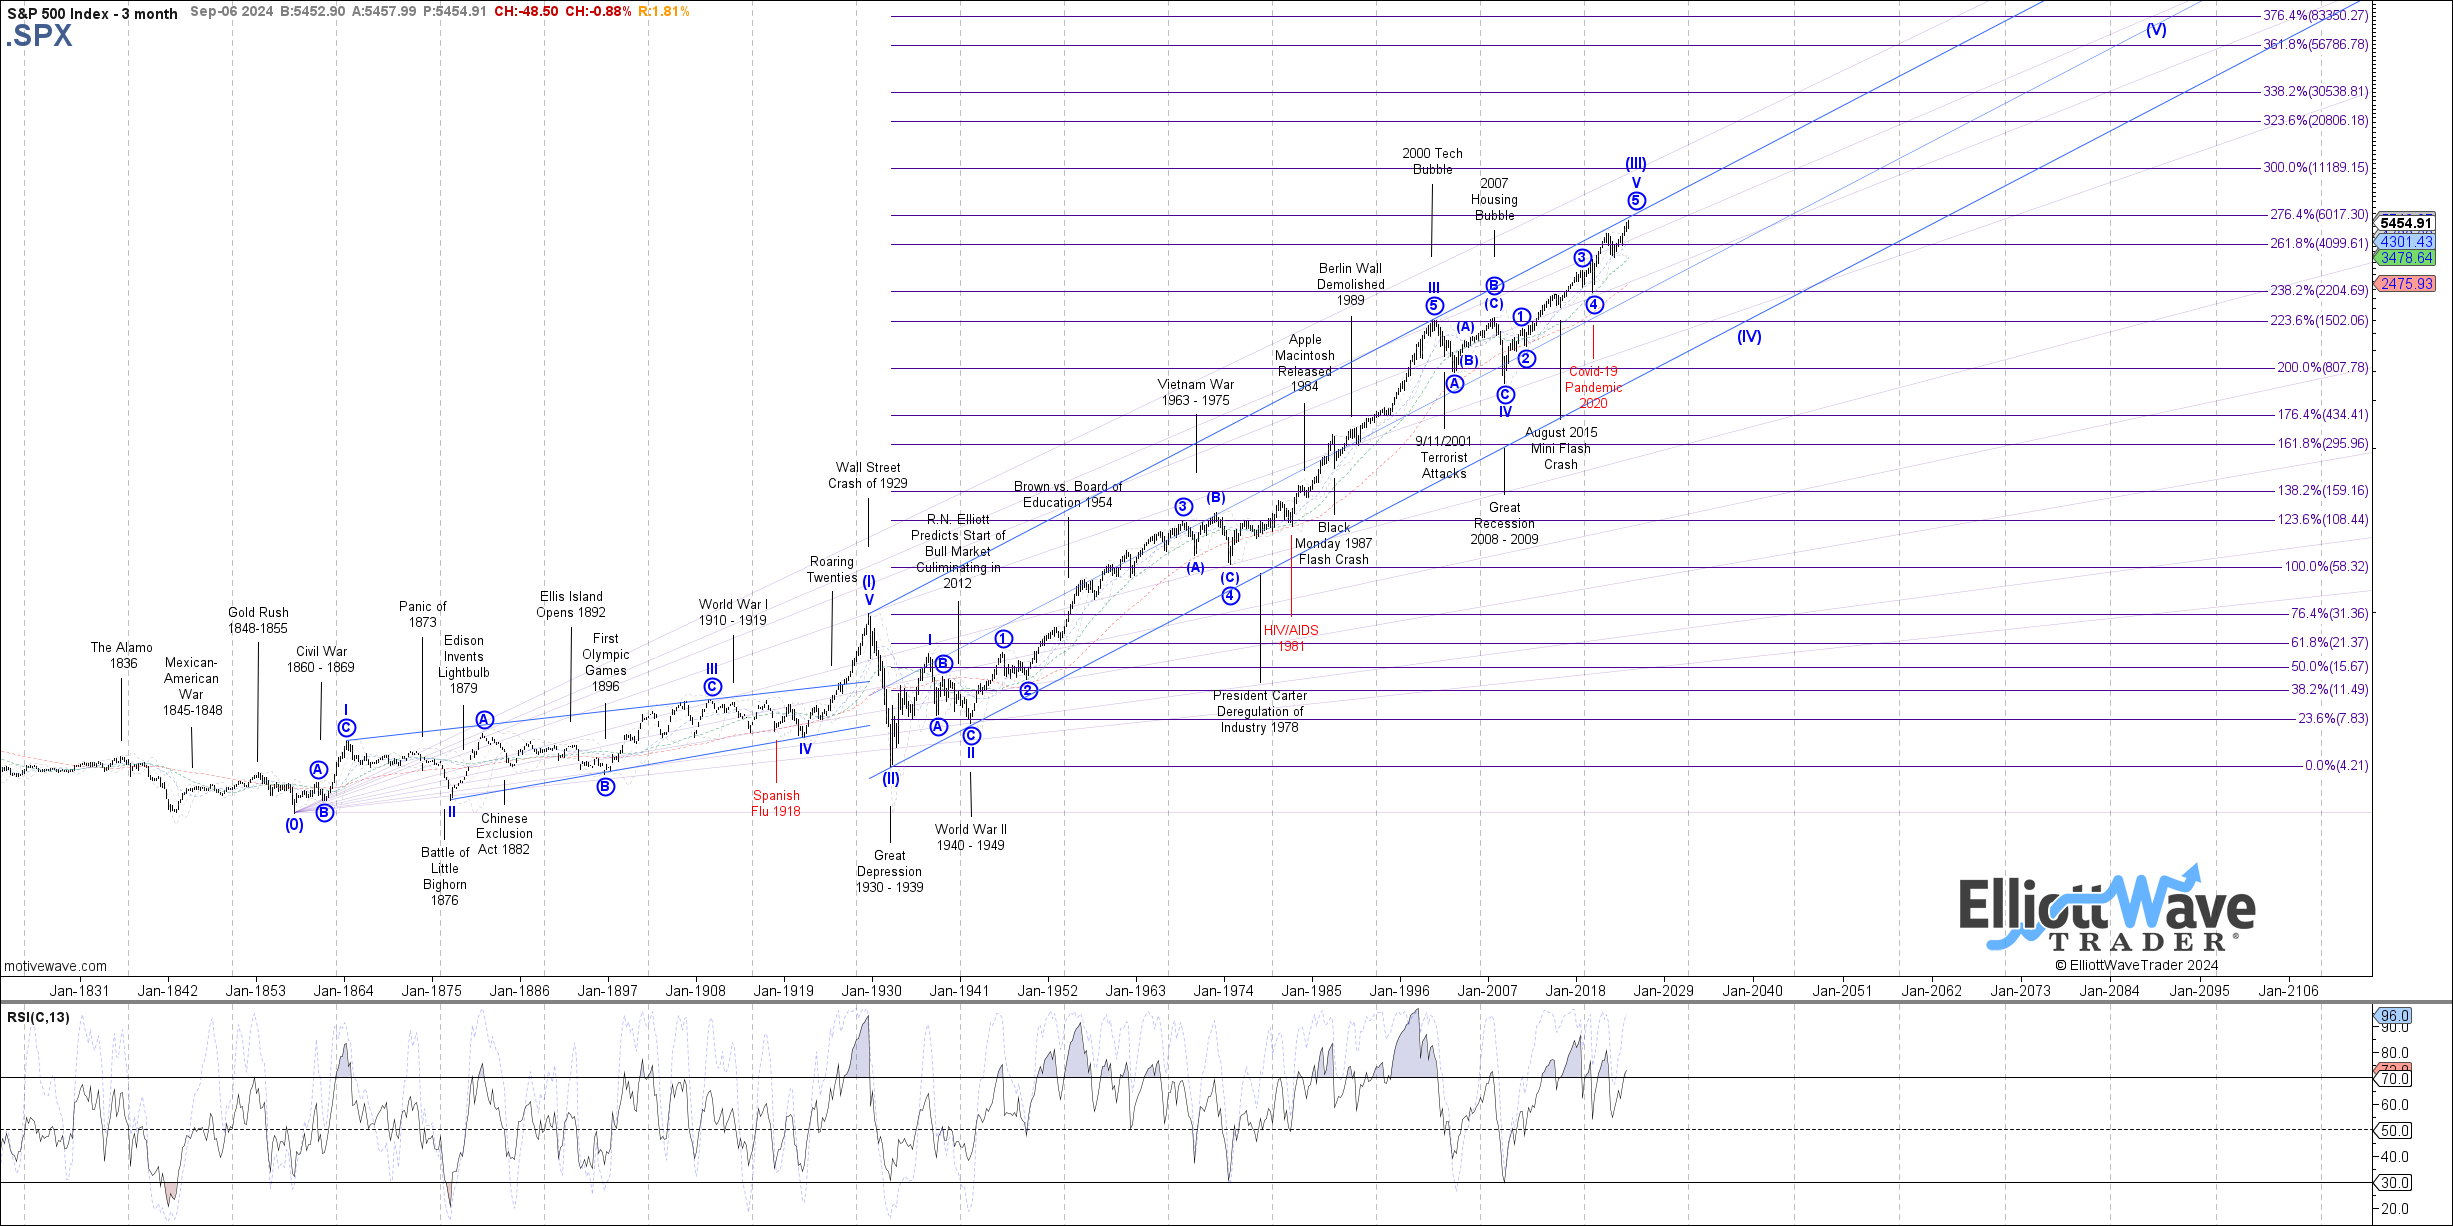
Since I was trained as a CPA and tax lawyer, that means that one of my talents includes the ability to count to 5. Therefore, I know quite well what comes after we complete this 3rd wave. Yes, my friends, this is the reason I am expecting a large 4th wave counter-trend correction within the larger cycle.
I will not bore you with the many technical reasons we view the 4th wave structure and decline as we have presented on the 100-year chart above, but we expect it to take between 13-21 years, and potentially take the S&P500 back down to the 1000 region if we see it develop to its standard maturity. And, unlike the 1929 correction, it will not likely be a straight line, single crash-like move down over a relatively short period of time. Rather, it will take a much longer period of time, and see many smaller “crashes” along with many multi-year corrective rallies in between the smaller crashes, quite similar to multiple periods such as that seen during 2000-2009.
So, yes, ladies and gentlemen, this would be the longest correction we have seen in the stock market in over 100 years. And, that is why I think we may hear this called the “Great-er Depression” by the time it reaches its conclusion.
And, as I started this article, this will not be based upon who will be moving into the White House in January of 2025.
For those who doubt our ability to identify these larger degree moves in the stock market, allow me to give you just a few examples of our past larger degree analysis. As there are many to choose from, I am posting the ones cited by our clients as some of our most astounding multi-year market calls across many markets:
- July 2011: Called for a rally in DXY from 73 with a target of 103.53 while the Fed was pumping QE into the market and everyone was expecting a dollar crash. The market rallied initially to a high of 103.82 before a multi-year pullback, as we expected.
- August 2011: Called for a major top to the gold market at $1,916 while gold was still within its parabolic rally that summer. We also noted our downside expectation of $1,000. As we now know, gold topped within $6 of our target, and then dropped to $1,050 at the end of 2015, when we told our clients it was time to get back in.
- December 2015: Called for a market top in the 2100SPX region, to be followed by a pullback towards 1800, and followed by a "global melt-up" to at least 2600SPX "no matter who gets elected" in 2016. The market bottomed at 1810 and began a strong rally to 2872.
- November/December 2019: Called for a 30% correction to begin in the first quarter of 2020 before anyone even heard the word “Covid.” We began the “Covid Crash” in February of 2020. We were then looking for a major market bottom at 2200SPX, with an expectation of a rally to at least 4000SPX (with our long-term target being 5350-6000) - despite the world being in economic lockdown at the time. The market bottomed within 13 points of our target and we know where we are now.
And, as I noted above, there are many more such examples, but I did not want to overwhelm you. Needless to say, none of our market calls were based upon who was running the country at the time, nor was it based upon any exogenous factors whatsoever. Rather, they were based upon the analysis methodology provided to us by Mr. Elliott, upon which we improved with a more objective framework we developed called Fibonacci Pinball. At the end of the day, we are tracking societal sentiment utilizing an objective mathematical methodology, which has provided a much more accurate manner of tracking financial markets than any exogenous factor analysis.
Now, I know some of you may still have questions about how these exogenous factors “seem” to be driving the market at times. Well, we view these factors as simply potential catalysts to the moves that are driven by sentiment, but the substance of these catalysts is not determinative of the direction of the market move. Now, if you want to question whether they are the actual cause rather than a catalyst, consider how many times you have seen the market move in the exact opposite manner you would have expected based upon some exogenous factors such as earnings, economic news, the Fed, geo-political news, etc.
Let me give you two fairly recent examples.
In October of 2022, the market was awaiting the announcement of a CPI report which everyone believed was going to drive the next 5%+ move in the market. Of course, if it came in worse than expected, everyone was certain it would drive the market 5%+ lower. Our analysis suggested at the time that we were striking at the bottom at 3500SPX, with an expectation for a rally to at least the 4350+ region “no matter what the report said.” Well, we all know the report came in worse than expected and triggered a 6% rally that day alone off the intra-day low, which also kicked off the multi-year rally we still find ourselves enjoying.
Another example was when Russia invaded Ukraine on February 24th, 2022. While most were expecting the market to crash upon this news, we were expecting the market to bottom. And, if you look at a chart, you will see the market struck a near-term bottom on that exact day and began a 13% counter-trend rally.
Again, I can provide many more examples through history, but I think these should be sufficient to outline my point.
At the end of the day, I believe that whoever is heading the United States over the coming years will likely be seen as an ineffective President, since they will be fighting the overall social sentiment which will likely turn quite negative, and will likely cause a strong downturn which will begin a multi-year, and potentially multi-decade, bear market.
About the author
