
"I see no reason why 1931 should not be an extremely good year."
—Alfred P. Sloan, American business executive in the automotive industry, President & CEO
General Motors; 1875–1966
“We are now speeding down the road of wasteful spending and debt, and unless we can escape, we will be smashed in inflation”.
—Herbert Hoover, American politician, engineer, 31st president of the United States 1929-1933, Republican Party; 1874–1964
“How can you frighten a man whose hunger is not only in his own cramped stomach but in the wretched bellies of his children? You can’t scare him – he has known a fear beyond every other.”
—John Steinbeck, American writer, Nobel Prize in literature 1962, author The Grapes of Wrath, Of Mice and Men, East of Eden, and many more; 1902–1968
Depression, or no depression; that is the question. Who said we are in a depression? We are not even in an official recession. A technical recession, yes. But until the National Bureau of Economic Research (NBER) and the Bureau of Economic Analysis (BEA) weigh in and officially call it a recession, you won’t hear the word “recession” being uttered by either Fed Chair Jerome Powell or President Joe Biden.
However, Jim Rickards’ latest book, called, appropriately, The New Great Depression, is already a best seller (came out January 2021). Rickards, a lawyer, author, economist, investment banker, and media commentator, believes we’ve been in depression-like conditions since the financial collapse of 2008. So, what is a depression? Well, there is no good definition of what a depression is, other than a prolonged period of sub-par negative GDP growth accompanied by high unemployment.
“It’s a recession when your neighbour loses his job. It’s a depression when you lose yours.”
—Harry S. Truman, American politician, 33rd president of the United States 1945–1953, Democratic Party; 1884–1972
How can it be a recession, let alone a depression, when you currently have a number of positives in the economy? Right now, we’re seeing low unemployment (see “Chart of the Week”, U.S. job numbers), a robust labour market with a huge number of job openings, wages slowly starting to catch up to inflation, banks far less leveraged, thanks to new capital requirements following the 2008 financial crisis, $trillions in savings, a generally strong corporate base despite the recent wavering of the tech companies, and, recently, even moderating commodity prices.
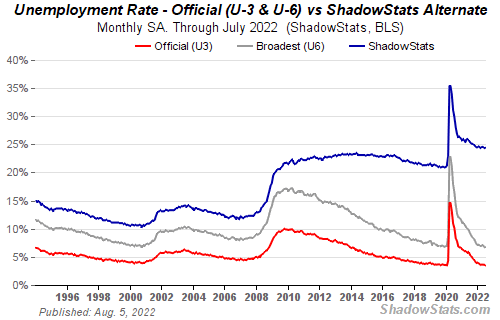
Maybe it’s a question as to which numbers you’re reading—the official numbers or Shadow Stats (www.shadowstats.com) numbers. Officially, the unemployment rate is 3.5%, but the Shadow Stats unemployment rate is 24.4%, depression-like numbers. Officially, U.S. GDP grew 2.5% year-over-year to the end of Q2. Shadow Stats calculates it as contracting 2.6%. Officially, inflation is reported as 9.1%, while Shadow Stats says 17.3%.
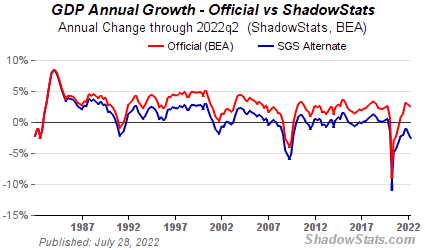
Source: www.shadowstats.com
The SGS-Alternate GDP reflects the inflation-adjusted, or real, year-to-year GDP change, adjusted for distortions in government inflation usage and methodological changes that have resulted in a built-in upside bias to official reporting. By the SGS definition, since we first entered into a recession in Q2 2001 we have had periods of sporadic growth only. First, from Q3 2003 to Q4 2006, and then again in a very choppy manner from Q2 2010 to Q4 2019. Otherwise, we’ve had ongoing economic contractions. The U.S. economy continues to sputter below 1% and, according to the SGS, is spending more time contracting than it is growing. Similar adjustments in the way either GDP, unemployment, or inflation are calculated and reported have tended to give either upward bias (GDP, inflation) or downward bias (unemployment) to the numbers from the way they used to be calculated. The SGS takes the bias out.
Let’s not even look at the EU or Japan, which has been sputtering along ever since 1990. Strong growth over this period was usually seen in emerging economies, or in China and other Asian economies. Now even China and other Asian economies are slowing. In the U.S., hourly wages have generally lagged inflation and inequality has grown to huge proportions. Obscene wealth is seen beside extreme poverty. Over the years the U.S. Gini coefficient, a measurement of wealth and poverty, has been rising. At 48%, the U.S. is about on par with a number of Latin American countries well known for their income inequality. Amongst OECD countries, the U.S. ranks third in terms of poverty rates, behind only Hungary and Costa Rica (2019 numbers).
There are an estimated 724 billionaires in the U.S., led, of course, by Elon Musk—his wealth is estimated at $271 billion, about the size of Portugal. Half of the world’s billionaires live in the U.S. or China. There are billionaires who are worth more than entire countries. It’s no surprise that they exercise powerful political influence, no matter which country they reside in. It doesn’t matter whether it’s the in U.S., China, or in Russia or Ukraine where they are called oligarchs. They are powerful, not elected, and exert undue influence on politics.
U.S. Average Hourly Earnings Growth vs. U.S. Inflation Rate 2012–2022
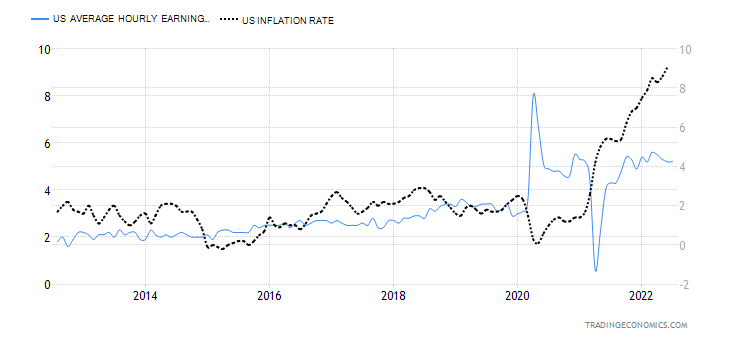
Source: www.tradingeconomics.com, www.bls.gov
The Great Depression actually consisted of two collapses with a huge rally in between. From September 1929 to July 1932 the stock market fell 89%. A rally got underway that topped in March 1937. The gain: 370%. What followed was a series of ups and downs that didn’t finally bottom until April 1942. The decline was 52% overall but it consisted of three collapses and two rallies in between. Based on official figures, the first phase of the Great Depression saw GDP contract 26.7% and unemployment peak in 1933 at 24.9%. The first phase
lasted from August 1929 to March 1933. The second phase got underway in May 1937 and, officially, lasted only until June 1938. GDP contracted 18.2% while unemployment rose to 19%. However, most of the population probably didn’t notice a lot of difference throughout the 1930s, even when the stock market was rallying.
Officially, for the record, the 2007–2009 Great Recession saw the stock market fall about 54% (DJI) while GDP contracted 5.1% and U.S. unemployment topped out at 10%. Also, during this period, Shadow Stats alternate unemployment rose from 12.7% in December 2007 to 21.5% by June 2009, the official end of the Great Recession. While official unemployment (U3) came down to 3.5%, Shadow Stats alternate unemployment never once went back under 20%. In February 2020, at the start of the pandemic recession, the SGS unemployment rate was 21.3%. Now it is 24.4%.
The pandemic recession was short-lived, cut as it was by the most massive bailout of QE ever seen. Official unemployment jumped to 14.7% while the economy contracted 19.2%. But it only lasted two months. For Shadow Stats unemployment peaked at 35.5%. GDP has never been positive since. The question might be, have we caught the Japanese disease of ongoing low growth, punctuated by periods of some growth, followed quickly by periods of negative growth? Since 1990, Japan has averaged barely 1% growth and always seems to be in a perpetual recession.
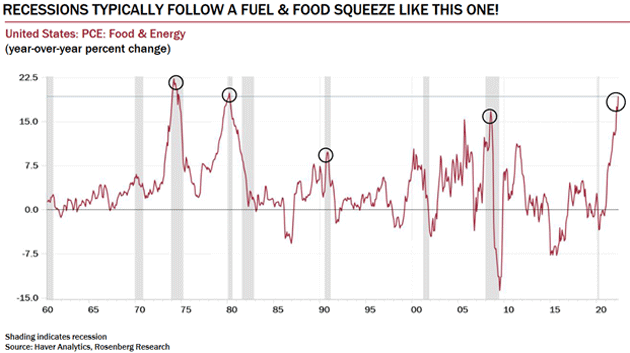
Source: www.haver.com, www.rosenbergresearch.com, www.mauldineconomics.com
This time around, central banks and governments are faced with a different kind of problem. The war in Ukraine, coupled with supply disruptions sparked by the pandemic, has now unleashed the highest inflation since the 1970s. There is only one way of this dilemma: squeeze inflation by hiking interest rates until inflation starts to come down again. However, the odds of that happening soon are slim to none, despite commodity prices falling recently, especially oil. The question is, how hard does the Fed (and other central banks) have to squeeze the economy to bring down inflation? Mass layoffs? The high-tech industry has already started laying people off. It is noted that productivity is lagging, contributing to labour problems. How to increase productivity? High inflation is already starting to squeeze consumers and bring down housing prices. House sales have plummeted and prices are starting to soften. Consumer confidence is at its lowest level since the early 1980s.
But the Fed can do nothing about the war in Ukraine. The danger is that it escalates further and NATO gets dragged in (and in many ways they already are). High gas prices are squeezing consumers, but the roads are busy and there appears to no major rush to electric cars and dropping huge SUVs for mini-cars. In many ways, gas today is no more expensive than it was in the late 1970s, adjusted after inflation. The Fed can’t do anything about the escalating tensions around Taiwan. War with Taiwan could cut off upwards of 66% of the global semiconductor market and spark even worse supply disruptions than we are currently experiencing. China is an engine of global economic growth and they depend on exports. So, war, in some respects doesn’t make any sense. Irrespective, none of that would bring down inflation. Instead, it could escalate further, requiring even higher interest rate hikes.
And, lest we forget, climate change is causing massive disruptions and is increasingly costly, ultimately costing $trillions, regardless of whether we do something or not. There has been a sharp rise in billion-dollar plus natural disasters. Many believe we have already passed the point of no return regarding climate change. Witness the heat waves in Europe and the U.S., as well as in China, India, and elsewhere. Out of control wildfires are displacing thousands, droughts threatening millions, and elsewhere too much rain and floods are also disrupting transportation, and causing death and destruction. So far, the hurricane season has been slow to start. But it could escalate. More volcanoes are erupting and earthquakes always remain a threat.
Our chart above, courtesy of Maudlin Economics and Rosenberg Research, shows how rising food and fuel prices have preceded almost every recession since the 1960s. A recession would appear to be unavoidable. The question is, how deep? Short and mild? Or long and deep? Many are hoping for the former. It’s the latter they may very well get. The Fed is not about to let up on its interest rate hikes as they realize they have to squeeze high inflation out of the economy. The question is, how much pain are they willing to inflict? How high is acceptable for unemployment? How deep a contraction is acceptable monetarily and particularly for governments? QE has added trillions. M2 is up $13.5 trillion since 2008 or 178%. The Fed’s balance sheet has exploded, up 875% or almost $8 trillion. Do they have any more room to expand? Or have all the bullets been spent?
Chart continues on next page
Growth of Fed Assets and M2 2008–2022
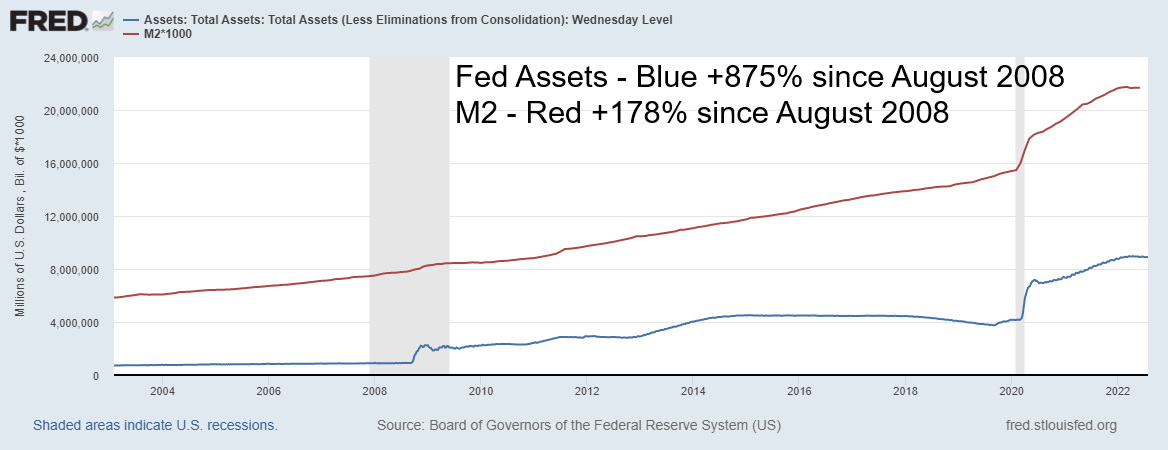
Source: www.stlouisfed.org
So where has all this money gone? Personal savings are up only about $563 billion in the same time frame as above, or about 148%. While the personal savings rate soared to about 35% at the height of the pandemic in April 2020, it now sits at 5.1%. That’s still above the 3.5% seen in 2008. Money is not turning over in the economy. The velocity of M2, which was 1.9% back in 2008, has now fallen to 1.1%. That tells us that turnover of money in the economy has fallen sharply. Personal consumption expenditures are up only $6.9 trillion since 2008 or roughly 68%, but when adjusted for inflation they are up only $3.2 trillion or 32%. Real personal disposable income is up only 31%. Retail sales are up only 78% since 2008, reflected in the huge drop in the velocity of money (M2).
The accusation is that monetary expansion is inflationary. That’s correct and the massive increase in money supply (M2 with M1 up even more), coupled with the sharp jump in the Fed’s balance sheet, has contributed to inflation by putting too much money into the economy—which then chases too few goods, thus sparking higher inflation. It also sparked bubbles: stocks, housing, and more. But other factors are beyond the control of the Fed.
The yield curve has inverted and is now at its lowest level since the period before the 2007–2009 Great Recession. Economists are downgrading their predictions for growth. Globally, they are now expecting only 2% growth, which is effectively a recession. The IMF is warning that inflation and war are pushing the global economy to the brink. Keep an eye on Purchasing Managers Indexes. While many are not quite below a 50 reading, many more sit on the brink of falling under that level, indicating a recession. Commodity prices have slipped lately and copper, often a harbinger of recession, remains down, roughly 22% in 2022. While oil prices have fallen, another spark in the Russia/Ukraine war could spike them once again. Typically, oil prices are softer during the summer period and don’t perk up again until later in the year. Junk bond yield spreads have been widening faster than any other grade of bonds. Citigroup’s Economic Surprise Index has been falling steadily and is approaching recession levels. Consumer sentiment is as low as it has ever been. Debt is at record levels. A reckoning appears to be unavoidable.
U.S. 2–10 Yield Curve Inverts Before Recessions 1976–2022
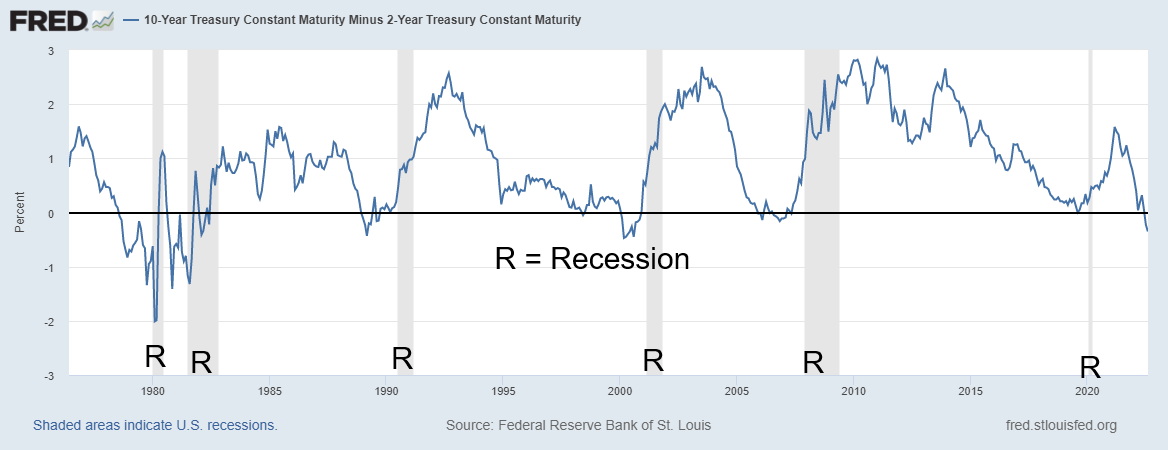
Source: www.stlouisfed.org
Chart of the Week
U.S. Job Numbers
Source: www.shadowstats.com
Well, that was a surprise. U.S. nonfarm payrolls jumped an unexpected 528,000 in June when the market had expected a gain of only 250,000. The increase was also larger than June’s nonfarm payrolls, a gain of 398,000. That’s a whopping 926,000 jobs in two months. Finally, the U.S. has overtaken employment seen in February 2020 when nonfarm employment was 152,504 thousand vs. 152,536 thousand now. It took only 29 months. Canada had already long surpassed its employment levels of February 2020. Helping things along was the unemployment rate (U3) falling to 3.5%, down from 3.6% and wage growth up 5.2% year-over-year (+0.5% for July). Wage growth was also above the expected 4.9%. A reminder, however, that the last reported inflation was 9.1%. Wages still lag inflation and are flatlining in terms of gains.
But should we really be excited about these numbers? Dig a little deeper. The civilian labour force actually contracted, falling 63,000 (163,960 thousand July vs. 164,023 thousand June) and remains below February 2020 levels of 164,583 thousand. The labour force participation rate fell to 62.1% vs. 62.2% and 63.4% in February 2020. Fewer people participating helps lower the unemployment rate. The employment population ratio rose to 60% from 59.9% vs 61.2% in February 2020. The number of people employed full-time actually contracted by 71,000 while the number of part-time workers increased 384,000. Private sector employment is higher by 629,000 than in February 2020, but government sector employment is down by 597,000 jobs from February 2020. That’s despite a 57,000 increase for government sector jobs in July.
While the U3 unemployment rate (the officially reported unemployment rate) was lower, down 3.5% from 3.6%, the U6 unemployment rate was unchanged at 6.7%. (U6 is U3 plus short-term discouraged workers under one year and marginally attached workers working part-time who want full-time.) The Shadow Stats number (U6 plus discouraged workers over one year and those defined out of the work force in 1994 and no longer included in the BLS numbers) (www.shadowstats.com) was 24.4% vs. 24.3%. For the record, while U3 is at levels seen in February 2020, the U6 number then was 7% vs. 6.7% today and the Shadow Stats number was 21.3% vs. 24.4% now. What that appears to show is that things are actually not as good today as they were then.
Average Hourly Earnings and U.S. Inflation Rate 2017–2022
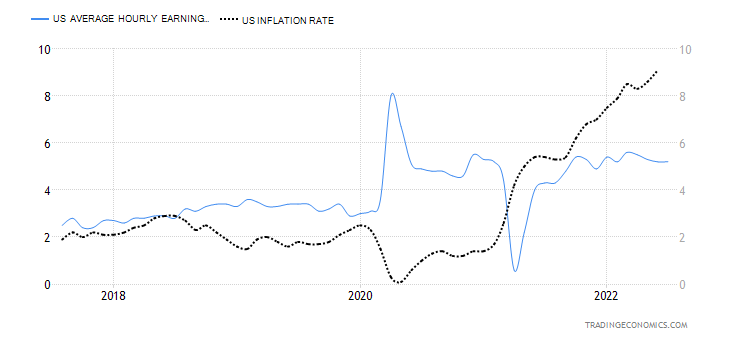
Source: www.tradingeconomics.com, www.bls.gov
In the mainstream press, the pundits praised the hot job market. Some said the labour market is on fire. Now the question is, how can there be a recession? There have been a number of announcements recently of tech companies in particular announcing layoffs. But then nonfarm payrolls went up, not down. Could there be a lag? The weekly employment claims jumped to 260,000 this past week. While that was about as expected, the number has been rising steadily for the past three months.
Unemployment is low and there are over 10 million job openings. But people are not returning to the labour force as witnessed by the lower labour force participation number at 62.1% vs. 63.4% in February 2020. Long COVID has impacted many an estimated 4 million workers according to some estimates; boomers have retired taking their pensions and existing the labour force; many who worked previously now have to care for aging parents and others; employers are hiring, not firing, but many employees are quitting for jobs elsewhere paying more. Unemployment is a lagging indicator. The unemployment rate bottoms before the recession is officially declared. Note the chart below. The arrows indicate the low in unemployment. Not long after the recession follows.
Unemployment Rate 1949-2022
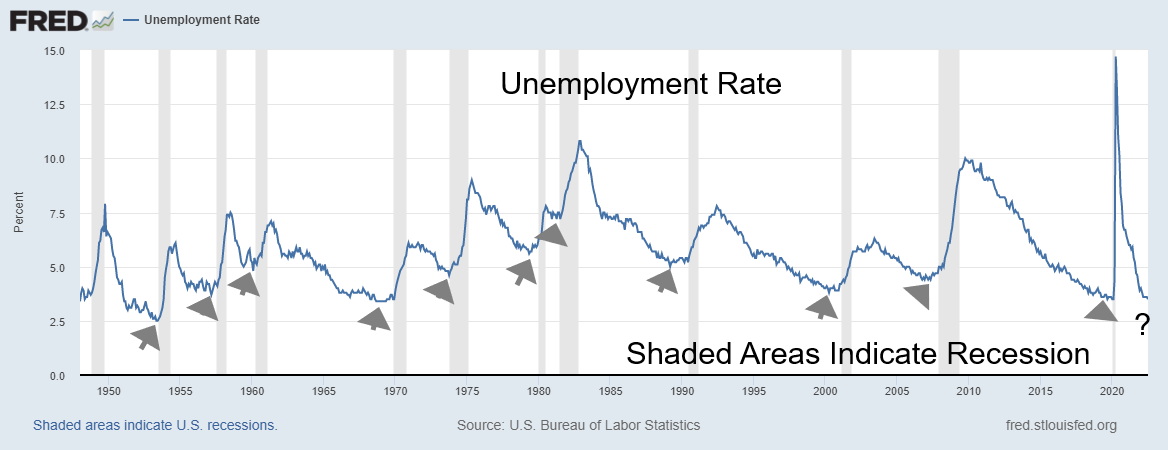
Source: www.stlouisfed.org
The stronger than expected jobs number is now having some suggest that the Fed will raise rates another 75 bp in September. That’s up from the previous expectation of a 50 bp hike. There were also hints the Fed would raise 25 bp in November and December to bring the rate to 3.5%. That’s still well below the rate of inflation currently, last at 9.1%. However, the inflation rate should moderate, given the recent decline in commodity prices including oil.
Should we be excited about these job numbers? Maybe not as much as some, including the Fed, are gushing about. If the U.S. were creating jobs at the same pace as they were before the 2020 pandemic, there would be at least 5–6 million more jobs created. It’s also concerning that the civilian labour force is actually declining. The working age population that includes seniors is up over 5 million since February 2020, but the civilian labour force has fallen by over 600 thousand. That doesn’t make sense. It should be rising. While the unemployment rate has fallen to the lows of February 2020, the labour force participation rate and the employment population ratio are both lower. What that means is that fewer people are actually working. Meanwhile, the U6 unemployment is lower than in February 2020—6.7% vs. 7.0%—but the Shadow Stats unemployment is actually higher: 24.4% vs. 21.3%. Finally, while the jump was good this past month, the bulk of it was part-time as full-time employment actually fell. It’s strange as well that the number of government employees is down sharply (apparently municipal, in particular, is down sharply), but private sector employment is up, making up the difference.
All this is occurring against the backdrop of the Fed aggressively hiking interest rates and the economy actually contracting in Q1 and Q2. A great report? Hardly.
Canada Job Numbers
Canada Employed Persons/Unemployed Persons 2017–2022
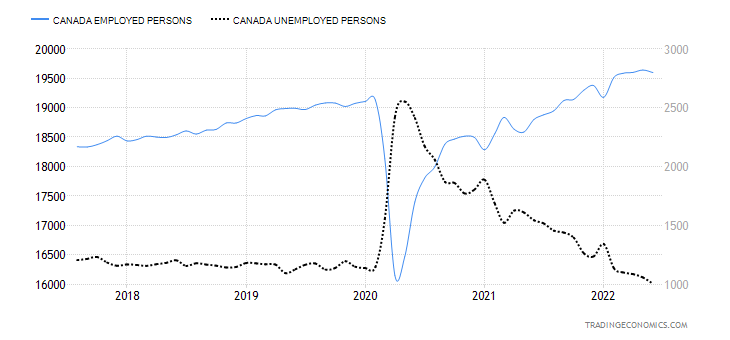
Source: www.tradingeconomics.com, www.statscan.gc.ca
Canada lost 30,600 jobs in July. That was below the expected gain of at least 20,000. The unemployment rate, however, was unchanged at 4.9%, a continued record low. Part-time employment fell 17,500 while full-time employment also fell, down 13,100. The mix was interesting, given government employment fell but self- employment grew. The economy still has roughly one million job vacancies. Oddly enough, one area of decline was in the number of women, both older and of core age, in the workforce. At the same time, employment for older men rose. The loss in jobs was largely confined to Ontario and some in Prince Edward Island while other provinces were largely unchanged. Despite the large number of job vacancies, the match is not necessarily there for the unemployed as their skill levels and experience may not meet the requirements. As well, many women have been forced to drop out to take care of children or elderly parents.
One big jump was seen in the R8 unemployment rate. The R8 rate is the highest reported by Statistics Canada (www.statscan.gc.ca) as it adds in discouraged workers still searching plus involuntary part-time workers. The R8 rate jumped to 7.7% from 6.4%. It was 8.6% in February 2020. Canada’s R8 rate is somewhat equivalent to the U.S.’s U6 rate. If Canada calculated its unemployment rate like the U.S., the unemployment rate would be 4.1% vs. the officially reported 4.9%. That was actually higher than the June rate of 3.7%.
Wages were up 5.2% year-over-year vs. the inflation rate last reported of 8.1%. Despite the number of job openings, there is little sign of people switching jobs or just outright leaving. The labour force participation rate
actually fell to 64.7% from 64.9%. That helps keep a lid on the official unemployment rate. Canada surpassed the February 2020 level of employed persons late last year vs. the U.S. just surpassing it now. Despite the job loss this past month, Canada continues to outperform the U.S. Most of the job losses were in the public sector, as we noted earlier.
None of this report is liable to change the direction of the Bank of Canada (BofC) and we should continue to expect more rate hikes in upcoming meetings. The next scheduled meeting is September 7. A rate hike of at least 50 bp is expected.
Markets & Trends
|
|
|
|
% Gains (Losses) Trends
|
|
||||
|
|
Close Dec 31/21 |
Close Aug 5/22 |
Week |
YTD |
Daily (Short Term) |
Weekly (Intermediate) |
Monthly (Long Term) |
|
|
Stock Market Indices |
|
|
|
|
|
|
|
|
|
`S&P 500 |
4,766.18 |
4,145.19 |
0.4% |
(13.0)% |
up |
down (weak) |
up (weak) |
|
|
Dow Jones Industrials |
36,333.30 |
32,803.47 |
(0.1)% |
(9.7)% |
up |
down (weak) |
up (weak) |
|
|
Dow Jones Transports |
16,478.26 |
14,601.05 |
(0.1)% |
(11.4)% |
up |
down (weak) |
up (weak) |
|
|
NASDAQ |
15,644.97 |
12,657.55 |
2.2% |
(19.1)% |
up |
down (weak) |
neutral |
|
|
S&P/TSX Composite |
21,222.84 |
19,620.13 |
(0.4)% |
(7.6)% |
up (weak) |
down |
up (weak) |
|
|
S&P/TSX Venture (CDNX) |
939.18 |
664.17 |
2.8% |
(29.3)% |
up |
down |
down (weak) |
|
|
S&P 600 |
1,401.71 |
1,239.40 |
(0.1)% |
(11.6)% |
up |
down |
up (weak) |
|
|
MSCI World Index |
2,354.17 |
1,977.66 |
1.3% |
(16.0)% |
up |
down |
down (weak) |
|
|
NYSE Bitcoin Index |
47,907.71 |
23,227.94 |
(3.9)% |
(51.5% |
neutral |
down |
neutral |
|
|
|
|
|
|
|
|
|
|
|
|
Gold Mining Stock Indices |
|
|
|
|
|
|
|
|
|
Gold Bugs Index (HUI) |
258.87 |
204.73 |
(1.3)% |
(20.9)% |
down |
down |
down |
|
|
TSX Gold Index (TGD) |
292.16 |
240.20 |
0.7% |
(17.8)% |
down |
down |
down |
|
|
|
|
|
|
|
|
|
|
|
|
Fixed Income Yields/Spreads |
|
|
|
|
|
|
|
|
|
U.S. 10-Year Treasury Bond yield |
1.52% |
2.83% |
6.4% |
86.2% |
|
|
|
|
|
Cdn. 10-Year Bond CGB yield |
1.43% |
2.74% |
5.0% |
91.6% |
|
|
|
|
|
Recession Watch Spreads |
|
|
|
|
|
|
|
|
|
U.S. 2-year 10-year Treasury spread |
0.79% |
(0.41)% (new lows) |
(78.3)% |
(151.9)% |
|
|
|
|
|
Cdn 2-year 10-year CGB spread |
0.48% |
(0.51)% (new lows) |
(45.7)% |
(206.3)% |
|
|
|
|
|
|
|
|
|
|
|
|
|
|
|
Currencies |
|
|
|
|
|
|
|
|
|
US$ Index |
95.59 |
106.49 |
0.7% |
11.4% |
up (weak) |
up |
up |
|
|
Canadian $ |
.7905 |
.7727 |
(1.0)% |
(2.3)% |
neutral |
down |
neutral |
|
|
Euro |
113.74 |
101.82 |
(0.4)% |
(10.5)% |
down |
down |
down |
|
|
Swiss Franc |
109.77 |
103.94 |
(1.1)% |
(5.3)% |
up |
down (weak) |
down (weak) |
|
|
British Pound |
135.45 |
120.73 |
(0.9)% |
(10.9)% |
neutral |
down |
down |
|
|
Japanese Yen |
86.85 |
74.08 |
(1.3)% |
(14.7)% |
up |
down |
down |
|
|
|
|
|
|
|
|
|
|
|
|
|
|
|
|
|
|
|
|
|
|
Precious Metals |
|
|
|
|
|
|
|
|
|
Gold |
1,828.60 |
1,791.20 |
0.5% |
(2.1)% |
neutral |
down |
neutral |
|
|
Silver |
23.35 |
19.84 |
(1.8)% |
(15.0)% |
neutral |
down |
down |
|
|
Platinum |
966.20 |
924.70 |
3.9% |
(4.3)% |
up |
down |
down |
|
|
|
|
|
|
|
|
|
|
|
|
Base Metals |
|
|
|
|
|
|
|
|
|
Palladium |
1,912.10 |
2,128.70 |
(0.1)% |
11.3% |
up |
neutral |
neutral |
|
|
Copper |
4.46 |
3.55 |
(0.6)% |
(20.5)% |
neutral |
down |
neutral |
|
|
|
|
|
|
|
|
|
|
|
|
Energy |
|
|
|
|
|
|
|
|
|
WTI Oil |
75.21 |
89.01 |
(9.7)% |
18.4% |
down |
neutral |
up |
|
|
Nat Gas |
3.73 |
8.06 |
(2.1)% |
116.1% |
up |
up |
up |
|
Source: www.stockcharts.com
Note: For an explanation of the trends, see the glossary at the end of this article.
New highs/lows refer to new 52-week highs/lows and, in some cases, all-time highs.
Source: www.stockcharts.com
What a week. The big question continues to be, are we in a recession or not? The job numbers say no. But two consecutive quarters of negative GDP say yes. Will we have a third quarter of negative GDP? Some believe yes—and, if so, then it will be hard to ignore. Inflation is still rising but could moderate for July, thanks to lower commodity prices (especially for oil). But the Fed is continuing to tighten. They just hiked 75 bp and it could be another 75 bp at the September FOMC, just because of the strong job numbers (even though underneath they weren’t very strong). Otherwise, the Fed will hike at least another 50 bp with a further 25 bp in November and December taking the Fed rate to 3.5%, which seems to be a minimum target for the Fed. And, lest we forget, geopolitical tensions took another hit this week with the ratcheting up of conflict in the Taiwan Straits between China/US/Taiwan. Could China put a blockade on Taiwan, allowing flows between Taiwan and China only? The answer is yes. Taiwan produces upwards of 66% of the world’s chips. It’s a move that could crash the Western economy or at least cause a big problem and a stock market meltdown.
Markets didn’t do much this past week. Maybe it’s a wait and see approach. The S&P 500 gained 0.4% but the Dow Jones Industrials (DJI) fell 0.1%. The Dow Jones Transportations (DJT) rose 0.1% while the NASDAQ jumped 2.2%, thanks to some improvement in the tech sector and the FAANG stocks. The S&P 600 small cap fell a small 0.1%. Elsewhere, Canada’s TSX Composite was down 0.4% but the TSX Venture Exchange (CDNX) gained 2.8%. The MSCI World Index was up 1.3% but the cryptos weakened, with Bitcoin down 3.9%.
In the EU, the London FTSE was up 0.2%, the Paris CAC 40 gained 0.4%, while the German DAX was up 0.7%. In Asia, China’s Shanghai Index (SSEC) lost 0.8% but the Tokyo Nikkei Dow (TKN) gained 1.4%. Strangely, despite all the fireworks with China, the Taiwan Index gained 0.2% as buying came in at the end of the week, grabbing semiconductor stocks.
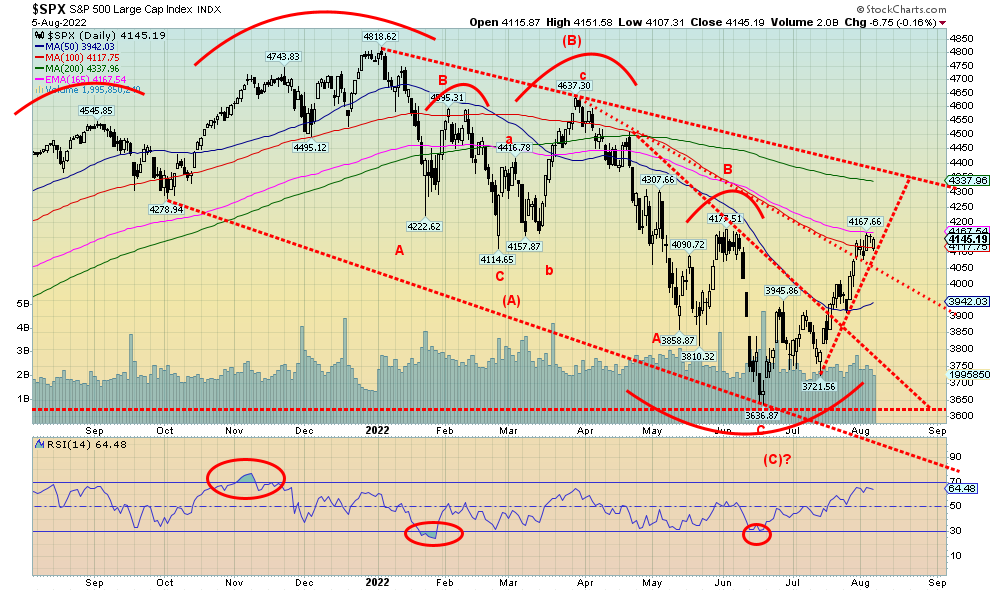
The S&P 500 has cleared one hurdle over a downtrend line and is now at the 100-day MA and the 165-day EMA. A move over 4,200 would set our sights on the 200-day MA near 4,335. That is also the area of a downtrend line off the January high. A move over 4,400 would set up the potential for new all-time highs. The current uptrend is steep, so it would not be a surprise to see a pullback. Given concerns over further rate hikes and rising geopolitical tensions, a pullback would not be surprising. Support is at 4,000 and down to 3,900. Under 3,900 would be a bigger concern. Only a breakdown under 3,750 would suggest we could be headed for new lows. As we go higher, that breakdown point would rise as well.
The S&P 500 has already gained 14.6% from the recent lows. We continue to believe we are forming the B wave of a larger ABC downside pattern. It is not unusual to see B wave rallies that are 20% or more off lows. But then they are followed by an even bigger decline. When we start to see signs of a top, we will be sounding warnings.
Source: www.stockcharts.com
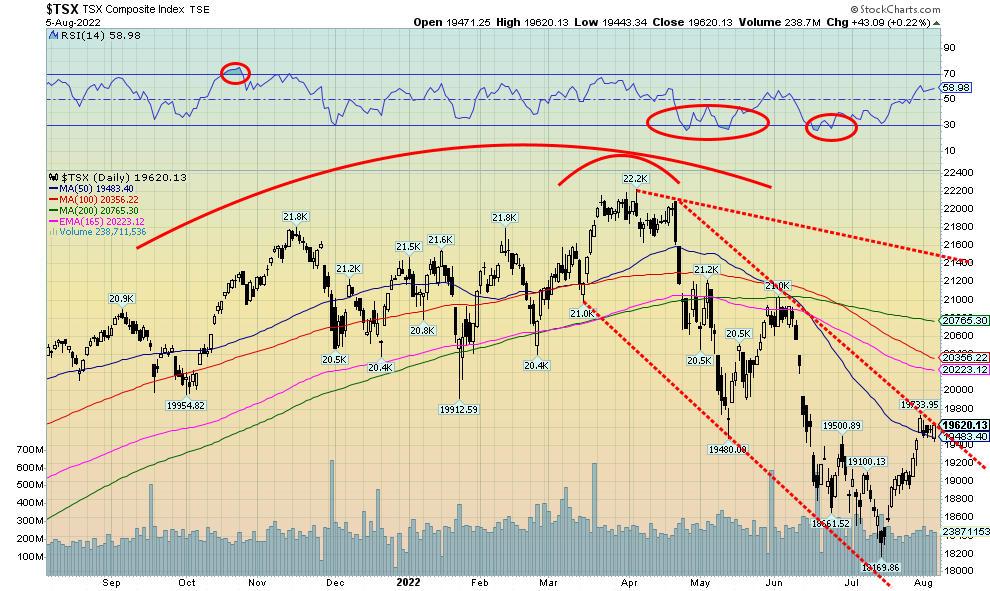
We thought we’d note the TSX Composite this week. The TSX has rallied some 5% or so off the July lows and is now running into downtrend resistance. A move above 19,800 would break the downtrend and set our sights on the 200-day MA near 20,750. We could set our sights on the gentle downtrend line, currently near 21,400. The TSX was actually down this past week, losing a small 0.4%. The TSX Venture Exchange (CDNX) is making some gains (finally) and was up 2.8%. The CDNX is now 14% above its recent low, but we won’t consider the CDNX breaking out until it gets over 740 (currently 664). A move then could get underway to the 200-day MA near 815.
This past week eight of the 14 sub-indices were up on the week, led by Information Technology (TTK) that gained 5.2%. Technically, Health Care (THC) was the leader, up 7.2%, but then THC is not a huge component of the TSX compared to TTK. The leader to the downside (biggest loser) was Energy (TEN), down 8.6%, thanks to lower oil prices.
The TSX has now rallied into trendline resistance and is near the 50-day MA (19,483). A breakthrough would set our sights higher to 20,200 and ultimately up to 20,750 and the 200-day MA. The danger appears if we were to break back under 19,000.
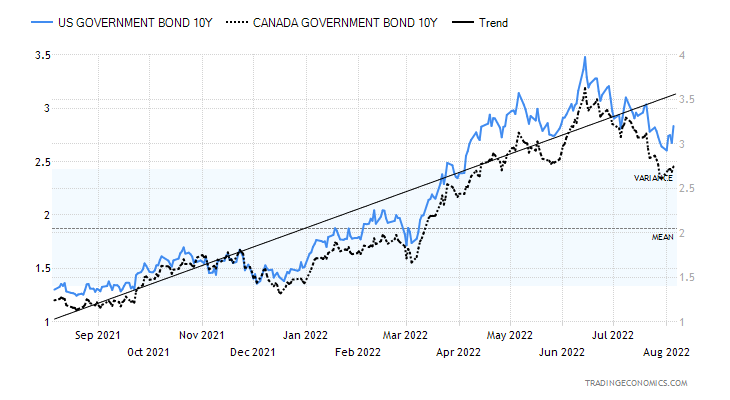
U.S. 10-Year Treasury Note, Government of Canada 10-Year Bond (CGB)
Source: www.tradingeconomics.com
Bonds are being batted back and forth now on whether the U.S. is going to fall into a recession or whether growth is going to continue. The U.S. job numbers on Friday suggested that fears of a recession are overblown. The biggest economic numbers out this coming week are CPI on August 10 and PPI on August 11. CPI is expected to be lower at 8.7%, down from 9.1%. Commodity prices, particularly oil, have been easing and that should help lower the CPI rate. The PPI rate is expected at 10.4% vs. 11.3%. Moderating inflation could help ease the 10-year U.S. treasury note further. Still, this past week the U.S. 10-year jumped to 2.83% from 2.66% and the Canadian Government of Canada 10-year bond (CGB) rose to 2.74% from 2.61%. However, we would not consider the 10-year breaking out higher until it gets over resistance at 3.15%–3.20%. In Canada, it would require the CGB to break out over 3.12%–3.15%.
What should really be focused on is the widening 2–10 spread, now at negative 41 bp in the U.S. and negative 51 bp in Canada. The popular 2–10 spread is predicting a recession that may not become official for another six months. That is irrespective of the technical recession that is already being noted. If Q3 also is negative, they’ll have a hard time saying we are not in a recession. We also noted that, as robust as the job numbers were, underneath they were really nothing to get excited about, and in fact are exhibiting weakness.
Source: www.stockcharts.com
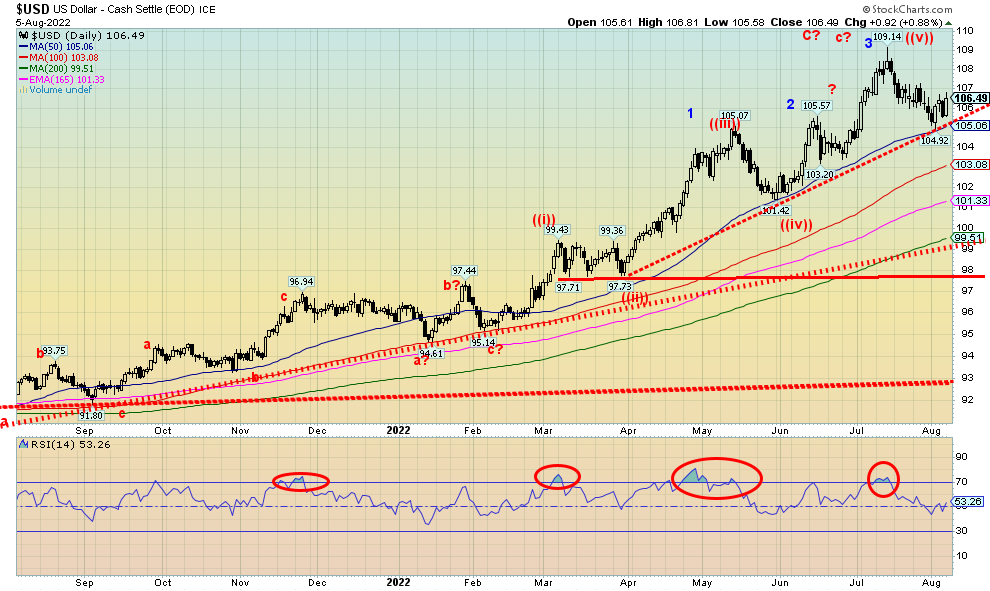
The stronger than expected job numbers helped propel the US$ Index higher on Friday. As well, the tensions between the U.S. and China over Taiwan also had the U.S. dollar being bought as a safe haven. The result was that the US$ Index rose 0.7% this past week while the currencies fell. The euro was off 0.4%, the Swiss franc fell 1.1%, the pound sterling was down 0.9%, the Japanese yen dropped 1.3%, while the Canadian $ fell 1.0%. Also not helping the Canadian $ were falling oil prices.
So far, that support line coming up from a low in March appears to be holding. This keeps alive the uptrend and could result in the US$ Index rising further to challenge the 109.14 high and even make new highs. A move above 107 would be positive while above 108 almost assures us we’ll see new highs. Many are expecting the US$ Index to weaken. However, it is probably going to take clear signs that the U.S economy is really falling into a recession. Otherwise, strong economic numbers like the job numbers (even if they look good only on the surface), coupled with geopolitical tensions that favour U.S. dollar buying, will continue to help buoy the US$ Index.
A breakdown under 105 now could set the US$ Index to fall further towards the next support near 103.
Source: www.stockcharts.com
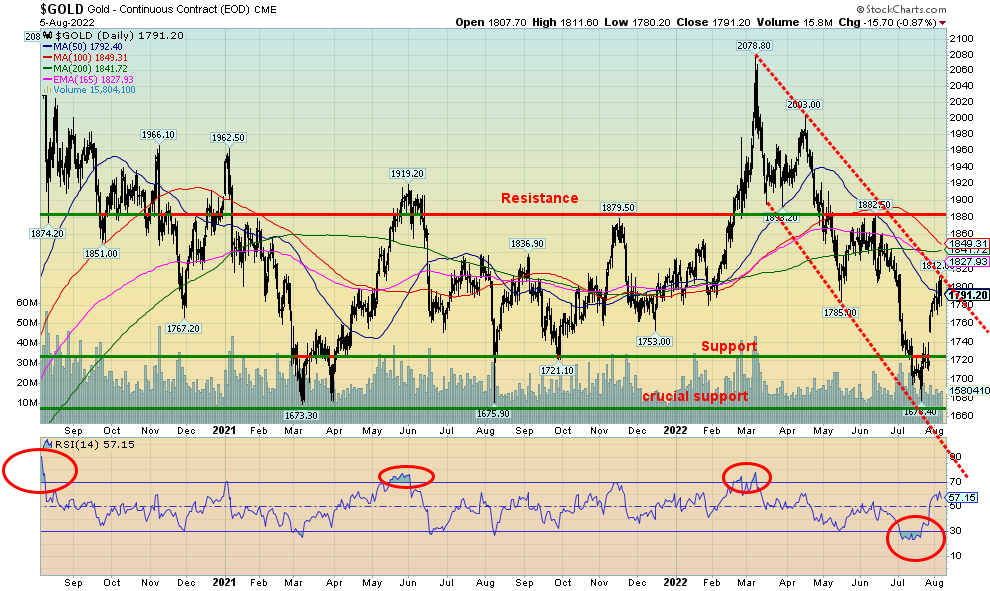
Gold put in a positive week but silver did not. The gold stocks were mixed, with the Gold Bugs Index (HUI) falling 1.3% while the TSX Gold Index (TGD) was up 0.7%. Gold’s gain on the week was 0.5% while $20 resistance kicked in for silver and it fell 1.8%. Platinum had a good week, up 3.9%, but palladium hesitated, off a tiny 0.1% and copper continued its recent weakness, off 0.6%. For gold, it was the third consecutive weekly rise.
Friday’s strong nonfarm payrolls were a catalyst for pushing gold back. Gold fell on Friday over $15 or 0.9%. Earlier, gold was benefitting from safe haven buying as tensions between China and the U.S. over Taiwan heated up. Although it didn’t help on Friday, despite China firing missiles over Taiwan. Signs of a global slowdown (recession) also helped gold as thoughts began to turn to the Fed easing rather than the Fed tightening.
We had noted earlier that $1800 was potential resistance with further resistance up to $1,820. Once over $1,820, we could start to focus on next resistance at $1,840/$1,850. Final key resistance would come in around $1,880/$1,900. The $1,800 zone is also where trendline resistance comes in. With these resistance zones it sometimes takes two or three attempts before a breakthrough comes. Other times it could prove to be the resistance zone it is and prices fall back. Support is now from $1,740 to $1,780. Below $1,740 the dynamics could change and gold could fall to retest the recent low near $1,680. We have noted that triple bottoms (and tops) are rare and that a failure could see gold fall sharply if it were to break down under $1,675.
What’s key, of course, going forward is whether gold has made its important 7.83- and 23.5-year cycle lows. We’ve noted we are in the time period for this to happen. But the period extends out into 2024. The key is what appears as a potential double top in August 2020 at $2,089 and again in March 2022 at $2,078. If that double top is real and the triple bottom is not, then once gold breaks down under $1,675 it could in theory target all the way down to $1,260.
So, what would take gold that low? A stock market crash would also pressure gold lower. It is not unusual that when the stock market crashes, as it did 1987, 2008 and 2020, gold follows to the downside. But a reminder that silver gets hit even harder and could this time target to around $11. Gold stocks get hit even harder and have in the past outperformed the stock market to the downside. Gold, despite falling in sympathy with the stock market, underperforms or, stated the other way, outperforms the stock market. As well, gold (and the precious metals market) usually turns around first.
We note this because as this rally proceeds, we need to keep in mind that, like the stock market, it may only be a bear market rally. Only new highs above $2,100 would set gold on a path to higher prices.
Source: www.cotpricecharts.com
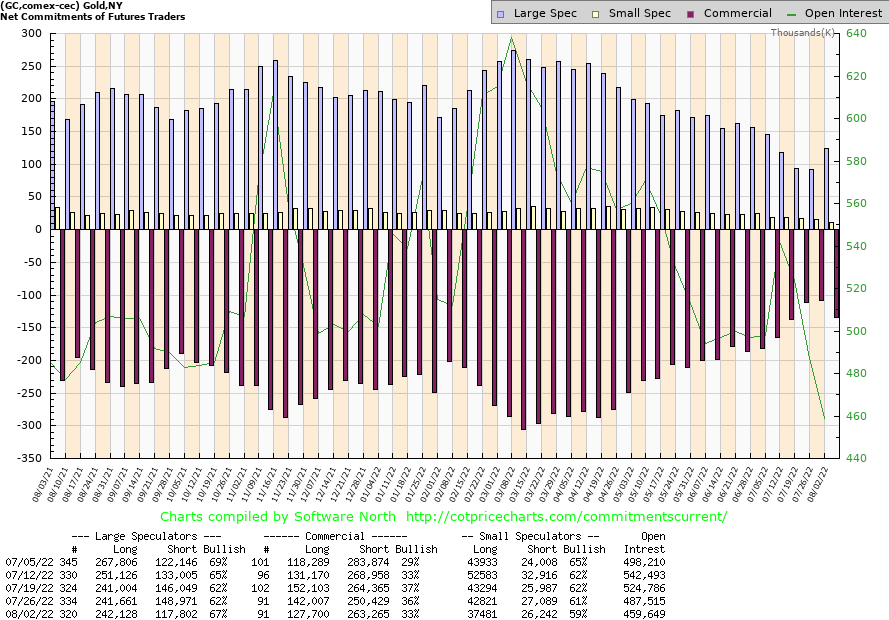
For the first time in a few weeks the commercial COT (bullion companies and banks) fell. The decline was to 33% from 36% as long open interest fell about 15,000 contracts while short open interest rose about 13,000 contracts. The large speculators COT (hedge funds, managed futures, etc.) rose to 67% from 62% as their short open interest fell over 30,000 contracts. Overall open interest fell, suggesting to us that the rally over the past week was mostly about covering longs.
The silver commercial COT followed the same path as it fell to 46% from 49%. Long open interest was down almost 7,000 contracts while short open interest was mostly unchanged. For the large speculators COT, it went from 48% to 50%. As with gold, overall open interest fell, suggesting long covering.
It’s too early to read anything into this. It is not unusual that the commercial COT falls as the price of gold (and silver) rise. But neither are at levels that would raise concern that we are topping. At least, not yet.
Source: www.stockcharts.com
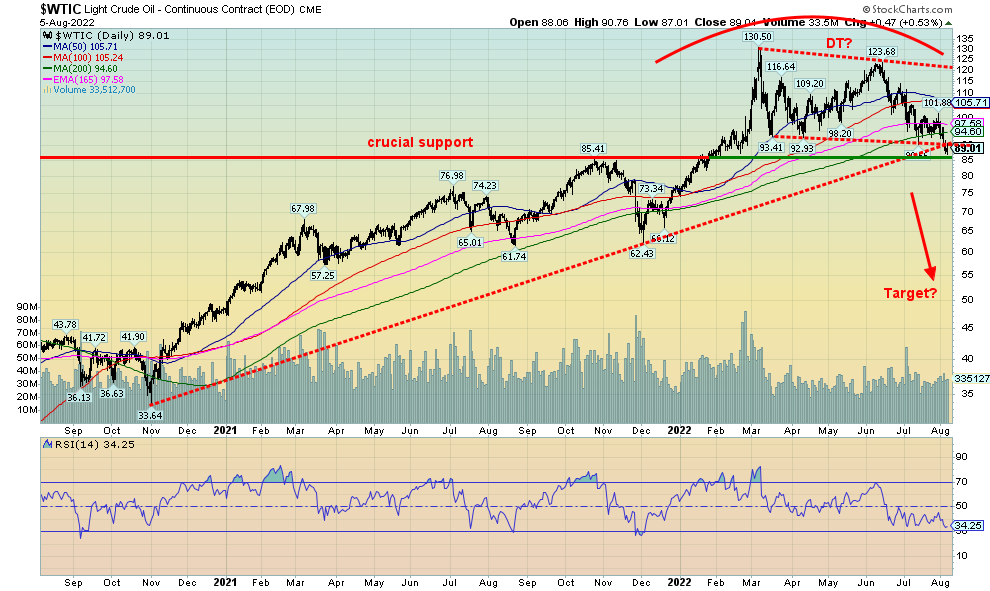
Don’t look now, but oil prices are down to levels last seen just before the invasion on February 24. Still, that’s up from the lows in December 2021 when they were another $20 or so lower. Then came the Russian buildup on the border of Ukraine and oil prices started to rise. Oil’s seasonals tend to show strength between December and June/July. Weakness usually prevails in between. So far, we seem to be on schedule. In 2021 WTI oil topped in June and bottomed in December.
This past week WTI oil fell 9.7% while natural gas (NG) was down 2.1%. NG at the Dutch Hub (EU) was up 2.8%. The energy stocks took it on the chin as the ARCA Oil & Gas Index (XOI) was down 5.6% and the TSX Energy Index (TEN) dropped 8.6%. Both now look lower.
What’s going on right now is fear of recession along with demand destruction. There is also the matter of what appears to be a double top on the charts at $130.50 in February and again at $123.69 in May. It would now appear that the neckline is being breached. How low could it go? Well, the target says $53. But in-between targets could be a minimum of $82 with other targets being $76 and $68. There are, of course, a lot of wild cards out there. Russia is using energy as a weapon. They could up the ante and pull oil off the market, especially if the U.S. were to proceed with its proposed price cap on Russian oil. Replacing Russian oil would not be easy.
Secondly, the other danger is Iran where it is possible that they are getting closer to producing a nuclear bomb. While the likelihood of the U.S. doing anything is low, that’s not the case with Israel. An attack on Iran could result in the shutting of the Straits of Hormuz where almost a third of the world’s oil flows through. Also, if Israel did attack Iran’s nuclear facilities, it would be an act of war and it could trigger a broader conflict.
We note that the oil futures curve is in backwardation, so the expectation is of lower prices going forward. Either way we look at it, we appear poised for oil prices to move lower. Natural gas (NG) is holding up. While it softened a little in North America, it is not softening in the EU and the EU could be facing a difficult winter.
Copyright David Chapman, 2022
|
GLOSSARY Trends Daily – Short-term trend (For swing traders) Weekly – Intermediate-term trend (For long-term trend followers) Monthly – Long-term secular trend (For long-term trend followers) Up – The trend is up. Down – The trend is down Neutral – Indicators are mostly neutral. A trend change might be in the offing. Weak – The trend is still up or down but it is weakening. It is also a sign that the trend might change. Topping – Indicators are suggesting that while the trend remains up there are considerable signs that suggest that the market is topping. Bottoming – Indicators are suggesting that while the trend is down there are considerable signs that suggest that the market is bottoming. |
Disclaimer
David Chapman is not a registered advisory service and is not an exempt market dealer (EMD) nor a licensed financial advisor. He does not and cannot give individualised market advice. David Chapman has worked in the financial industry for over 40 years including large financial corporations, banks, and investment dealers. The information in this newsletter is intended only for informational and educational purposes. It should not be construed as an offer, a solicitation of an offer or sale of any security. Every effort is made to provide accurate and complete information. However, we cannot guarantee that there will be no errors. We make no claims, promises or guarantees about the accuracy, completeness, or adequacy of the contents of this commentary and expressly disclaim liability for errors and omissions in the contents of this commentary. David Chapman will always use his best efforts to ensure the accuracy and timeliness of all information. The reader assumes all risk when trading in securities and David Chapman advises consulting a licensed professional financial advisor or portfolio manager such as Enriched Investing Incorporated before proceeding with any trade or idea presented in this newsletter. David Chapman may own shares in companies mentioned in this newsletter. Before making an investment, prospective investors should review each security’s offering documents which summarize the objectives, fees, expenses and associated risks. David Chapman shares his ideas and opinions for informational and educational purposes only and expects the reader to perform due diligence before considering a position in any security. That includes consulting with your own licensed professional financial advisor such as Enriched Investing Incorporated. Performance is not guaranteed, values change frequently, and past performance may not be repeated.
About the author


Website: https://www.enrichedinvesting.com
Disclaimer: David Chapman is not a registered advisory service and is not an exempt market dealer (EMD) nor a licensed financial advisor. We do not and cannot give individualised market advice. David Chapman has worked in the financial industry for over 40 years including large financial corporations, banks, and investment dealers. The information in this newsletter is intended only for informational and educational purposes. It should not be considered a solicitation of an offer or sale of any security. The reader assumes all risk when trading in securities and David Chapman advises consulting a licensed professional financial advisor before proceeding with any trade or idea presented in this newsletter. David Chapman may own shares in companies mentioned in this newsletter. We share our ideas and opinions for informational and educational purposes only and expect the reader to perform due diligence before considering a position in any security. That includes consulting with your own licensed professional financial advisor.