
“Learn from yesterday, live for today, hope for tomorrow.”
—Albert Einstein, German-born theoretical physicist, widely influential, developed the theory of relativity, contributed to theory of quantum mechanics; 1879–1955
“I hope that in this year to come, you make mistakes. Because if you are making mistakes, then you are making new things, trying new things, learning, living, pushing yourself, changing yourself, changing your world. You’re doing things you’ve never done before, and more importantly; you’re doing something. So that’s my wish for you, and all of us, and my wish for myself. Make New Mistakes. Make glorious, amazing mistakes. Make your mistakes, next year and forever.”
—Neil Gaiman, English author of short fiction, novels, comic books, graphic novels, nonfiction, audio theatre, films, comic book series The Sandman, novels Stardust, American Gods, Coraline, The Graveyard Book, award winner; b: 1960
“Be at war with your vices, at peace with your neighbors, and let every new year find you a better man.”
—Benjamin Franklin, American polymath, writer, scientist, inventor, statesman, diplomat, printer, publisher, political philosopher, Founding Father of United States, drafter of United States Declaration of Independence, first U.S. Postmaster General; 1706–1790
We enter the new year with trepidation after going through the worst market since 2008. Of the stock markets we follow regularly, only one—the London FTSE 100—posted a gain, up 0.9% on the year. Of the ones we regularly follow, the NASDAQ fell 33.1% while the NY FANG Index was down 40.1%. Here in Canada, the TSX Venture Exchange (CDNX) fell 39.3%. By comparison the Dow Jones Industrials (DJI), down 8.8% and the TSX Composite, down 8.7% were stars. The S&P 500 lost 19.4%. Bitcoin and the cryptos were a disaster zone with both Bitcoin and the entire crypto market down over 65% on the year. By year end the cryptos were mired in controversy and scandal against the backdrop of the FTX/Sam Bankman-Fried collapse. There was little joy to be found.
But if you were long energy, you did well. The ARCA Oil & Gas Index (XOI) gained 51.7% while the TSX Energy Index (TEN) was up 48.4%. The dog index of the TSX was Health Care (THC), down 57.8% led by the collapse of the cannabis stocks. The FAANGs had a horrible year with Meta down 64.2%, Amazon off 49.6%, Netflix 51.1%, and the beleaguered Tesla and Elon Musk down 65.0%. Elon Musk became the $200 billion man, not because he made $200 billion but because his net worth collapsed $200 billion, mirroring the collapse in Tesla. It was the most spectacular loss ever for one person. Okay, it was on paper. But by year end he was unloading Tesla to pay for Twitter. He paid $44 billion for Twitter. Twitter is probably worth a lot less today.
A chart we saw of winners and losers for 2022 had heating oil at the top, up 38.3%. The NASDAQ 100 was at the bottom of the same chart, losing 32.8%. Gold recorded a small 0.1% loss, but silver was up 3.0%. Platinum was the big winner, gaining 12.1%. However, the gold stocks didn’t fare quite as well with the Gold Bugs Index (HUI) down 11.3% and the TSX Gold Index (TGD) off 5.0%. Still, that was better than most of the broader market. WTI oil had a roller coaster year and, after being up roughly 73% at one time, finished the year with a gain of only 6.7%. Natural gas (NG) also had a roller coaster year, ending up 20.1%.
A colleague and friend, Brahm Satov, a portfolio manager with CIBC said in his most recent missive that the economic and stock market correction has “only just begun.” Well-known economist David Rosenberg (www.rosenbergresearch.com) has said essentially the same thing. Maybe we are all channeling Dr. Doom—or is it Dr. Gloom, Nouriel Roubini, who has defined “MegaThreats.” It’s not what any of us really want, but years of financial repression are coming back to haunt us. Years of ultra-low interest rates and oodles of quantitative easing (QE) have resulted in bubbles in everything.
Historically, we’ve never seen a bubble that didn’t eventually burst, causing considerable pain not only for those caught up in the bubble but collateral damage to everyone else. Whether it be stocks, bonds, real estate, cryptos, or commodities, they soared and they crashed. Add in alt assets, fiat currencies, and derivatives and we have a toxic mix. Okay, one could hide in cash. At least all you lost there, providing your financial institution didn’t fail, was the differential with inflation. Yet that is still a loss. Income was not keeping up with inflation and rising interest rates to combat inflation were killing all sorts of things, especially real estate.
Add in the growing threats of climate change, resulting in mega-storms (how did your Christmas travel plans turn out? amidst big snow storms followed by a big melt and unseasonably balmy weather), droughts, flooding, atmospheric rivers, and more. There is also the threat of global war (WW3) centered around the Russia/Ukraine war where the Western nations are represented by massive transfer of deadly weapons to Ukraine costing billions, even as Ukraine suffers the most and is the fodder for Russia. But the real threat is the growing tension between the U.S. and China as China challenges U.S. global hegemony and seeks a move away from the U.S. dollar as the world’s reserve currency.
History has shown that these superpower conflicts have invariably ended in very destructive wars. Add in the threats of pandemics, a global debt crisis (there has never been so much debt), political instability both domestically (e.g., witness the recent crisis in the U.S. over the election of a speaker) and globally, the rise of nationalism and authoritarianism, deglobalization, demographic decline, particularly in the Western world (yes, we are aging), and technology threats with the rise of AI and robotics that could displace millions. Is it really the ”Decline of Western Civilization”? No, civilizations do not collapse overnight. It’s a long process. But, regardless, get ready to “fasten your seatbelts, it’s going to be a bumpy night.” (Margo Channing, played by Bette Davis, in All About Eve, 1950).
Brahm Satov in his year-end missive also noted the declining Conference Board Leading Economic Indicators (LEI). They have plunged into negative territory. Plunging into negative territory has occurred before every recession over the past 70 years. The LEI has successfully forecasted every recession. Yet a survey of eight major global banks reveals that their economists are divided as to whether we can expect a recession, a mild
or shallow recession, or avoidance of a recession altogether. Avoidance of a recession comes from Goldman Sachs and Morgan Stanley, although both acknowledge we will slow down. A mild or shallow recession is predicted by J.P. Morgan, Bank of America, Barclays Bank, Wells Fargo, and PNC Financial, while only Deutsche Bank says we’ll have a recession in the second half of the year. Some expect other parts of the world will go into recession, particularly noting the EU. Japan sometimes feels as if it is in a perma-recession.
Conference Board’s Leading Economic Indicators 1999–2022
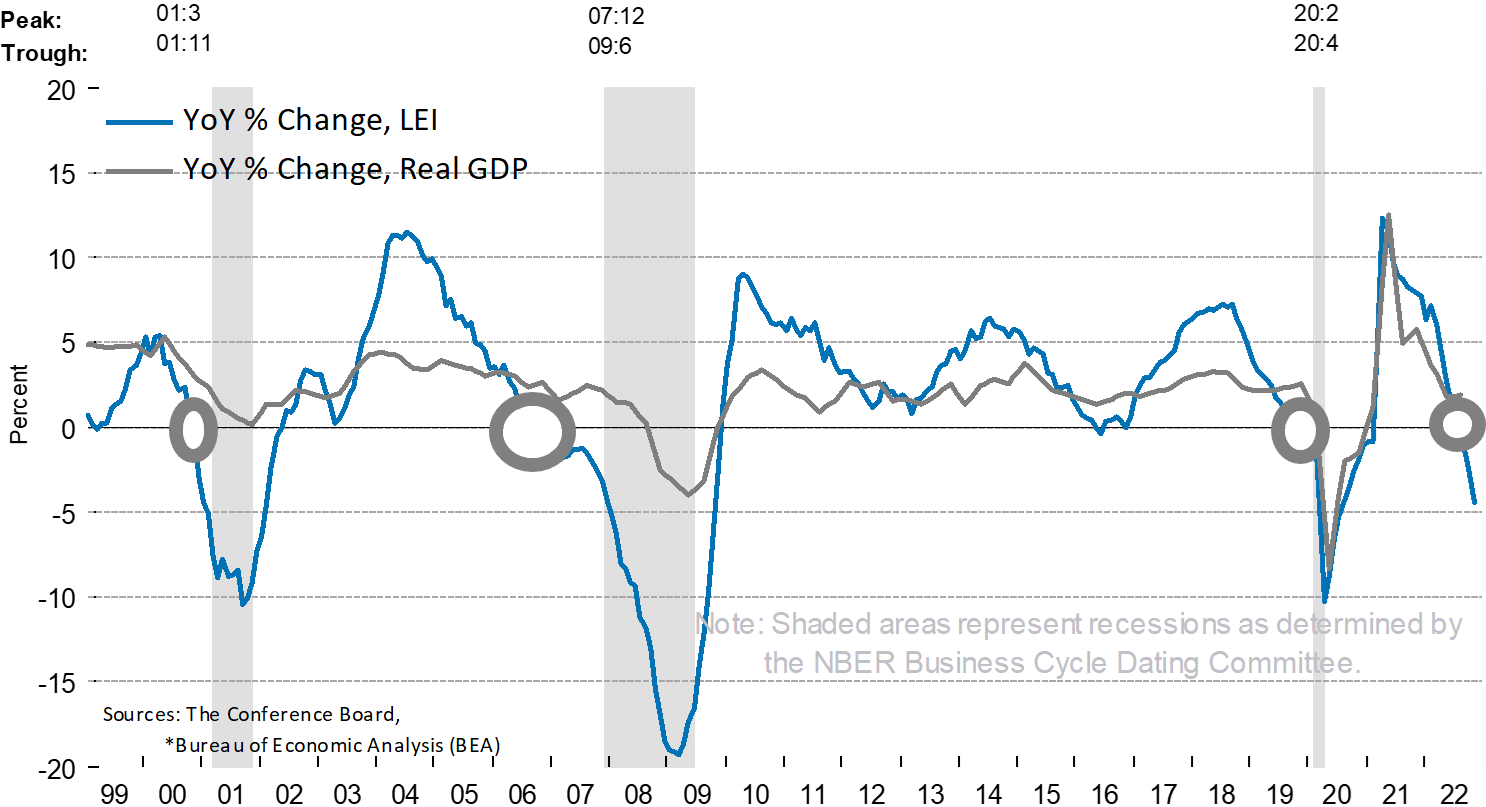
Source: www.conference-board.org, www.bea.gov
Most forecasts we see are pointing to a recession in 2023. But could it happen? The third year of the presidential cycle is the most bullish. It has a 74% record of seeing an up market. The worst third year was Hoover’s in 1931 when the DJI fell 52.7%. A survey by the Wall Street Journal showed the expectation of a recession at 65%. But at best it will only be a mild recession. The Fed appears determined to keep hiking interest rates with the recent projection that the Fed rate could reach 5.5% up from the current 4.5%. The U.S. economy has continued to grow and the employment market continues to be good. Friday’s nonfarm payroll still gave us 200,000 plus jobs (December job numbers covered later). The U.S. economy continues to grow, even though it has been on the decline overall for the past 75 years. Each recovery from a recession appears weaker and weaker. The pandemic recession of 2020 brought us an overreaction to the upside, but since then growth has been sliding. Even if somehow, they avoid a recession, stagflation is sure to continue even as inflation has abated from its earlier surge.
One final good point Brahm noted in his missive was how many times markets have suffered losses two years in a row. It is not that uncommon. The last time was 2000–2002, where stock market losses occurred three years in a row. Since 1830 the record of the Dow Jones Industrials (DJI) shows that consecutive yearly stock
market losses for two years in a row or more occurred 14 times. Consecutive losses of three years in a row or more occurred six times, and losses four years in a row occurred once.
U.S. GDP Real Percentage Growth 1948–2022
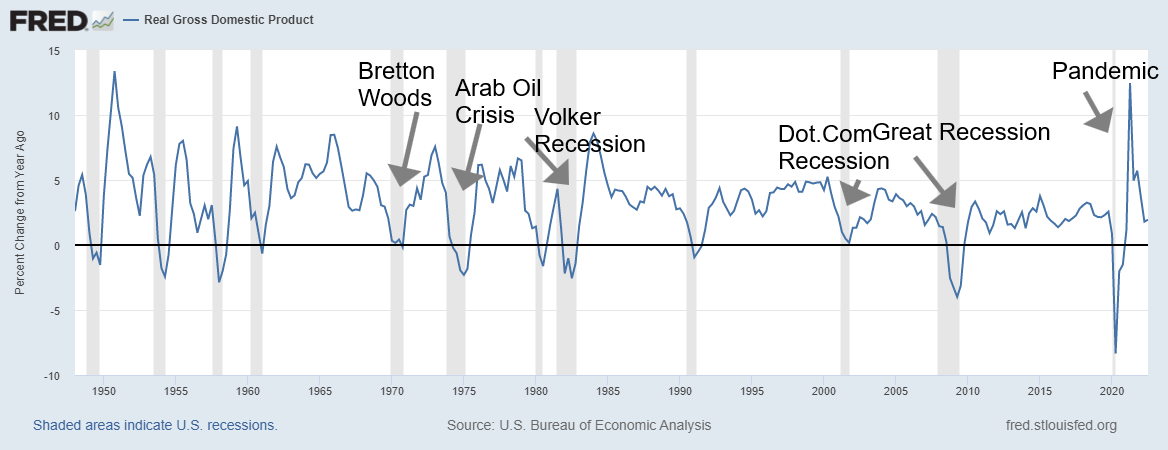
Source: www.stlouisfed.org
Oddly enough, we did not go through consecutive years of losses during the Great Recession 2007–2009. 2007 did eke out a small gain and 2009 saw the recovery of markets, thanks to zero percent interest rates and QE. The previous decade only saw two down years: 2015 when the DJI was off 2.2%, thanks to quantitative tightening (QT) and the end of QE, and 2018 when the DJI dropped 5.6% as a result of the Trump trade wars.
Losing years are not that uncommon. Since 1833 (189 years) where our records start, we have had 71 losing years or 37.6% of the time. On average, we’ve had 3.6 losing years every decade, although that is swayed by this decade having only two observations so far. Since 1940, the average has been only 2.7 losing years per decade, again swayed by this decade that only has two observations so far. The 1990s saw only one losing year and that was the last year of the decade 2000. Still, one could expect that every decade will have upwards of three losing years. The good news is that is an improvement over the earlier periods when one could expect at least four losing years every decade.
It's January and markets experience what is known as the January effect. The January effect or January barometer as it is called was noted by analyst Yale Hirsch, the original author of the Stock Trader’s Almanac. The Stock Trader’s Almanac is carried on by his son Jeffery, along with Christopher Mistal. Through the almanac, Yale Hirsch imparted his knowledge and love for markets, history, cycles, and patterns. The premise of the January barometer is that how January goes will be a clue as to how the year goes. One premise is that small cap stocks will outperform large-cap stocks. Between 1953 and 1995, the record was 40-3 in favour of
small cap stocks. But the real impact is on the performance of the stock market in January. If January is up, the odds favour that the year will be up. Similarly, if the market is down in January, the expectation is that it will be a down year. January 2022 saw the DJI fall 3.3%; the year ended with the DJI down 8.8%. Overall, the January barometer has an incredible 83.3% accuracy record with only 12 errors since 1950. Even taking into consideration flat years, the record has a 72.2% accuracy record.
Consecutive Yearly Stock Market Losses (DJI) 1830–2022
|
Years of Consecutive Declines |
Recession, Depression, Banking Panic |
|
1836–1837 (2 years) |
Banking panic 1837, recession |
|
1841–1842 (2 years) |
Depression |
|
1853–1854 (2 years) |
Recession |
|
1875–1877 (3 years) |
Long Depression |
|
1882–1884 (3 years) |
Long Depression |
|
1892–1894 (3 years) |
Long Depression, banking panic 1893 |
|
1906–1907 (2 years) |
Banking panic, recession |
|
1913–1914 (2 years) |
Recession |
|
1916–1917 (2 years) |
War |
|
1929–1932 (4 years) |
Great Depression, banking panics |
|
1939–1941 (3 years) |
Recession, war |
|
1973–1974 (2 years) |
Recession, Arab oil crisis |
|
1977–1978 (2 years) |
Arab oil crisis, stagflation |
|
2000–2002 (3 years) |
Recession, dot.com crash |
Source: www.stocktradersalmanac.com, www.wikipedia.org
The January barometer’s errors were in 1966 and 1968 (Vietnam), 1982 (stock market bottomed in August), 2001 (9/11), 2003 (invasion of Iraq), 2009 (new bull market following the financial crash of 2008), 2010 (saved by Fed QE2), 2014 (Fed saved with QE3), 2016 (fears of slowdown following QT), 2018 (trade wars), 2020, and 2021 (pandemic). Note that most of the errors have occurred since 2000. Is the January barometer still working?
The so-called January effect is premised by the “Santa Claus” rally and the early January warning system. The Santa Claus rally starts in the last five trading days of the year and the first two of January. This year’s would have started on December 23 and ended on January 4. During that period the DJI produced a 0.2% gain while the S&P 500 was up 1.5%. Since 1950, the strategy has seen a gain of 1.3%. If the market is down during the period of the Santa Claus rally, the odds favour that a bear market will follow.
“If Santa Claus should fail to call, Bears may come to Broad and Wall.”
The early January warning system is the first five days of the new trading year. We won’t know the answer to that until January 9 which is the final day of the first five trading days of 2023. So far, the S&P 500 is up 1.5% with one day left. In 2022 the first five days saw the S&P 500 fall 1.9%.
We believe this bear market has barely begun, but we remain vigilant in the event that changes. The positive first few days of 2023 suggests the market is shrugging off bad news. We appear to be following the “Psychology of a Market Cycle” as shown in the chart from Wall St. Cheat Sheet (www.wallstcheatsheet.com). We have applied the principles of the psychology to the market of 2009–2023 and, so far, the pattern seems to fit. Given recent improvements in the stock market, this could see the return of complacency as everyone seems to be looking for a mild recession and easing of inflation and interest rates in 2023. If the psychological pattern holds, they may be doomed to disappointment. This is merely the period before the next leg down.
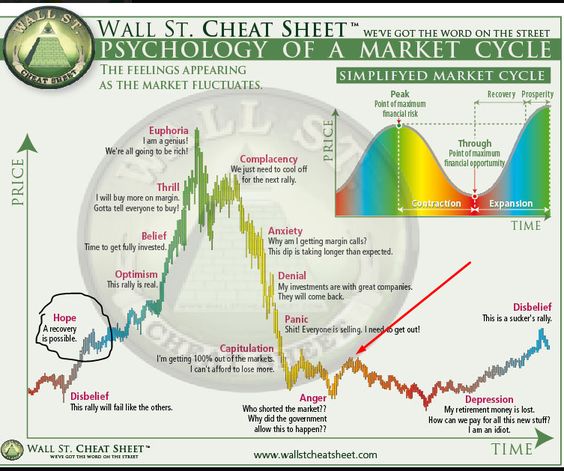
Source: www.wallstcheatsheet.com
Chart continues on next page
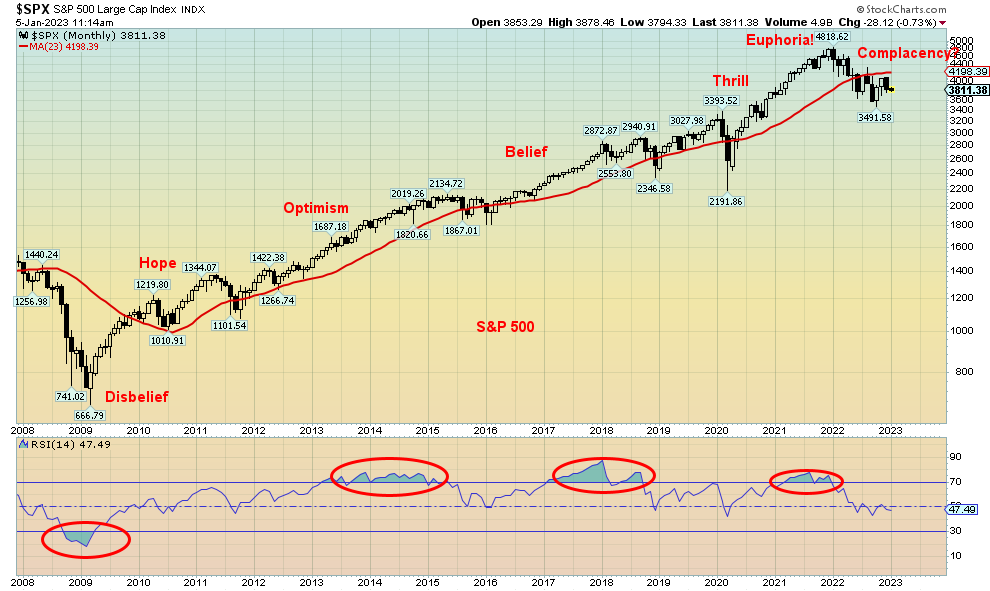
Source: www.stockcharts.com
Finally, as we have often noted, cycles are working against us. We believe we are just in the early throes of a possible 90-year cycle that last bottomed during the Great Depression in 1932. The cycle has a range of +/- 15 years, so while centered on 2022 it could range from 2007 to 2037. In theory, that may have bottomed in 2009 along with the 72-year cycle. However, we pegged that low as being the low of the 72-year cycle which last occurred in March 2009. That low was 77 years from the 1932 low, well within range. We also had the 2002 low also within range. If that’s correct, we are, we believe, still in the early stages of the next 72-year cycle. However, that doesn’t mean there won’t be bear markets. The half-cycle 36-year cycle also bottomed in March 2009. That cycle was last seen with the low in 1974. The 18-year cycle which is a subset of all of the above cycles also last bottomed in March 2009. 18-year cycle lows from 1932 were seen in 1949, 1968, and 1970 and even 1974, and 1987 followed by 2009. That cycle is next due to bottom 2027 +/- 3 years.
We can narrow it down further as the 18-year cycle sub-divides into three 6-year cycles. From 2009 we saw a low in 2015/2016 and we are currently in the formation of the next 6-year cycle low. Following a rebound (which may be underway), the next one would also be the 18-year cycle low. There is also a 4-year cycle which one could say follows the presidential cycle. Its range is 3–5 years. It can also overlap with the 6-year cycle. From March 2009 we saw a low in October 2011 (somewhat early), 2015/2016, and March 2020. 2023 would represent the third year, so this cycle is due to bottom sometime in 2023–2025.
Everything we are looking at appears to suggest that 2023 could be another difficult year. As my friend Brahm says, the correction has “only just begun.” Even a crash is even possible. Hopefully we’ll see the setup and can warn in advance, but often crashes come out of the blue, triggered by a black swan event. The collapse of
Lehman Brothers in 2008 and the pandemic were both black swan events triggering a crash. The threats are known. But will one of them turn into black swan event? That is the hard question to answer.
The rest of this page is blank
Chart of the Week
Source: www.stockcharts.com
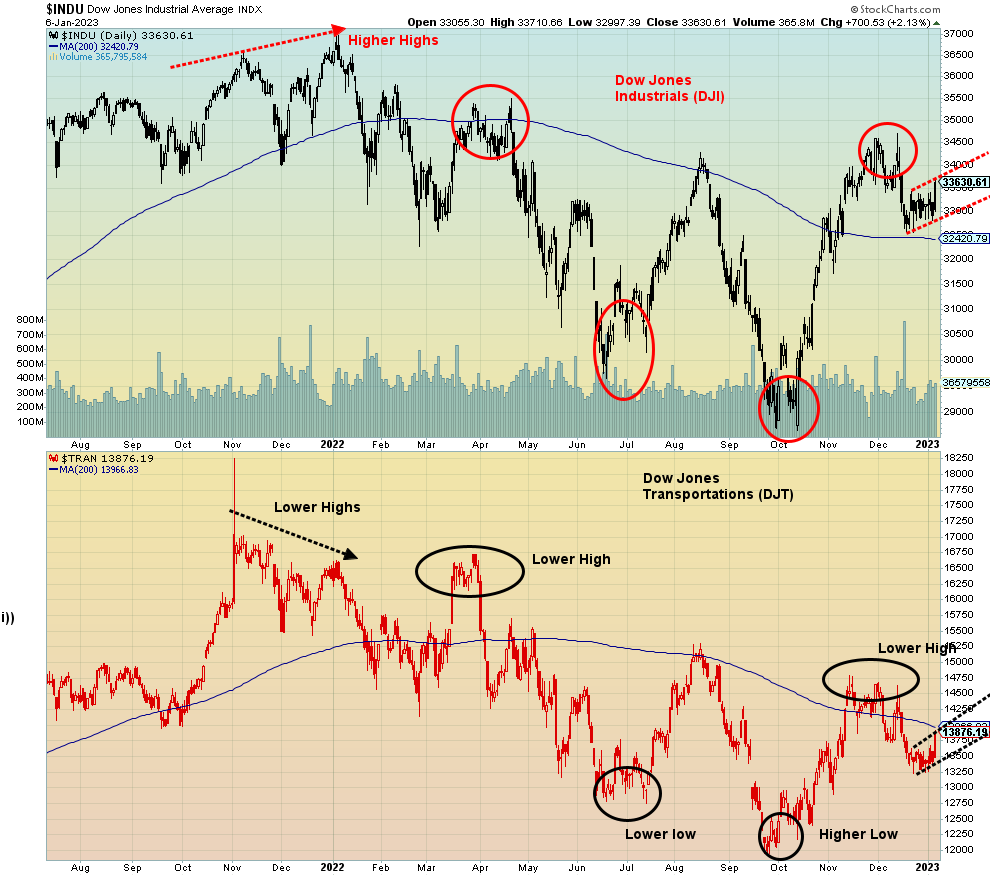
Is Dow Theory working once again? What is Dow Theory? Dow Theory is a technical financial theory developed by journalist Charles H. Dow (he of Dow Jones fame) that examines the relationship between the Dow Jones Industrials (DJI) and the Dow Jones Transportations (DJT). The theory has six basic tenets.
We outline those tenets below. The above chart refers to only one of the basic tenets.
- The market discounts everything
- There are three primary trends: secondary trends (we label them as daily or short-term trends) lasting a few weeks or months, primary trends (we label them as intermediate or weekly trends) that can last a year or more, and major trends (we label them as long-term or monthly trends)
- Markets have three phases: for a bull market i. Accumulation phase, ii. Participation phase, iii. Excess phase; for a bear market i. Distribution phase, ii. Participation phase, iii. Panic phase
- The indices must confirm each other
- Volume must confirm the trend
- Trends persist until a clear reversal occurs
Our chart is referring to tenet number 4: the indices must confirm each other. In this case, we look for confirmation between the DJI and the DJT. We have applied the same to gold and silver and even oil and natural gas. There could be other applications.
What we are looking for between the DJI and the DJT is that when markets are making new highs, they both are making new highs and vice versa: when they are making new lows, they are both making new lows. When one is not confirming the other, we look for a possible trend reversal. Divergences can occur that are later confirmed so one has to be wary until one receives a confirmation that the trend has indeed reversed.
The chart above of the DJI and the DJT is a classic example of non-confirmations that resulted in trend reversals. The big one occurred at the market top in late 2021 and early 2022 when the DJI moved to new highs even as the DJT was making lower highs. That divergence played out from October to January before it resulted in both markets breaking to the downside.
But, oddly enough, divergences between the DJI and the DJT played out in the swings throughout 2022. It noted the top in March 2022, the bottom in June/July 2022, and the low in September/October 2022. More recently, it appears to have caught a top through November/December as the DJI made higher highs while the DJT made lower highs. It was confirmed with the breakdown in mid-December.
Now both indices appear to be making what we believe could be bear flags. This will be confirmed once the DJI breaks under 32,700 and the DJT breaks below 13,250. The expectation here is that both will break to the downside. We also note that the DJT has broken below its 200-day MA but the DJI has not. A break now for the DJI under 32,400 and especially under 32,000 would confirm we are in the next move to the downside. However, if this market were to break higher than the premise of the bear flag could be broken and we’d have to shift our attention to the upside.
As well, we note that their respective short, intermediate, and long-term trends are generally in sync with each other. As a bear market, we appear to be still in the participation phase and have not yet hit the panic or capitulation phase. Volume, to no surprise, has accelerated to the downside. The stock market would appear to be discounting the fact that we are headed for a recession. We have not yet reached the accumulation phase. And finally, the trend is down and shows no signs of reversing even if the market has a counter-trend rally to the upside.
US Job Numbers
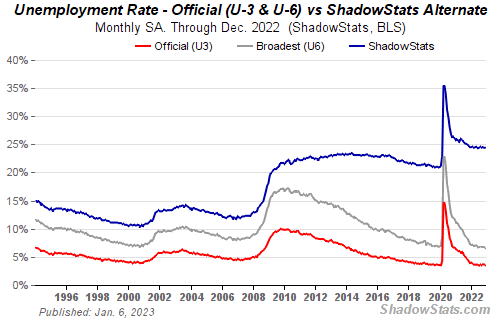
Source: www.shadowstats.com
The U.S. economy continues to hum along. Following the better-than-expected ADP employment numbers (expected 150,000, actual 235,000) and the lower-than-expected weekly claims (expected 225,000, actual 204,000), it came as little surprise that the December job numbers were somewhat better than expected. The market was looking for at least 200,000 nonfarm payrolls. The actual was 223,000. The unemployment rate (U3) fell to 3.5%, down from November’s 3.6% and below the expected 3.7%. The U6 unemployment number (U3 plus short-term discouraged and other marginally-attached workers as well as those forced to work part-time because they cannot find full-time employment) fell to 6.5% from 6.7%. The Shadow Stats (www.shadowstats.com) unemployment number (U6 unemployment plus the adjustments as a result of reporting methodology adjusted "for the significant portion of ‘discouraged workers’ defined away in 1994 during the Clinton administration”) was unchanged at 24.4%. The Shadow Stats unemployment number is not budging. In February 2020 it was at 21.3%. Is the Shadow Stats number more reflective of the real picture? It is certainly not discussed amongst the “chattering classes.”
So, all sounds good. Except one has to dig a little underneath the numbers to try and determine what is really going on. Of the 223,000 jobs reported, 67,000 were in leisure, hospitality, food services, drinking places, amusements, gambling, recreation, and accommodation all areas of employment that tend to be low-paying and part-time. Full-time employment was essentially flat in December, but part-time employment rose 679,000, well above the total. Trying to account for that difference is tricky. Those not in the labour force rose 85,000. The total eligible labour force rose 439,000 while total population eligible to work rose 136,000. There are 57.3 million registered as retired and 8.9 million are listed as disabled. No numbers on what proportion of
them might actually hold a job even part-time. What is interesting is since February 2020, before the
pandemic, the total eligible population level 16 years and older rose 5.2 million but the actual labour force rose only 508,000. We can only assume a lot of them retired. No surprise when we checked that number that the number of retirees since a similar period in 2020 is up 2.1 million. Those not in the labour force are higher by 5.2 million since February 2020. There seems to be a high number of long-term unemployed.
The labour force participation rate rose to 62.3% from 62.2% but it was 63.3% in February 2020. A lower labour force participation tends to help lower the actual unemployment rate (U3). The civilian employment-population ratio rose to 60.1% from 59.9% but was down from 61.1% in February 2020. There are 1,239,000 more people employed in December 2022 than there were in February 2020 but, as noted, the eligible employable population is up 5.2 million.
Job layoffs are being announced—note the recent Amazon cuts of 18,000—but so far, the employment level has remained good, defying expectations of a decline as a result of the Fed hiking interest rates. Fear of rising interest rates dissipated following the employment numbers and the DJI jumped over 500 points, with gold up almost $30. So far, the Fed has hiked rates at every meeting since March 2021. The next meeting is January 31 to February 1. The expectation now has to be on another 50 bp hike. So far, the interest rate hikes are having seemingly no impact on the employment level. Maybe the market is accepting the fact that the Fed will hike to 5.5%. If the market is rallying it may be that the market is looking beyond the Fed hikes. The good job numbers suggest there is either underlying economic strength or structural labour shortages. We suspect the latter. All this gives some credence to a soft landing rather than a hard one.
Average hourly earnings rose 0.3% month over month (m-o-m), slightly below expectations of a gain of 0.4%. Year over year (y-o-y) was up 4.6%, below expectations again of a gain of 5%. What that tells us is that wage gains are running under the rate of inflation of last at 7.1%, despite the so-called tight labour market. The Fed ought to be pleased with that. The workers maybe not so much.
Canada job numbers
Canada Employed Persons vs. Unemployed Persons 2013–2023
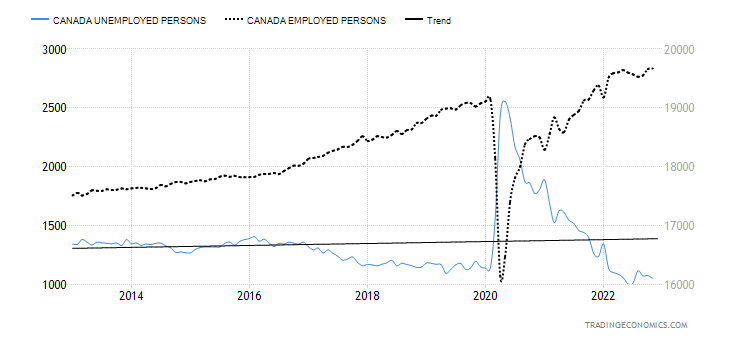
Source: www.tradingeconomics.com, www.statcan.gov.ca
It was another blockbuster number for Canada. Canada added 104,000 jobs in December, well above the expected gain of 8,000. Full-time employment rose 84,500 while part-time was up 19,500. Most of the gains were in the private sector with the public sector up only slightly. Good gains were seen for the 15–24 age group. Construction, transportation, and warehousing all saw gains and good gains came in six of the ten provinces. The unemployment rate fell to 5%, down from 5.1%. That’s just above the low in June/July at 4.9%. The R8 unemployment number (adds in discouraged workers and involuntary part-timers) fell to 6.2% from 6.4%. All of these numbers are gang-busters above those seen in February 2020. While the U.S. has struggled to get back to those levels only recently, Canada has long exceeded them.
All of this has the “chattering class” speculating that the Bank of Canada (BofC) will have to continue with its rate hikes. Canada is showing little signs of cooling off. Forecasters are already building in new hikes. The next BofC meeting is Jan 25. Expect another 50 bp rate hike. The number of people employed is a record. Wage increases are still below the rate of inflation with the average hourly wage y-o-y up 5.2% vs. an inflation rate of 6.8%. The good numbers helped boost the Canadian dollar that jumped to $1.3512 (0.7401) from $1.3666 (0.7317) following the numbers. The TSX Composite finished the day up 307 points.
The labour force participation rate rose to 65.0% up from 64.8% as the labour force grew by 91,000 and the number of unemployed fell 23,800. The population-employment ratio was at 61.8% vs. 61.5%. More people working and a higher proportion of the working age population working. For Canada, that’s good.
Markets & Trends
|
|
|
|
% Gains (Losses) Trends
|
|
||||
|
|
Close Dec 31/22 |
Close Jan 6/23 |
Week |
YTD |
Daily (Short Term) |
Weekly (Intermediate) |
Monthly (Long Term) |
|
|
Stock Market Indices |
|
|
|
|
|
|
|
|
|
`S&P 500 |
3,839.50 |
3,895.08 |
1.5% |
1.5% |
down |
down (weak) |
neutral |
|
|
Dow Jones Industrials |
33,147.25 |
33,630.61 |
1.5% |
1.5% |
neutral |
up |
up |
|
|
Dow Jones Transport |
13,391.91 |
13,876.19 |
3.6% |
3.6% |
down (weak) |
neutral |
up (weak) |
|
|
NASDAQ |
10,466.48 |
10,569.29 |
1.0% |
1.0% |
down |
down |
down |
|
|
S&P/TSX Composite |
19,384.92 |
19,814.51 |
2.2% |
2.2% |
down (weak) |
neutral |
up (weak) |
|
|
S&P/TSX Venture (CDNX) |
570.27 |
581.89 |
2.0% |
2.0% |
neutral |
down |
down |
|
|
S&P 600 (small) |
1,157.53 |
1,185.83 |
2.4% |
2.4% |
down (weak) |
neutral |
neutral |
|
|
MSCI World Index |
1,977.74 |
1,982.76 |
0.3% |
0.3% |
up (weak) |
neutral |
down |
|
|
Bitcoin |
16,535.23 |
16,797.12 |
1.6% |
1.6% |
neutral |
down |
down (weak) |
|
|
|
|
|
|
|
|
|
|
|
|
Gold Mining Stock Indices |
|
|
|
|
|
|
|
|
|
Gold Bugs Index (HUI) |
229.75 |
251.78 |
9.6% |
9.6% |
up |
up (weak) |
down (weak) |
|
|
TSX Gold Index (TGD) |
277.68 |
301.75 |
8.7% |
8.7% |
up |
up |
neutral |
|
|
|
|
|
|
|
|
|
|
|
|
% |
|
|
|
|
|
|
|
|
|
U.S. 10-Year Treasury Bond yield |
3.88% |
3.57% |
(8.0)% |
(8.0)% |
|
|
|
|
|
Cdn. 10-Year Bond CGB yield |
3.29% |
3.10% |
(5.8)% |
(5.8)% |
|
|
|
|
|
Recession Watch Spreads |
|
|
|
|
|
|
|
|
|
U.S. 2-year 10-year Treasury spread |
(0.55)% |
(0.69)% |
(25.5)% |
(25.5)% |
|
|
|
|
|
Cdn 2-year 10-year CGB spread |
(0.76)% |
(0.88)% |
(15.8)% |
(15.8)% |
|
|
|
|
|
|
|
|
|
|
|
|
|
|
|
Currencies |
|
|
|
|
|
|
|
|
|
US$ Index |
103.27 |
103.65 |
0.4% |
0.4% |
down |
down (weak) |
up |
|
|
Canadian $ |
73.92 |
74.48 |
0.8% |
0.8% |
neutral |
down |
down |
|
|
Euro |
107.04 |
106.45 |
(0.6)% |
(0.6)% |
up |
up |
down |
|
|
Swiss Franc |
108.15 |
107.77 |
(0.4)% |
(0.4)% |
up (weak) |
up |
neutral |
|
|
British Pound |
120.96 |
120.95 |
flat |
flat |
neutral |
neutral |
down |
|
|
Japanese Yen |
76.27 |
75.71 |
(0.7)% |
(0.7)% |
up |
up |
down |
|
|
|
|
|
|
|
|
|
|
|
|
|
|
|
|
|
|
|
|
|
|
Precious Metals |
|
|
|
|
|
|
|
|
|
Gold |
1,826.20 |
1,869.70 |
2.4% |
2.4% |
up |
up |
up |
|
|
Silver |
24.04 |
23.98 |
(0.3)% |
(0.3)% |
up |
up |
up (weak) |
|
|
Platinum |
1,082.90 |
1,104.30 |
2.0% |
2.0% |
up |
up |
up |
|
|
|
|
|
|
|
|
|
|
|
|
Base Metals |
|
|
|
|
|
|
|
|
|
Palladium |
1,798.00 |
1,806.70 |
0.5% |
0.5% |
down |
down |
down |
|
|
Copper |
3.81 |
3.91 |
2.6% |
2.6% |
up |
neutral |
neutral |
|
|
|
|
|
|
|
|
|
|
|
|
Energy |
|
|
|
|
|
|
|
|
|
WTI Oil |
80.26 |
73.77 |
(8.1)% |
(8.1)% |
down |
down |
up (weak) |
|
|
Nat Gas |
4.48 |
3.71 (new lows) |
(17.2)% |
(17.2)% |
down |
down |
neutral |
|
Source: www.stockcharts.com
Note: For an explanation of the trends, see the glossary at the end of this article.
New highs/lows refer to new 52-week highs/lows and, in some cases, all-time highs.
Source: www.stockcharts.com
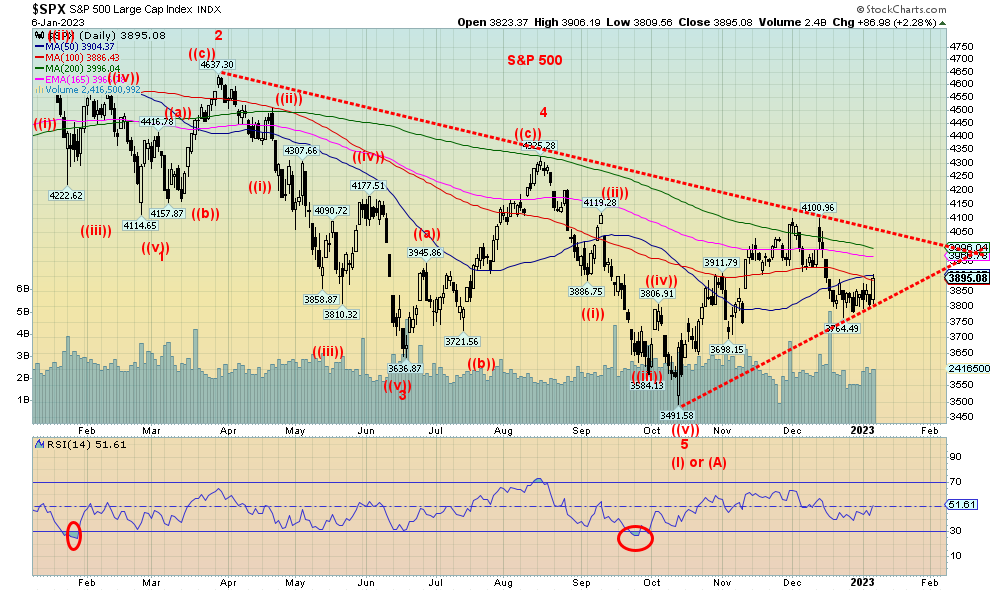
Stronger than expected job numbers appear to have saved the day for the stock market on Friday as Thursday’s negative day turned positive on Friday. On the week, the S&P 500 gained about 1.5%. As long as there isn’t a big down day on Monday the S&P 500 and the markets could finish the first five days trading days on a positive note. Friday’s up move took us right into a resistance zone for the S&P 500 of the converging 50- and 100-day MA near 3,900. That remains a resistance zone until we can clear 3,900. The Dow Jones Industrials (DJI) was up 1.5%, the Dow Jones Transportations (DJT) was a star, up 3.6% while the NASDAQ was weak, up only 1.0%. The S&P 400 Mid gained 2.5% while the S&P 600 Small Cap was up 2.4%. Here in Canada the TSX Composite gained 2.2% and the small cap TSX Venture Exchange (CDNX) was up 2.0%.
Overseas in the EU, the London FTSE gained 3.3% while the Paris CAC 40 was up 4.4%, the German DAX gained 3.7%, and the EuroNext 100 was up 5.1%. In Asia, China’s Shanghai Index (SSEC) gained 2.1%, the Tokyo Nikkei Dow (TKN) was down a small 0.5%, while the Hong Hang Seng Index (HIS) jumped 6.4%. The MSCI World Index was up a small 0.3%. Bitcoin started the year off on a positive note, up 1.6%. But, after losing 65.5% in 2022, we are not expecting much from the crypto market whose market cap has fallen to near $800 billion, down from over $2 trillion at its peak. A spectacular fall.
We continue to believe that the S&P 500 is forming some sort of bear pennant or flag after falling from the recent highs. We earlier noted the divergence between the DJI and the DJT where the DJI made higher highs but the DJT did not making a lower high. The mid-December breakdown seemed to confirm that divergence. Now we are forming a possible bear pennant or flag. The major indices have turned bearish with the short-term trend trading down. The S&P 500 is also on a weekly sell signal, although so far it is weak. We won’t rule out further gains, but we need to regain back above 3,900 and especially regain above 4,000 to convince us we are, instead, going higher. Above 4,000, new highs above 4,100 are highly likely. And the S&P 500 would break that downtrend line. Only the DJI had broken its downtrend line and that remained a divergence with the other major indices.
Most stock market indices are fairly neutral in here, thus keeping in place the more bearish outlook. A break now of 3,800 would give us a sell signal and under 3,700 would seal the deal. But even if we go higher, the market is not looking convincing that we are headed to any major new highs anytime soon. The only question on our mind right now is: is Friday’s upward burst the end of the rebound or will it prove to be the beginning of higher prices? We suspect the former, but won’t dismiss the latter until we break under 3,800.
Friday’s job report was positive for a market looking for a soft landing. With labour supply still rising but wage growth seemingly under control and below the rate of inflation, it is a perfect time for what one might call a Cinderella economy. And ultimately that’s good for the stock market. But is there a surprise lurking beneath?
Source: www.stockcharts.com
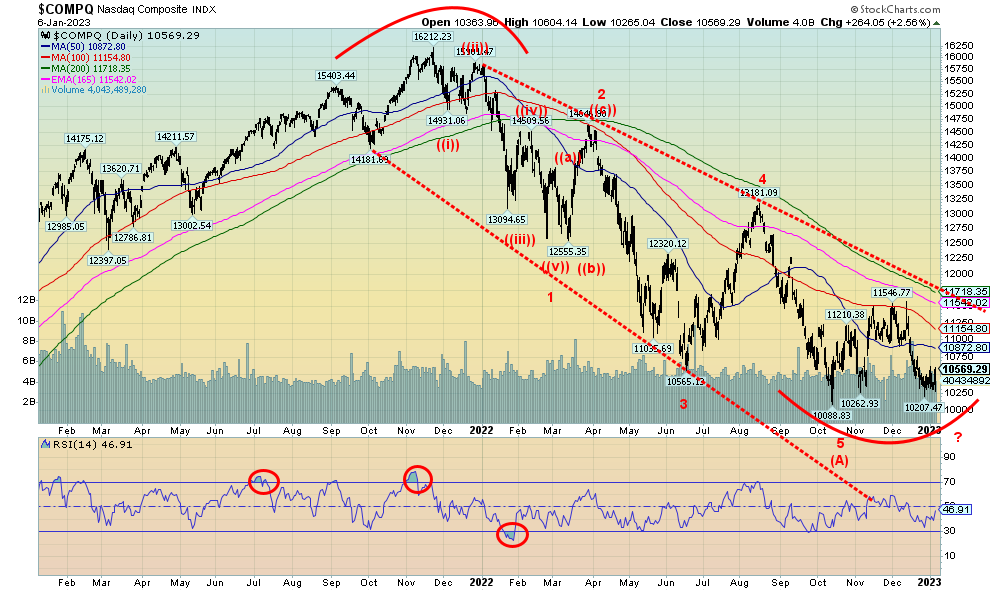
The NASDAQ continues to be the dog of the U.S. stock indices. Not only was it the worst-performing index in 2022, down 33.1%, but it was the worst performer of the past week with a gain of 1%. Not helping was the NY FANG Index falling 1.0% this past week. Those FAANGs saw Apple and Tesla fall to new 52-week lows. Apple lost 0.3% on the week but Tesla fell 8.3%. The good news for Tesla (hopefully) was that on Friday, after making a fresh 52-week low, it reversed and put in an outside trading day to the upside, gaining 2.5%. For Tesla, upside follow-through would be very positive this coming week. The big winners for the FAANGs were the Chinese stocks Alibaba, up 22.1%, and Baidu, up 17.0%. Both leaped as China announced opening up. Setting those two aside, Meta gained 8% and Netflix was up 7%. But the NASDAQ continues to languish and it’s a significant divergence with the rest of the market. Currently a break back under 10,250 would be quite negative while a break under 10,200 would assure new lows. The NASDAQ is on a sell signal and is the only major index we have pointed down for its dailies, weeklies, and monthlies.
Source: www.stockcharts.com
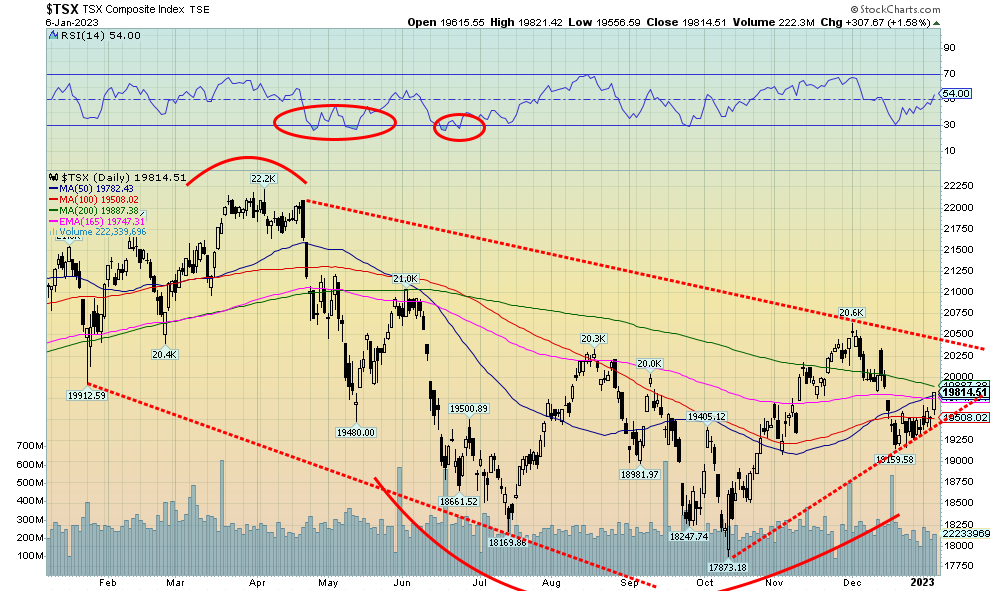
The TSX Composite followed the U.S. markets up this past week with a gain of 2.2%. The small cap TSX Venture Exchange (CDNX) also enjoyed an up week with a gain of 2.0%. Thirteen of the fourteen sub-indices were all up on the week. The biggest loser was Energy (TEN), down 4.2%. Since Energy is a significant part of the entire TSX representing, 19% of the entire index, that helped to keep the overall TSX down on the week. The largest component is Financials (TFS), representing 31.7% of the index. The biggest winner on the week was Golds (TGD), up 8.7%. Materials (TMT), the third largest component of the TSX representing 14.1% of the index, gained 6.5%. Metals & Mining (TGM) was up 6.8% while Health Care (THC), 2022’s biggest loser, rose 6.8%. Financials (TFS) were up only 2.1%.
The TSX, like the other indices, appears negative despite Friday’s up day. We are right back at resistance of the 200-day MA. Downtrend line resistance is seen up near 20,500. Unless we can clear that level, the trend has flipped to down once again. Support is seen around 19,500 and a break of that level and especially under 19,250 would send the TSX lower. So far, this pattern appears to us as a bear pennant or flag and Friday’s good up day may have ended it. Unless, of course, we can break up through 19,800 and begin to challenge the 20,500-resistance zone. Volume to the upside has not been favourable with the strong volume coming on down days. The TSX Bullish Percent Index (BPTSE) has been falling, currently at 46.6% below the 50% line. Notably the BPTSE made lower highs recently, even as the TSX made slightly higher highs. On a positive note, some 54% of TSX stocks are trading above their 200-day MA. But that’s down from a recent high of 58%.
10-year Treasury Bond/Canadian 10-year Government Bond (CGB)
Source: www.tradingeconomics.com, www.home.treasury.gov, www.bankofcanada.ca
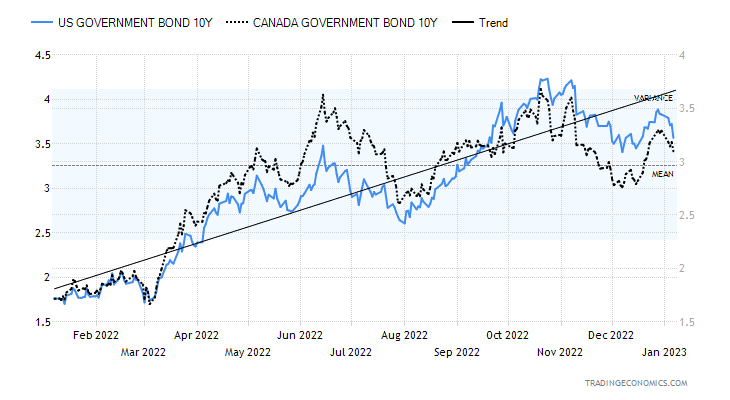
Despite better-than-expected job numbers this past week, U.S. treasury yields slipped with the 10-year U.S. treasury note falling to 3.57% from 3.88% the week before. In Canada, the 10-year Government of Canada bond (CGB) dropped to 3.10% from 3.29%. The prime reason for the drop was the bond market appears to be looking beyond the strong job numbers and focusing on thoughts of a shallow recession, and, that the Fed will ease up on its rate hikes, while wage growth in December was slowing even as jobs surged, and ISM factory orders and services data showed a decline even as ISM manufacturing rose. The fall in the 10-year helped widen the 2-year–10-year spreads. The U.S. 2–10 spread widened to negative 69 bp from negative 55 bp and the Canadian 2–10 spread jumped to negative 88 bp from negative 76 bp. Our 2–10 and 3 month–10 spread continue to point to a recession this year. All this despite predictions that any recession will be shallow or, for some forecasters, just a mild slowdown.
Have bond yields topped? New lows in yields would suggest we have further to fall. But with the central banks (Fed, BofC) still on the side of tightening, odds do not favour big drops here. A breakdown under 3% for both the U.S. 10-year and the CGB would help signal lower yields.
Source: www.stockcharts.com
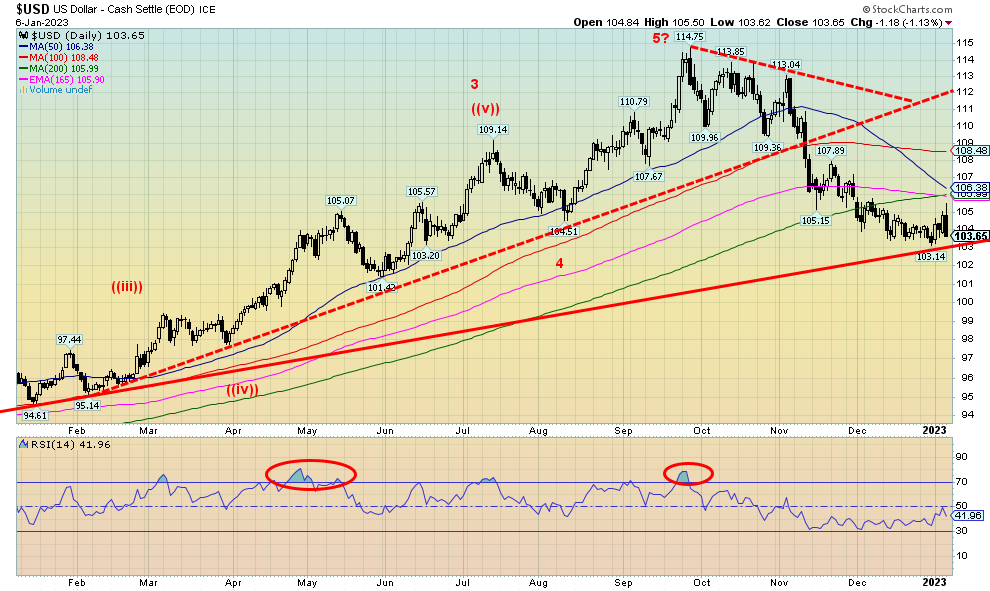
Is the US$ Index on the cusp of bigger breakdown? We have to ask ourselves that as the US$ Index reversed course on Friday and fell sharply down 1.1% on the day. It is now sitting just above its long-term up trend line near 103. A firm breakdown under 103 could send the US$ Index down swiftly towards long-term support near 100 and 95. On the week, the US$ Index was actually up, gaining 0.4%, but whatever gain it had was mostly lost on Friday. The star of the week was the Canadian dollar, boosted by the blockbuster job numbers on Friday. The Canadian dollar was up 0.8% on the week. But all the other major currencies were down with the Japanese yen off 0.7%, the euro down 0.6%, the Swiss franc off 0.4%, and the pound sterling flat. The December 30 low at 103.14 appeared to give the US$ Index life, bouncing off that line near 103. But Friday’s outside day reversal to the downside signals we should have further downside to go. Assuming it is not a head fake, we should break under 103.
Source: www.stockcharts.com
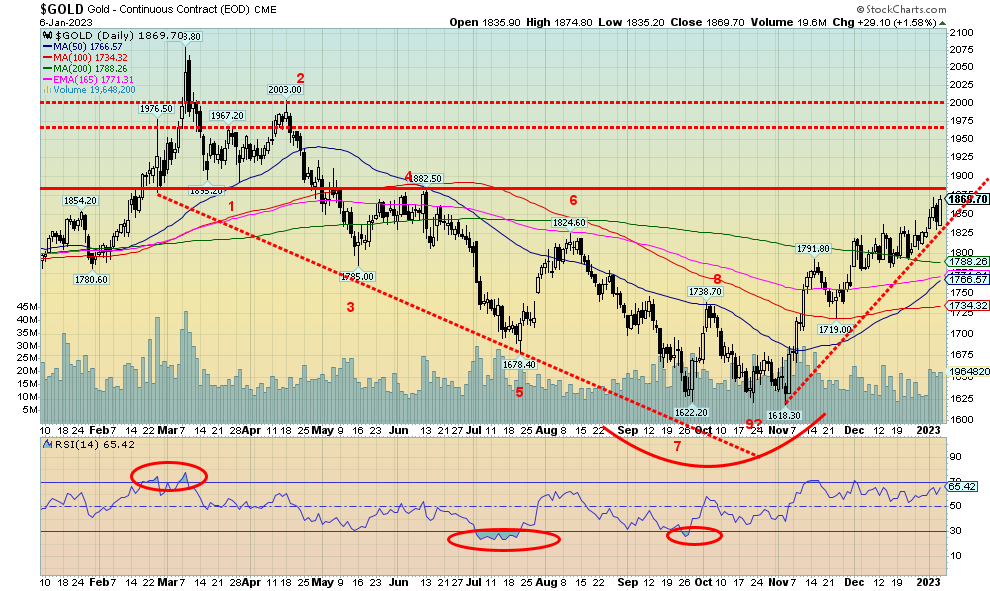
On Thursday, gold and the stock markets reacted negatively to the higher-than-expected ADP employment numbers and the sharp drop in weekly unemployment claims. On Friday, despite slightly higher-than-expected nonfarm payrolls, the market rallied. By the end of the day (and week), gold made new highs for the current up move. The gain on the week was, however, only 2.4%. That was decent, considering the US$ Index was also up on the week, although on Friday the US$ Index was hit hard but finished the week up 0.4%. Gold also diverged with silver, something we don’t like to see, as silver actually slipped about 0.3% and, unlike gold, did not make new highs for the move. Platinum had a good week, up 2%, and palladium rebounded, up 0.5%. A big winner was copper, up 2.6%, as China opened up again. However, what is going on in China could change on whim as they are having COVID problems. The gold stocks had a very good up week as the Gold Bugs Index (HUI) jumped 9.6% and the TSX Gold Index (TGD) was up 8.7%. Are the gold stocks leading?
In closing at $1,869.70, gold is firmly into our $1,825/$1,875 resistance zone we need to break if we are to move to the next level. However, we note we still haven’t broken through. Once through $1,875 on a close basis and especially above $1,900, the next resistance zone is up at $1,950/$1,960. Above that we see resistance also at $2,000. Solid closes above $1,970 would suggest to us that new highs are possible above $2,079/$2,089.
However, first we must get through $1,875. And we need to see silver join gold in making new highs. On our cycles that we have often noted, we are not convinced that our 7.83-year and 23.5-year cycle low is actually in. We’ve seen no big capitulation move as we did in 2008, for example, although the low in 2015 was made slowly. We are in the time zone for our major cycle lows but they do stretch out until 2025. So, it remains possible we have made our low. We’ll feel better about whether the low is in if we can close above $1,970. New all-time highs will seal the deal.
China reported an increase in its gold reserves for the first time in more than three years, shedding some light on the identity of the mystery buyers in the bullion market. The People's Bank of China raised its holdings by 32 tons in November from the month before, according to data on its website on Wednesday. Then, in December, China was reported to have added another 30 tonnes. China holds the world’s seventh largest central bank gold reserves, behind the U.S., Germany, IMF, Italy, France, and Russia. Both China and Russia have been significant buyers of gold for their reserves over the past few years. It is believed it is all part of trying to back their currencies, the yuan and ruble, with gold as they challenge global U.S. dollar hegemony. It is significant that they have been adding to gold reserves even as they reduced their holdings of U.S. dollar treasuries. Over the past year, China’s holdings of U.S. dollar treasuries have fallen almost $156 billion. Interestingly, Japan’s has as well and is down $242 billion. Russia holds no U.S. treasuries. Indeed, the Central Bank of Russia is sanctioned from buying U.S. treasuries. Russian reserves are mostly gold. Russia has the world’s second largest reserves of mineable gold in the ground. China ranks number 8 just behind Canada. Australia holds the world’s largest goldmine reserves.
Gold remains in a nice uptrend and our daily, weekly, and monthly trend indicators are all pointed up. Silver is pointed up as well, although its long-term (monthly) trend remains weak so far.
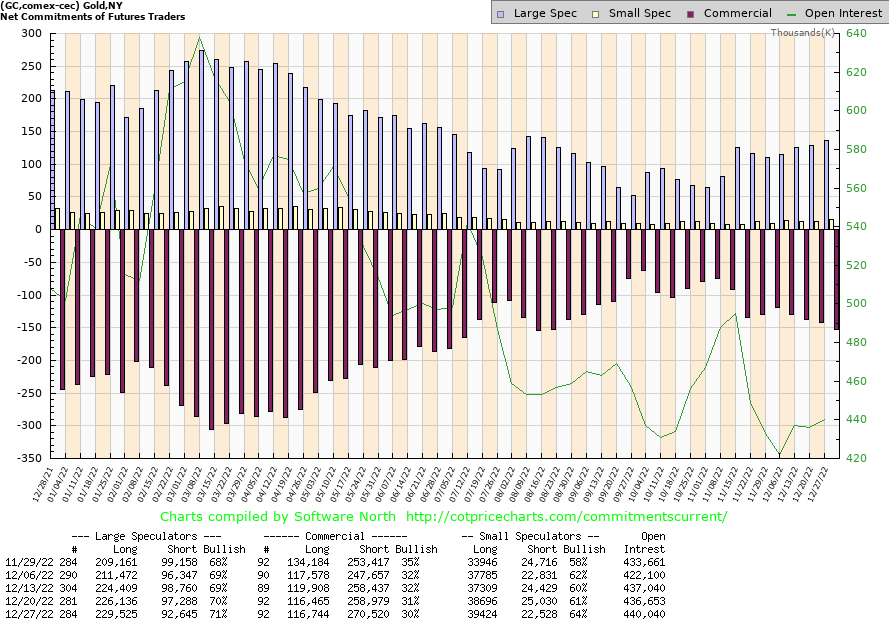
Source: www.cotpricecharts.com
The gold commercial COT (bullion companies and banks) slipped to 30% this past week from 31%. Long open interest was steady but short open interest rose by roughly 12,000 contracts. The large speculators COT (hedge funds, managed futures etc.) rose to 71% from 70% as they added roughly 3,000 longs and shed almost 5,000 shorts. The commercial COT is sliding, but still not in what we would call super-bearish territory. As the market rises, our expectations are that the commercial COT would fall.
Source: www.stockcharts.com
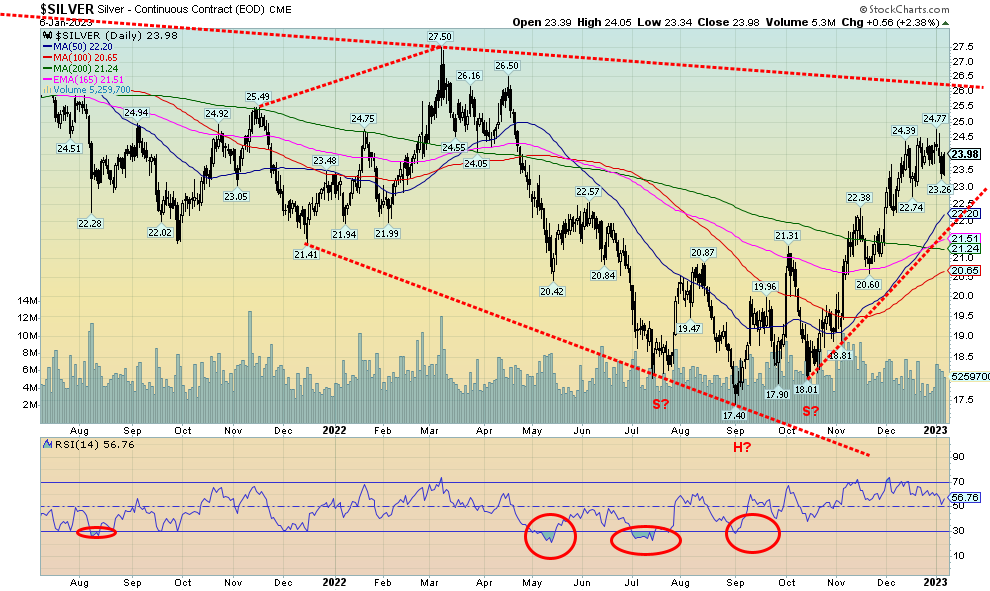
We noted the divergences between the DJI and the DJT. This week we had a divergence between gold and silver. Gold made new highs for the current move; silver did not. Silver actually fell almost 0.3% this past week, even as gold was up 2.4%. Silver closed just under $24, an area we have defined as important to break over and hold. Major resistance for silver can be seen up to $26. But above that level a run to $30 is possible. Silver is holding an uptrend. As long as we don’t close below $22.75, we should be okay. The uptrend line comes in just above $22. Did silver top out this week? That’s hard to say unless we break under $22.75 as noted. Only new highs above $24.77 could change any negative scenario that may be building.
Source: www.cotpricecharts.com
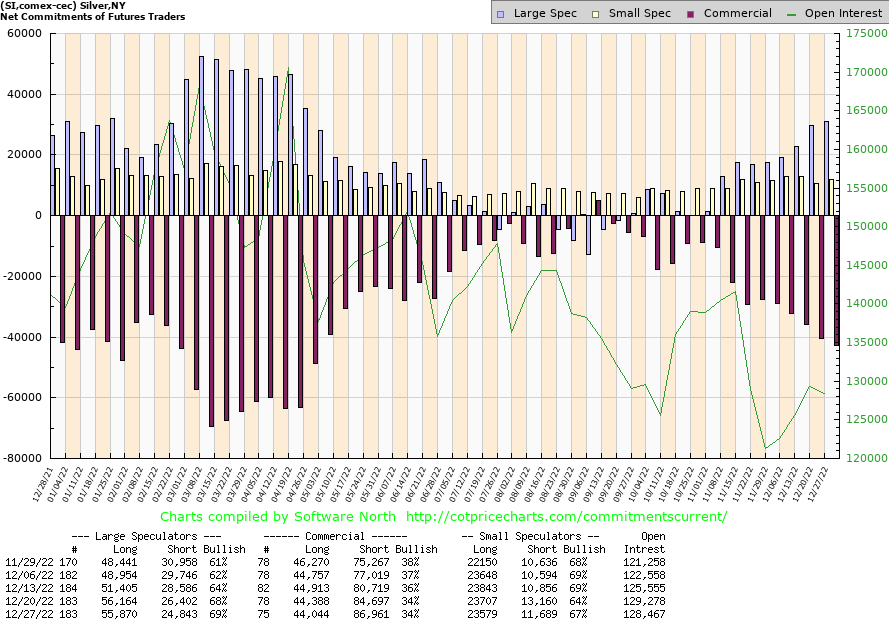
The silver commercial COT held at 34% this past week, well down from the 40% levels seen earlier before this current rally got underway. On the week, commercial longs were steady but they added roughly 2,000 contracts to shorts. The large speculators COT rose slightly to 69% from 68% as they cut their long position slightly but dropped their short position by almost 2,000 contracts. Given it was a pretty flat week for silver prices, the overall open interest was largely unchanged. The commercial COT is still friendly but waning.
Source: www.stockcharts.com
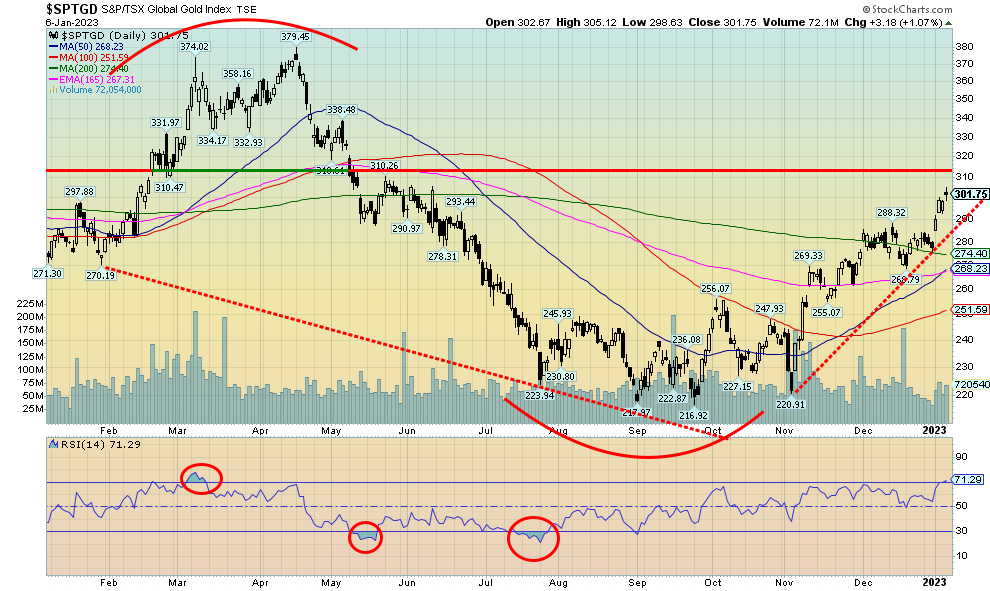
The gold stocks had a very good week as the TSX Gold Index (TGD) jumped 8.7% and the Gold Bugs Index (HUI) was up 9.6%. Some gold stocks jumped 10% +. Barrick Gold (ABX, GOLD) and Newmont Mining (NEM), the two largest gold miners in the world, were both up over 10%. Still, those companies are puny beside the tech giants. That the universe of gold mining companies is small and the market cap small explains why a good flow of money into the sector can move it very quickly. Nonetheless, the TGD jumped to its highest level since June. However, some resistance can now be seen just above. The TGD has resistance roughly from 310 up to 320, but above that it could start to challenge the highs of March 2022. Above 342 new highs are highly probable. Difficult to comprehend but the all-time highs for the TGD and the HUI were made back in 2011 with the TGD at 455 and the HUI at 639. For the TGD that’s an additional 50% gain and for the HUI it would need to add 155% to reach those levels. We can’t help but notice that the RSI for the TGD is now at 71.3, indicating that it could be considered overbought. However, overbought can remain in place for some time. Some backing and filling to this past week’s rise would help ease some of the overbought conditions. So far, volume on this last up move has not been impressive. Either the rally isn’t being believed or it’s a sucker rally. Clearing above 330 and especially above 340 would go a long way to ending those thoughts. Support is now down to around 275, but below that support comes in down to 250. Below 250 the market could be in trouble. The Gold Miners Bullish Percent Index is at 48, certainly nowhere near the levels seen last March when it peaked out at 83. So that suggests we have room to move higher.
Source: www.stockcharts.com
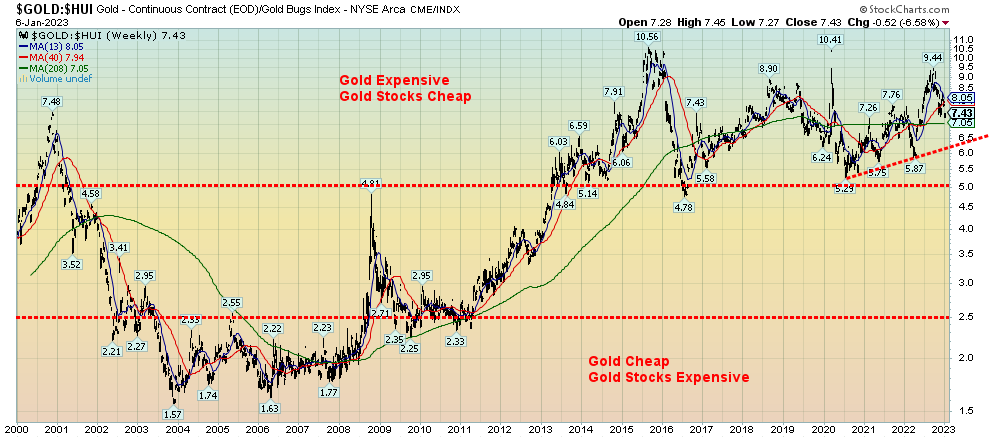
Gold stocks have been cheap for so long we’ve come to believe it’s normal. But from 2002 to 2008 gold stocks were relatively expensive vis-à-vis gold. Should the gold bugs be so lucky. We continue to trace out what appears to us a huge multi-year topping pattern, so those holding the gold stocks may experience some joy yet. This past week the Gold/HUI ratio fell 6.6%. But it is still high. The 4-year MA is just below at 7.05 while trendline breakdown is near 6.50 and the breakdown zone is quite a distance away at 5.00. If joy comes to gold stock land, the ratio will eventually fall under 2.50 and even down to the levels of the early 2000s near 1.50/1.75. But like gold itself, there is quite a bit of work to be done just to break that topping pattern. Ten years is a long time.
Source: www.stockcharts.com
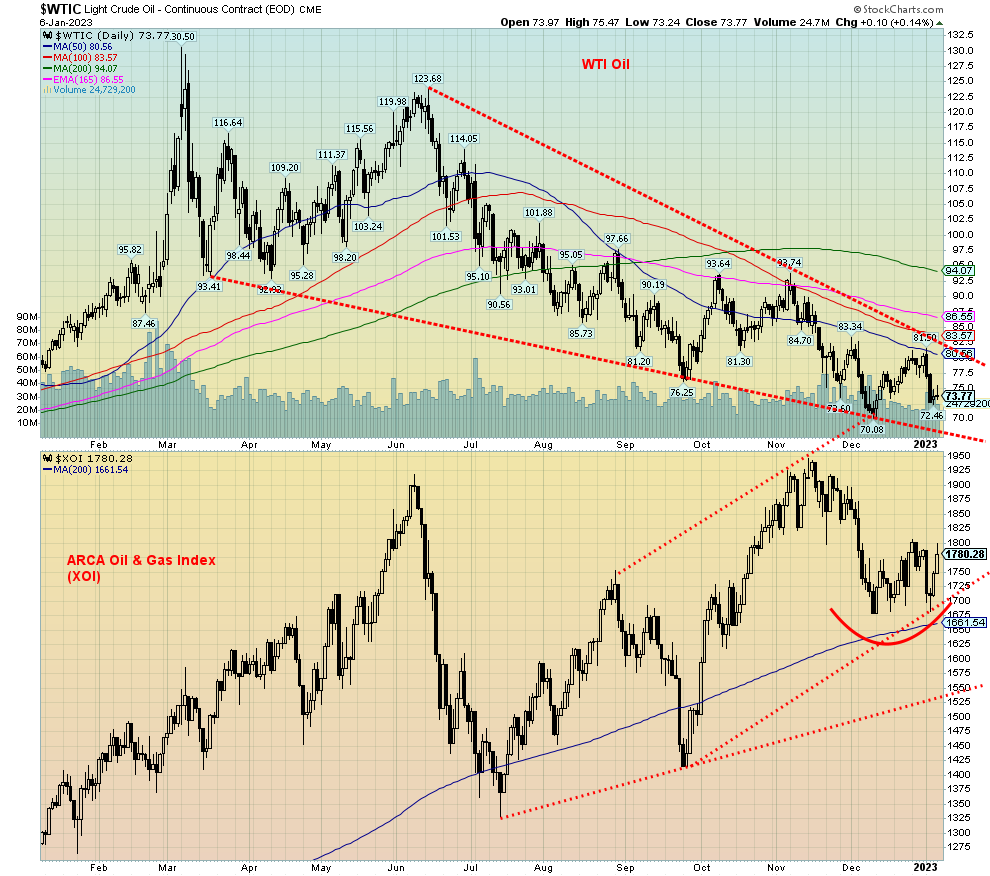
Well, that’s a pretty lousy start to the year for the oil market. Oil, natural gas, and the energy stocks were the worst performers to open the new year. Down they went. WTI oil was down 8.1%, Brent oil was off 5.7%, natural gas (NG) got hammered, down 17.2%, and EU natural gas wasn’t spared, off 8.9%. In some ways, the energy stocks fared better with the ARCA Oil & Gas Index (XOI) down a paltry 0.4% while the TSX Energy Index (TEN) was off 4.2%.
So, what’s all the fuss? Seems that fear of recession dominated throughout the week. They might want to change that view following the release of the job numbers on Friday. WTI oil did bounce a bit, but not
significantly. However, the energy stocks rebounded, along with the stock market. Maybe the stocks are leading. Not helping matters much for oil prices has been the ongoing saga in China. Are they closed, open, or what are they? Nigeria apparently came back on stream so that helped supply. Nigeria is an OPEC member. China’s latest reopening helped copper prices jump this past week so maybe it injects oil this coming week.
But it’s NG that has been taking a beating. EU NG at the Dutch hub has fallen 52% since mid-December, largely on the back of unseasonably warm weather. As well, EU countries did get a fill of gas from record LNG imports; plus, they’ve picked up gains in renewable energy such as wind and solar. Apparently, gas storages across the EU are 83.5% filled. The 5-year norm is 70% filled. The EU still has to compete for imports elsewhere with the Asian behemoths. Although they are getting substantial imports from Russia as they ignore US and EU sanctions.
Technically WTI oil still appears to be making a huge descending wedge triangle. The bottom of the triangle is down around $68 which is the zone of long held targets. The breakout comes above $84 but the reality is WTI needs to rise above $95 to convince us that we are going higher. But if the wedge works, WTI could return to the $120/$125 range.
Source: www.stockcharts.com
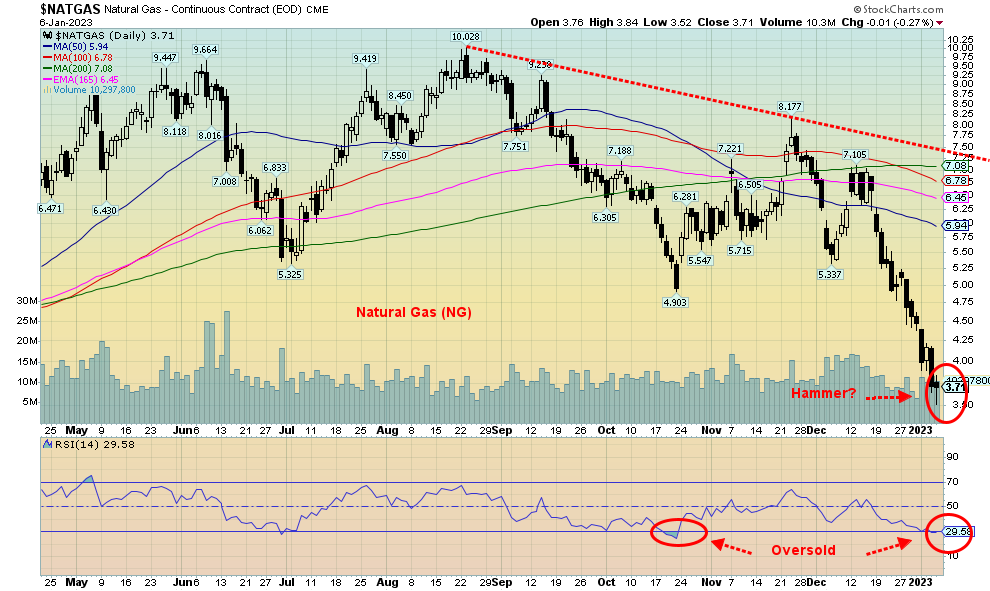
NG has fallen like a stone off over 50% since mid-December. It is now oversold, although that is just a state that can stay with us for some time. With a low this week of $3.52, NG put in 52-week lows. On Friday, NG rebounded by the close and ended the day essentially flat. Friday’s action left what might be a Japanese
candlestick pattern known as a hammer. The hammer forms when the market opens plunges then returns to
the open or slightly higher and then closes at or near that opening level leaving us pattern that looks like a hammer.
We also note that volume has fallen off sharply on this plunge, making the drop somewhat suspect. Nonetheless, we’d have to see NG regain back above $4.50 to suggest to us that a low might be in. We await.
A terrible start for oil and gas in 2023. NG was one of the best performers in 2022 so maybe this was overdue. However, signs are there that could see energy prices rebound this coming week.
Copyright David Chapman, 2023
|
GLOSSARY Trends Daily – Short-term trend (For swing traders) Weekly – Intermediate-term trend (For long-term trend followers) Monthly – Long-term secular trend (For long-term trend followers) Up – The trend is up. Down – The trend is down Neutral – Indicators are mostly neutral. A trend change might be in the offing. Weak – The trend is still up or down but it is weakening. It is also a sign that the trend might change. Topping – Indicators are suggesting that while the trend remains up there are considerable signs that suggest that the market is topping. Bottoming – Indicators are suggesting that while the trend is down there are considerable signs that suggest that the market is bottoming. |
David Chapman is not a registered advisory service and is not an exempt market dealer (EMD) nor a licensed financial advisor. He does not and cannot give individualised market advice. David Chapman has worked in the financial industry for over 40 years including large financial corporations, banks, and investment dealers. The information in this newsletter is intended only for informational and educational purposes. It should not be construed as an offer, a solicitation of an offer or sale of any security. Every effort is made to provide accurate and complete information. However, we cannot guarantee that there will be no errors. We make no claims, promises or guarantees about the accuracy, completeness, or adequacy of the contents of this commentary and expressly disclaim liability for errors and omissions in the contents of this commentary. David Chapman will always use his best efforts to ensure the accuracy and timeliness of all information. The reader assumes all risk when trading in securities and David Chapman advises consulting a licensed professional financial advisor or portfolio manager such as Enriched Investing Incorporated before proceeding with any trade or idea presented in this newsletter. David Chapman may own shares in companies mentioned in this newsletter. Before making an investment, prospective investors should review each security’s offering documents which summarize the objectives, fees, expenses and associated risks. David Chapman shares his ideas and opinions for informational and educational purposes only and expects the reader to perform due diligence before considering a position in any security. That includes consulting with your own licensed professional financial advisor such as Enriched Investing Incorporated. Performance is not guaranteed, values change frequently, and past performance may not be repeated.
About the author


Website: https://www.enrichedinvesting.com
Disclaimer: David Chapman is not a registered advisory service and is not an exempt market dealer (EMD) nor a licensed financial advisor. We do not and cannot give individualised market advice. David Chapman has worked in the financial industry for over 40 years including large financial corporations, banks, and investment dealers. The information in this newsletter is intended only for informational and educational purposes. It should not be considered a solicitation of an offer or sale of any security. The reader assumes all risk when trading in securities and David Chapman advises consulting a licensed professional financial advisor before proceeding with any trade or idea presented in this newsletter. David Chapman may own shares in companies mentioned in this newsletter. We share our ideas and opinions for informational and educational purposes only and expect the reader to perform due diligence before considering a position in any security. That includes consulting with your own licensed professional financial advisor.