
“The first panacea for a mismanaged nation is inflation of the currency; the second is war. Both bring in temporary prosperity; both bring in permanent ruin. But are the refuge of political and economic opportunists.”
—Ernest Hemingway, American writer, short story writer, journalist, 1954 Nobel prize for literature, author of For Whom the Bell Tolls (1940), and many more; 1899–1961
“The only thing I do know is that from chaos comes opportunity.”
—Daniel S. Loeb, American investor, hedge fund manager, philanthropist, founder and CEO of Third Point, a New York hedge fund with $14.8 billion AUM; b. 1961
“A weak currency is the sign of a weak economy, and a weak economy leads to a weak nation.”
—H. Ross Perot, American business magnate, billionaire, politician, philanthropist, founder and CEO Electronic Data Systems (EDS) and Perot Systems, independent candidate for President of the United States in 1992 and 1996; 1930–2019
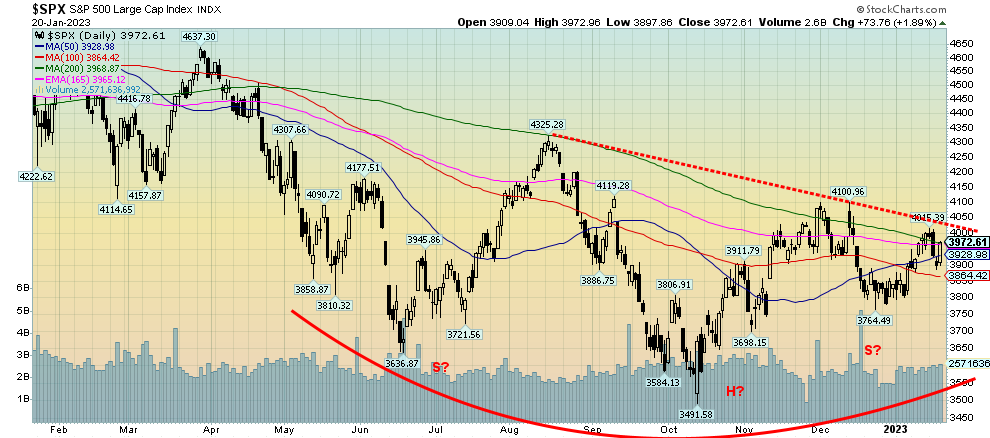
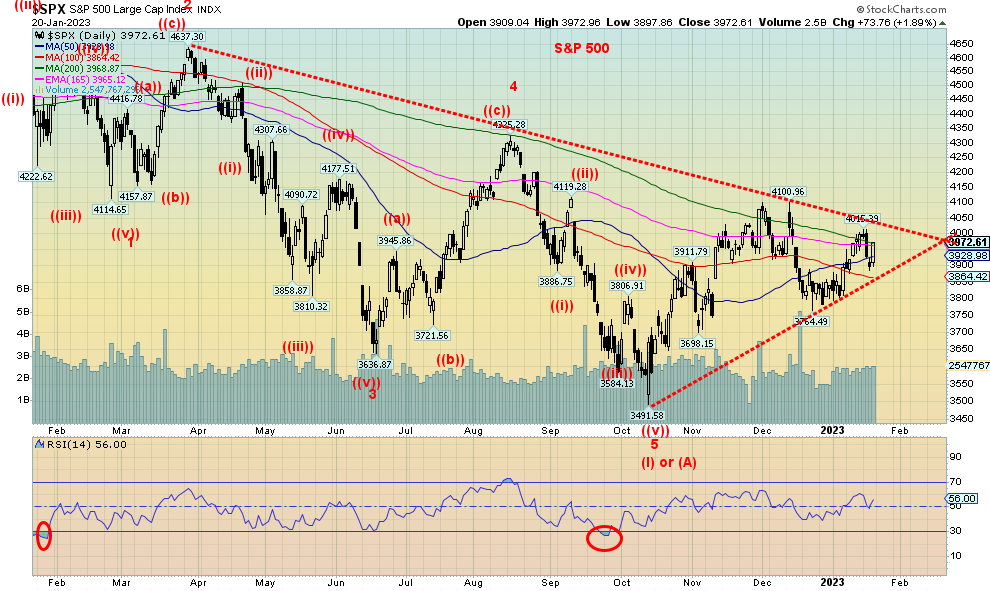
We seemed to have had thoughts of a bull market barely out when the markets turned down this week. A correction may have been overdue. But by week’s end the market rebounded and ended the week rather mixed. A breakdown now under S&P 500 3,800 would turn markets down for January and, instead, portend a down year.
Source: www.stockmarkets.com
The first five days or early warning system, as the Stock Trader’s Almanac (www.stocktradersalmanac.com) calls it, was positive and we can see that the 50-day MA is now crossing over the 100-day MA for the S&P 500. As well, pre-presidential election years are the most bullish of the four-year presidential cycle and the S&P 500 appears to be making a potential head and shoulders bottom reversal pattern. None of that, however, guarantees that 2023 will be an up year. Things could change. The head and shoulders pattern busts if the S&P 500 breaks below the right shoulder low of 3,765. The pattern is only a potential head and shoulders until it actually breaks to the upside.
2022 might have been a four-year cycle low, but that is measured from the December 2018 low. The well-known four-year cycle has a range of three to five years. Measuring from the important October 2002 low, we saw a shallow low in 2005, the financial crisis low in March 2009, the EU/Greek crisis low in October 2011, the end of quantitative easing (QE) low in August 2015/February 2016, and the pandemic panic of March 2020. The 2018 trade wars low did not fall on that cycle and was most likely a half-cycle low, albeit a steep one. The next four-year cycle is not due until 2023–25 which would coincide with six-year cycle low, 5–7-year range. For the six-year cycle, again measuring from 2002, there was the low in 2009, 2015/2016, and again pegging the next low to be anywhere from 2021 to 2023. It is completely possible that the 2022 low fits that cycle; however, we believe that came in too early. The way we confirm these cycle lows is new highs. So far, we have failed to take out either the S&P 500 August high at 4,325 or the December high of 4,100 let alone the all-time high of 4,818 seen in January 2022.
Markets, however, are turning bullish. Or at least they were. Sentiment indicators reached into the greed zone but did not cross into the extreme greed zone. No matter how we were looking at this rebound from the June and October 2022 lows, our view is that this is a bear market rally, not the start of a new bull market. Bear markets fall in waves of three - ABC. The June/October low for the S&P 500 only represents the A wave. The question is, was that rally out of the June low to the August high our B wave, or are we still working on the B wave? If we are, then we should see new highs or, at minimum, a flat. If it is a failure, then a breakdown under 3,800 could spell the end of this rebound. Note as well that while the Dow Jones Industrials (DJI) did break above its 200-day MA, and technicians are excited as the DJI made the “golden cross”, meaning the 50-day crossed over the 100- and 200-day MAs. But the “golden cross” crossover has only been confirmed by the Dow Jones Transportations (DJT). None of the other indices have confirmed. The S&P 500 is currently once again being pushed back at the 200-day MA. The NASDAQ is nowhere near its 200-day MA.
After a dismal 2022, it is no surprise that many are looking forward to a much better 2023. Inflation is abating, as seen by the lower-than-expected CPI and PPI. Employment is still strong, despite the announcement of layoffs at tech firms and Wall Street firms (Google, Microsoft, and Goldman Sachs, amongst others). Then again, those jobs are higher paying ones and a turndown in the tech and financial sectors could translate into job losses in the broader economy. Housing prices, which have softened, may come down more, particularly if the tech and Wall Street workers need to sell their high-priced houses.
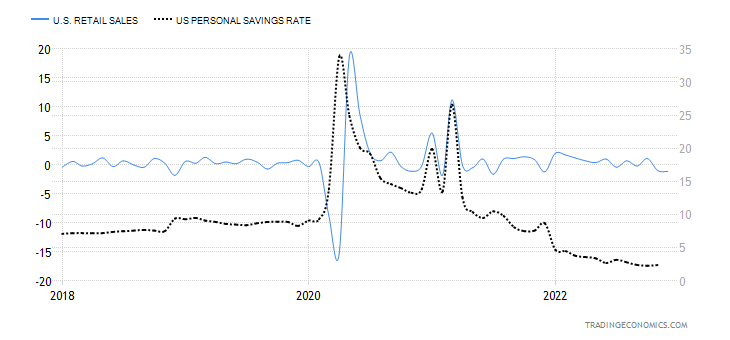
Retail sales also recorded a decline in December. It was the second consecutive monthly decline. Year-over-year (y-o-y) retail sales were still up 6%. Retail sales overall have been in a downtrend for months. Could it be that falling retail sales are linked to the very rapidly falling personal savings rate? The personal savings rate has
fallen to 2.4%. That’s the lowest level ever seen since recording of the rate began in 1959. At the height of the
pandemic in April 2020, personal savings hit a record high of 33.8%. Now they’re at a record low. It is said that 32% of Americans couldn’t come up with $400 for emergency expenses. Canada’s personal savings rate at the end of Q3 was 5.7%. By comparison, Canadians were flush with savings.
U.S. Retail Sales and Personal Savings Rate 2017–2022
Source: www.tradingeconomics.com, www.census.gov, www.bea.gov
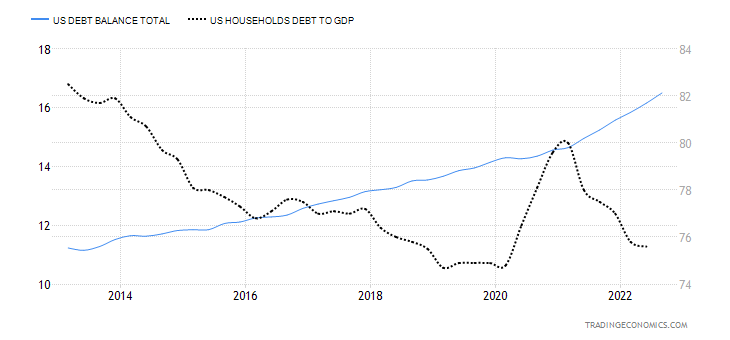
U.S. Household Debt and Household Debt/GDP 2012–2022
Source: www.tradingeconomics.com, www.nyfed.org, www.bis.org
U.S. household debt continues to climb. Latest numbers show a total of $16.5 trillion of household debt outstanding. This consists of auto loans, credit cards, mortgages, credit lines, and student loans. However, household debt to GDP continues to fall. This is well down from the peak seen before the 2008 financial collapse when it topped out at 100.9% vs. 75.6% today. Household debt in Canada reached $2.1 trillion as of October 2022. Canada has the fourth highest in the world for household debt to GDP last reported at 103.7%, higher than the U.S. was before the 2008 financial collapse. The U.S. ranks thirteenth.
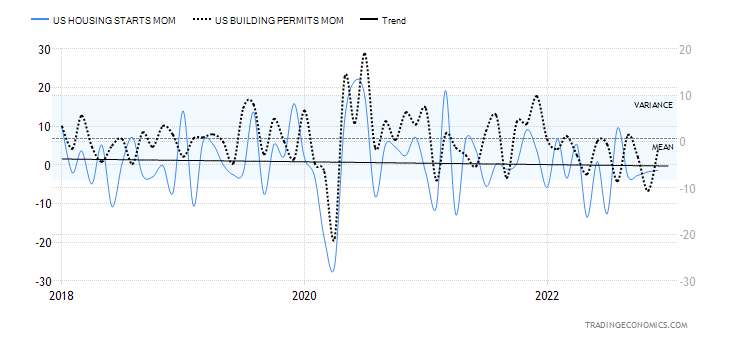
Another major area of concern is the housing market, a key driver of the U.S. economy. Housing starts and building permits have been on a downward trend for the past four months. The Schiller Home Price Index has been falling for four months. Construction spending and existing home sales have also been falling as well, with existing home sales now down for eleven consecutive months. New home sales are still hanging in but are down over the past few months.
U.S. Housing Starts and Building Permits Month-Over-Month 2017–2022
Source: www.tradingeconomics.com, www.census.gov
If household debt and the housing market are concerns, then the looming fight over the U.S. debt limit is of even bigger concern. The U.S. has now hit the debt limit (surpassed it, actually, as the limit is $31.4 trillion and the Federal debt last was at $31.5 trillion). The U.S. now has roughly seven months to resolve the problem and avoid what could be a catastrophic default. The U.S. Treasury department is embarking on a series of cash management maneuvers to delay a default. House Republicans are fiercely opposed to raising the debt limit without accompanying major cuts in U.S. spending. U.S. spending currently totals $6.2 trillion, which is roughly 24% of GDP. Of that $6.2 trillion, currently $4.1 trillion is allocated to Social Security, Medicare/Medicaid, military spending, and interest on the debt. Major cuts to the remaining $2.1 trillion could result in major shut downs of government operations and more. None of this accounts for what we would term off-balance sheet
spending, which is the unfunded liabilities of Social Security and Medicare. That currently totals a staggering $180.9 trillion. The budget deficit stands at around $1.4 trillion to $1.6 trillion, over 6% of GDP.
A U.S. default or even the threat of one could spark, besides a recession, a global financial crisis, loss of current benefits including Social Security and Medicare, higher interest rates, a debt downgrade, and loss of confidence in the U.S., resulting in a falling U.S. dollar. The U.S. would face a debt downgrade not dissimilar to what happened in 2011 during the last debt ceiling crisis when the U.S. lost its coveted AAA rating and was dropped to AA+. The U.S. is able to get away with high deficits because of its position as the world’s reserve currency. But if confidence were lost, the U.S. could see its reserve currency status under severe strain and challenge. Ultimately, that would be good for gold.
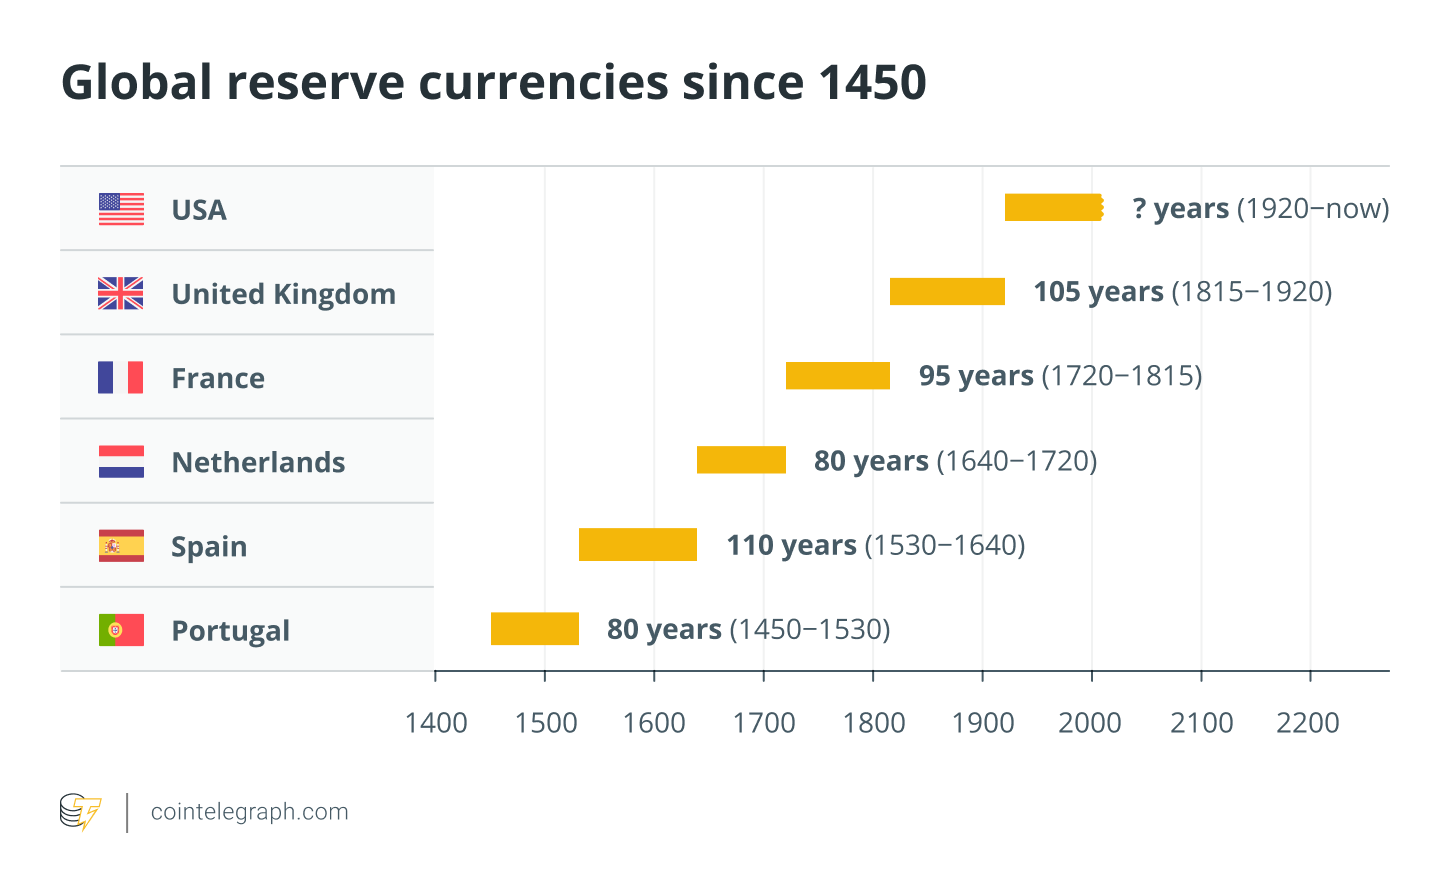
The problem of raising the debt limit is because the Republican hardliners have control. How this plays out is difficult to say. The U.S. has numerous cash management moves it can make to prolong things but eventually, come the fall, if all else fails, government could shut down and the world could be facing a U.S. debt default. The U.S. dollar is under pressure, not only because of a looming debt limit fight, but because it is under attack for its global use. China and Saudi Arabia are, it seems, prepared to deal for oil in yuan. If the U.S. were to lose its status as the global petrodollar and commodity dollar, that could end in a global war. History is replete with challenges to the supremacy of the great power of the day and the reserve currency of the time. All have resulted in global wars. Reserve currencies do not last forever. Life expectancy is around 200 to 250 years from when it first appears to its ultimate demise as the world’s reserve currency. Following ascendency as the world’s reserve currency, it lasts roughly 90–110 years. The U.S. dollar has been the ascendent reserve currency since the end of World War I and the demise of the pound sterling the worlds reserve currency at the time.
It has been said that cryptocurrencies, led by Bitcoin, will eventually replace the U.S. dollar. Given the recent collapse of the crypto market, that is most unlikely despite the recent rebound. More likely is what is known as a Central Bank Digital Currency (CBDC). This is a digital form of a fiat currency. It does not use any distributed ledger or blockchain. Central banks are already experimenting with them. They will be controlled, issued, and administered by central banks. The question is, will it replace cash itself? There are many who are concerned about a lack of privacy with the use of CBDCs. And could it elevate the underground economy to escape it. Many believe it will easily happen, given that most transactions today are already conducted by credit and debit cards. But many countries, especially emerging economies, use cash more than cards.
Another growing issue is numerous analysts are stating that World War III is already underway in Ukraine (latest from Gerald Celente, publisher of The Trends Journal [www.trendsjournal.com], a forecasting journal with an excellent 40-year track record). It is estimated that the West has already sent $113 billion of military aid to Ukraine. The entire Russian military budget is estimated at only $65 billion. U.S. troops are apparently already in Ukraine providing training and weapons inspections and most likely providing logistical and intelligence support, according to analysts. As well, U.S. troops are stationed and provide support for the U.S. embassy in Kiev. Ukraine, according to analysts, is a proxy war versus Russia, no different than the U.S. aiding a proxy war in Afghanistan against Russia in the 1980s and Russia aiding a proxy war against the U.S. from 2002 to 2022 also in Afghanistan. The question is, could the proxy war become a real war? A more serious outbreak
of war could devastate global stock markets, not dissimilar to what was seen at the outbreak of World War I and World War II and in the 1960s through the Vietnam War.
A Reserve Currency does not last forever – Reserve Currencies 1450–present
Source: www.cointelegraph.com
There are a number of wild cards going forward. One of the biggest is China lifting its zero-COVID policies. How quickly could the Chinese economy open up once again? China is also providing fiscal stimulus. But the other Chinese wild card is its overvalued property market and billions in loans that are essentially dead money. The property sector problems are also slowing construction activity. But an opening China could put upward pressure on steel, base metals, and oil prices. It was not surprising to see that coal, yes, dirty coal, was the best-performing commodity in 2022. Even Europe was firing up old coal plants to compensate for the loss of oil and gas primarily from Russia. China largely runs on coal, making them the largest contributor to emissions in the world.
Climate change is also a wild card. Scorching heat waves, droughts, floods, and more are playing havoc with agriculture. Wheat, corn, maize, soybean, and even sugar and coffee production all fell in 2022 and are expected to continue to fall into 2023, or at least not rebound. La Nina is stretching into its unheard-of third year. War (Russia/Ukraine) has also impacted the production of wheat, fertilizers, and more. Nonetheless, some areas are seeing bumper crops, in particular, Russia and Australia. But devastating droughts in Africa,
parts of Europe, and North and South America are helping to maintain downward pressure on a host of agricultural products, translating into higher food prices.
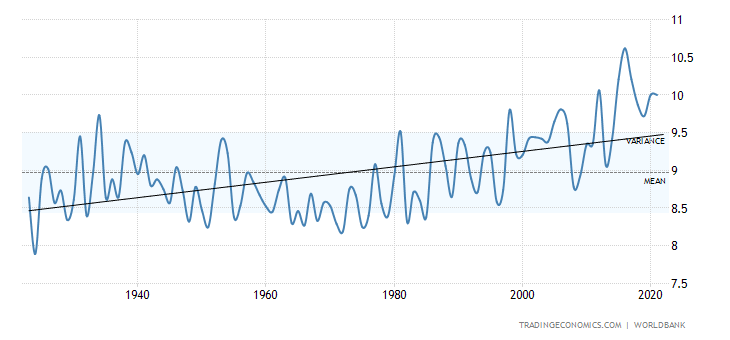
Global temperatures have been rising steadily for the past 40 years. The past decade has been the hottest recorded since recording began. The record high in the U.S. was 10.6° Celsius was hit in 2016. The record low was 7.6° Celsius in 1917 (These are annual averages). The average was 8.86° Celsius from 1901 to 2021. Not shown is precipitation where the pattern is similar, rising steadily over the past 40 years. Record precipitation was seen in the U.S in 2019 with 834.5 mm falling. The record low was in 1910 at 593.2 mm. The average 1901 to 2021 was 710.9 mm. Many climate scientists believe we are now hitting the point of no return. Costs to deal with climate change could be in the trillions of dollars with millions of people displaced, particularly in emerging economies but also in the developed world.
U.S. Average Temperatures 1922–2022
Source: www.tradingeconomics.com, www.worldbank.org
Chart of the Week
Source: www.stockcharts.com
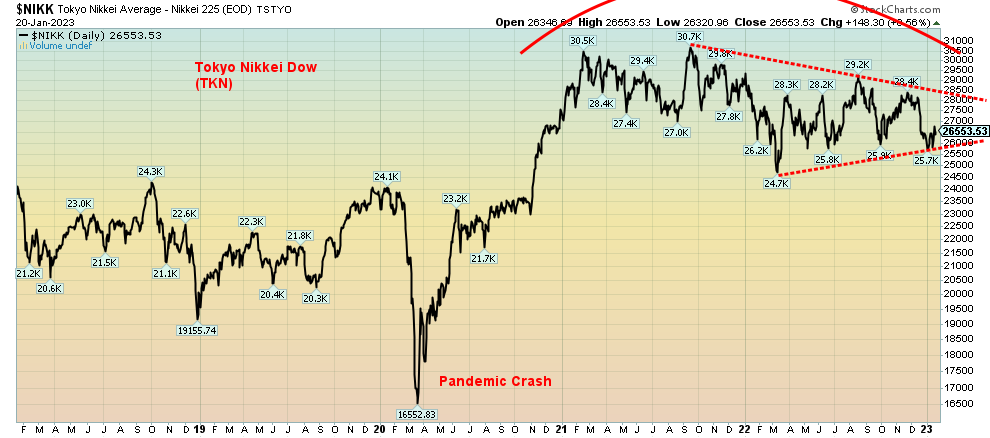
Is there a problem brewing in Japan, the world’s third largest economy? The chart of the Tokyo Nikkei Dow (TKN) is displaying a potential huge topping pattern. If that’s the case and it breaks under 25,500, downside targets could take the TKN to 19,500, a decline of 25% plus from current levels.
Japan once challenged the U.S. as the world’s largest economy. But that was back in the 1980s before a huge property and stock market bubble got underway. Then the bubble burst, Japan entered what became the lost decade of the 1990s. Only the lost decade has stretched into lost decades. The high in September 2021 near 30,800 is the closest the TKN has ever come to the early 1990 high near 38,900. The TKN bottomed in March 2009 near 7,100, down some 82% from its 1990 high.
Japan has been a country that has tried to maintain tight control on the economy. They embarked on what effectively were numerous attempts at QE as the Bank of Japan (BOJ) purchased both bonds and stocks. The BOJ now holds an estimated 43.3% of Japanese debt. Its federal debt to GDP currently stands at 266%, the world’s highest for any government. The debt is primarily issued in Japanese yen and little is traded on international markets. Contrast Japan’s debt to GDP with that of the U.S., which is still at elevated levels of 121.5% of GDP. Canada’s federal debt is just over 50% of GDP. Add in the Canadian provinces’ debt and the government debt to GDP rises to over 100%.
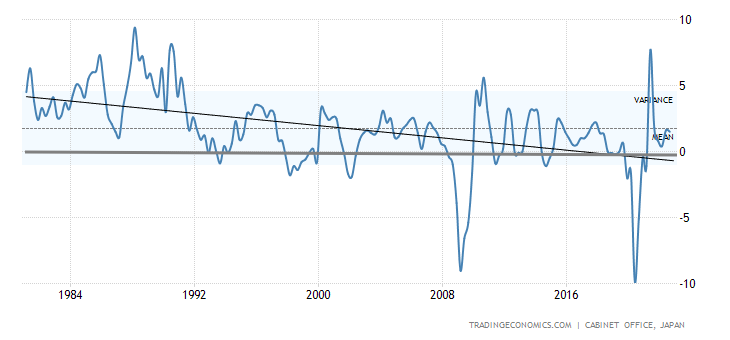
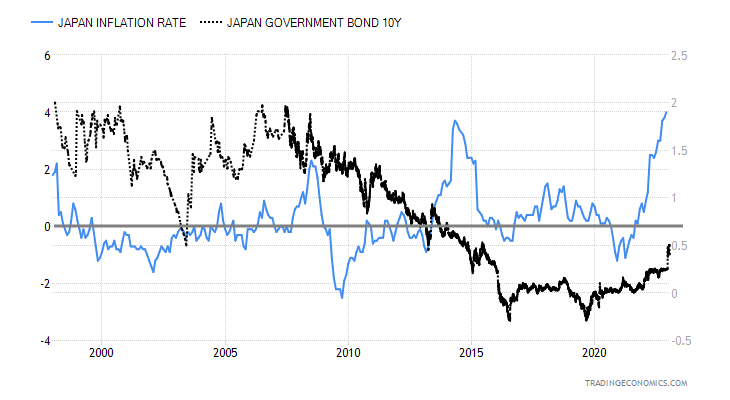
Japan’s GDP growth has been on a steady downward trend since peaking in the late 1980s. On numerous occasions over the past 30+ years, GDP growth has been negative as the Japanese economy falls into recession. Japan’s heavy role in the economy has distorted its markets. For years after the financial crisis of 2008, Japan has kept interest rates artificially low, even embarking on negative interest rates. The 10-year
Japanese Government bond known as JGBs has held negative interest rates for years. But now interest rates are rising and that is translating into huge losses on bond portfolios. Still, the government is determined to hold Japanese 10-year rates in a tight range of 0% +/- 0.5%. That peg is now coming under pressure.
Inflation has largely been kept under control and on numerous occasions it has been quite deflationary, falling below 0%. But now inflationary pressures have been building. Japan has supply disruptions that have hurt them. They do not have any wealth of natural resources and have to import everything including oil, base metals, and more to drive its industries. Inflationary pressures are translating into wage demands from a restless labour force. All are conspiring to put an end to Japan’s ultra-loose policies.
The trouble is, Japan’s companies have long been shielded from high interest rates or even recognizing that they are bankrupt. They call them Japan’s zombie companies. Japan has been described as a zombie economy.
Japan GDP Annual Growth Rate 1980–2022
Source: www.tradingeconomics.com, www.cao.go.jp
Japan has considerable problems. Besides being heavily dependent on imports of commodities, they are also heavily trade dependent on China. Much of Japan’s manufacturing investments are in China. Japan’s economy has been one of stagnation now for over thirty years. The COVID pandemic worsened things and Japan’s recovery from COVID has been slow compared to others. They are facing rising interest rates, rising labour costs, and deepening political problems, possibly highlighted by the assassination of former prime minister Shinzo Abe, known for his version of Abenomics, in July 2022. Japan has a low birth rate, one of the lowest in the world, and an aging population, one of the highest in the world with 16% of its population age 85 or over. All of this puts pressure on its labour market. They have one of the highest payouts in the world for social security.
Consumer confidence has been falling and the younger population is restless and dissatisfied. Can Japan afford to let the zombie companies that should have failed long ago continue? If Japan were to fall into a steep recession or worse, what would it mean to the world economy when, as we stated, Japan is the world’s third largest economy. The stock market looks very suspect and a breakdown would not be surprising.
Japan Inflation vs. Japan 10-year Government Bond (JGBs) 1997–2022
Source: www.tradingeconomics.com, www.stat.go.jp
Markets & Trends
|
|
|
|
% Gains (Losses) Trends |
|
||||
|
|
Close Dec 31/22 |
Close Jan 20/23 |
Week |
YTD |
Daily (Short Term) |
Weekly (Intermediate) |
Monthly (Long Term) |
|
|
Stock Market Indices |
|
|
|
|
|
|
|
|
|
`S&P 500 |
3,839.50 |
3,972.61 |
(0.7)% |
3.5% |
neutral |
neutral |
neutral |
|
|
Dow Jones Industrials |
33,147.25 |
33,375.49 |
(2.7)% |
0.7% |
down |
up |
up |
|
|
Dow Jones Transport |
13,391.91 |
14,536.43 |
1.2% |
8.6% |
up |
up |
up (weak) |
|
|
NASDAQ |
10,466.48 |
11,140.43 |
0.6% |
6.4% |
up (weak) |
down (weak) |
down (weak) |
|
|
S&P/TSX Composite |
19,384.92 |
20,503.21 |
0.7% |
5.8% |
up |
up |
up (weak) |
|
|
S&P/TSX Venture (CDNX) |
570.27 |
623.81 |
1.4% |
9.4% |
up |
neutral |
down |
|
|
S&P 600 (small) |
1,157.53 |
1,223.39 |
(1.3)% |
5.7% |
up |
up |
up (weak) |
|
|
MSCI World Index |
1,977.74 |
2,091.50 |
0.4% |
5.8% |
up |
up |
neutral |
|
|
Bitcoin |
16,535.23 |
21,170.49 |
9.9% |
28.0% |
up |
neutral |
down (weak) |
|
|
|
|
|
|
|
|
|
|
|
|
Gold Mining Stock Indices |
|
|
|
|
|
|
|
|
|
Gold Bugs Index (HUI) |
229.75 |
259.0 |
(0.5)% |
12.7% |
up |
up |
neutral |
|
|
TSX Gold Index (TGD) |
277.68 |
307.68 |
(1.1)% |
10.8% |
up |
up |
neutral |
|
|
|
|
|
|
|
|
|
|
|
|
% |
|
|
|
|
|
|
|
|
|
U.S. 10-Year Treasury Bond yield |
3.88% |
3.48% |
(0.9)% |
(10.3)% |
|
|
|
|
|
Cdn. 10-Year Bond CGB yield |
3.29% |
2.85% |
(1.7)% |
(13.4)% |
|
|
|
|
|
Recession Watch Spreads |
|
|
|
|
|
|
|
|
|
U.S. 2-year 10-year Treasury spread |
(0.55)% |
(0.70)% |
2.8% |
(27.7)% |
|
|
|
|
|
Cdn 2-year 10-year CGB spread |
(0.76)% |
(0.75)% |
3.9% |
1.3% |
|
|
|
|
|
|
|
|
|
|
|
|
|
|
|
Currencies |
|
|
|
|
|
|
|
|
|
US$ Index |
103.27 |
101.78 |
(0.2)% |
(1.4)% |
down |
down |
up |
|
|
Canadian $ |
73.92 |
74.74 |
flat |
1.1% |
up |
down (weak) |
down |
|
|
Euro |
107.04 |
108.58 |
0.2% |
1.4% |
up |
up |
down |
|
|
Swiss Franc |
108.15 |
108.66 |
0.6% |
0.5% |
up |
up |
neutral |
|
|
British Pound |
120.96 |
124.03 |
1.4% |
2.5% |
up |
up |
down |
|
|
Japanese Yen |
76.27 |
77.18 |
(1.3)% |
1.2% |
up |
up |
down |
|
|
|
|
|
|
|
|
|
|
|
|
|
|
|
|
|
|
|
|
|
|
Precious Metals |
|
|
|
|
|
|
|
|
|
Gold |
1,826.20 |
1,928.20 |
0.3% |
5.6% |
up |
up |
up |
|
|
Silver |
24.04 |
23.93 |
(1.8)% |
(0.5)% |
up |
up |
up (weak) |
|
|
Platinum |
1,082.90 |
1,047.80 |
(2.3)% |
(3.2)% |
up |
up |
up |
|
|
|
|
|
|
|
|
|
|
|
|
Base Metals |
|
|
|
|
|
|
|
|
|
Palladium |
1,798.00 |
1,723.20 |
(3.6)% |
(4.2)% |
down |
down |
down |
|
|
Copper |
3.81 |
4.25 |
0.9% |
11.6% |
up |
up |
up (weak) |
|
|
|
|
|
|
|
|
|
|
|
|
Energy |
|
|
|
|
|
|
|
|
|
WTI Oil |
80.26 |
81.64 |
2.2% |
1.7% |
up |
down |
up (weak) |
|
|
Nat Gas |
4.48 |
3.17 (new lows) |
(7.3)% |
(29.2)% |
down |
down |
neutral |
|
Source: www.stockcharts.com
Note: For an explanation of the trends, see the glossary at the end of this article.
New highs/lows refer to new 52-week highs/lows and, in some cases, all-time highs.
Source: www.stockcharts.com
The week did not start out well but ended on a positive note. Initially, it appeared as if it might be a sharp down week but then the market turned around Friday, fooling everyone, and on the week markets ended rather mixed. The S&P 500 lost 0.7 while the Dow Jones Industrials (DJI) fell 2.7%. But the Dow Jones Transportations (DJT) jumped 1.2% and the NASDAQ, led by the FAANGs, was up 0.6%. The small cap indices fell with the S&P 400 (MID) down 0.9% and the S&P 600 (Small) off 1.3%. One of the strongest markets on the week was Bitcoin and the cryptos. Bitcoin jumped a strong 9.9% and is now up 28.0% on the year already. Is Bitcoin portending the stock markets to rise further as well? Bitcoin is definitely a risk on asset and its rise could be good overall for the stock market.
In Canada, the TSX Composite was up 0.7% while the TSX Venture Exchange (CDNX) gained 1.4%. In the EU, the London FTSE was off 0.9%, the Paris CAC 40 fell 0.4%, and the German DAX was down 0.4% as well. The EuroNext fell 0.7%. In Asia, China’s Shanghai Index (SSEC) rose 2.2% as the Chinese economy opened up from COVID lockdowns, the Tokyo Nikkei Dow (TKN) gained 1.7%, while the Hong Kong Hang Seng (HSI) up 1.5%. Asia up, EU down, North America mixed. The MSCI World Index gained about 0.4%.
The S&P 500 continues to lag the DJI. The DJI is firmly above the 200-day MA, while the S&P 500 is not. The DJT is just behind over the 200-day MA but not substantially. However, the DJT made what is known as the “golden cross” this past week as the 50-day MA crossed over the 100-day and 200-day MA. It joins the DJI as the only
other index to do so. Still, the DJT lags the DJI. The S&P 500 is behind and the NASDAQ is well behind. But if Bitcoin is a positive sign with a return to risk assets, that could benefit the stock market.
One of the drivers is the fact that there are signs of inflation abating. However, as we note under our bond commentary, there are signs the U.S. economy is slowing but the job market remains strong. Slowing inflation and a slowing economy has thoughts of the Fed easing up on its rate hikes. Many now expect the Fed to hike only 25 bp on February 1, not 50 bp. But as we have noted, some still believe the Fed’s goal is 5.5%, up from the current 4.5%. So that could imply a 50 bp hike at the February 1 FOMC.
The S&P 500 needs to break above 4,050 to suggest that we are headed higher. To the downside, a break under 3,850 could spell the end of this rebound. Indicators are still in a positive mode and there are no significant divergences appearing, except for the non-confirmation of the other indices with the DJI. Sentiment is currently neutral.
We could argue that the S&P 500 is still making a large head and shoulders bottom pattern. We need to break out over 4,050, preferably 4,100, on volume to confirm that we could be headed higher. Potential targets of an H&S pattern are up to 4,800/4,900 and the January 2022 top.
Source: www.stockcharts.com
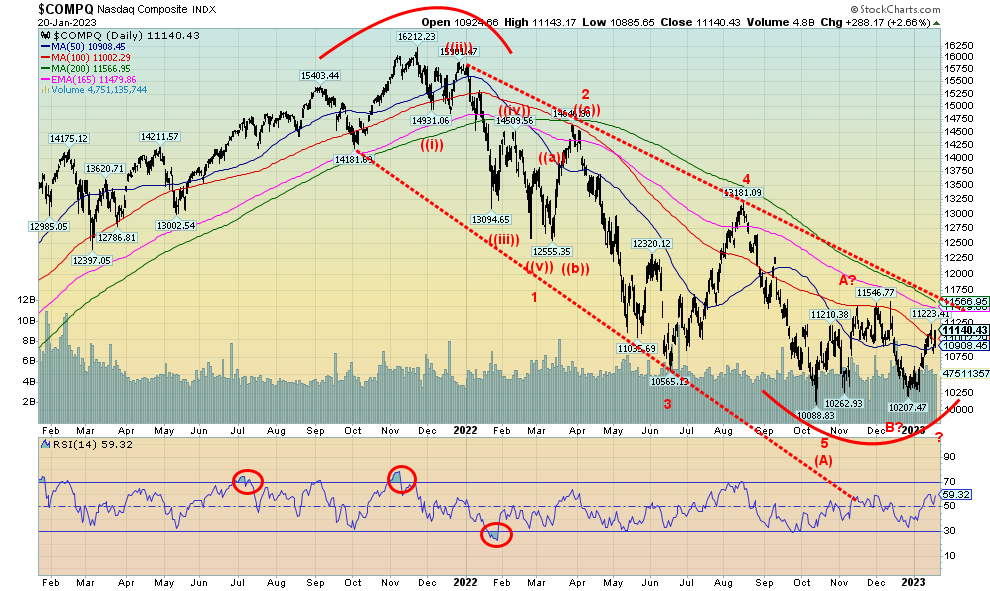
The NASDAQ managed to gain about 0.6% this past week as the FAANGs helped drag it higher. The NY FANG Index was up 2.7%. Leading the way on the FAANGs was Tesla with a gain of 9.0%. Google was up about 7.0%. Must be a positive reaction to the fact it’s about to embark on slashing roughly 12,000 jobs or 6% of its workforce. Firing people, it seems, is good for one’s stock price. The NASDAQ continues to lag the others. It remains below even the highs seen in October through early December. The NASDAQ needs to break over 11,500 to take those highs out. That also could take out that downtrend line near 11,570. The NASDAQ continues to make what looks like a bottom pattern, but we need confirmation of a breakout with a move above 11,500/11,550. And, of course, keep the lows intact. Under 10,750 is a concern.
Source: www.stockcharts.com
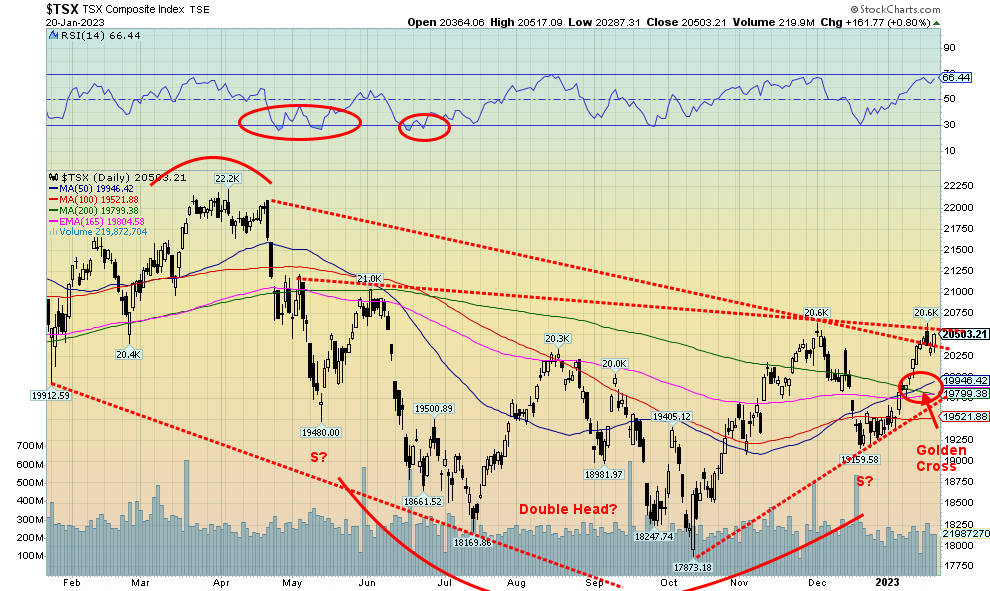
The TSX managed to rise once again, defying the drop seen earlier in the week. The TSX was up 0.7% on the week. The TSX Venture Exchange (CDNX) was one of the best in North America as it gained 1.4%. On a positive note, the TSX has moved and held above the 200-day MA and it has now made the “golden cross” where the 50-day MA crosses over the 100-day and 200-day MAs. That is confirmation of the October low at 17,873. The TSX has hit a resistance zone here around 20,600, but once firmly through that level we should be able to move higher towards the next resistance zone near 21,000.
Ten of the 14 sub-indices were up on the week led by Energy (TEN), up 2.6%, and followed by Information Technology (TKK), up 2.5%. Health Care (THC) was the only other one to gain over 2% with a gain of 2.1%. Golds (TGD) led the losers, off 1.0%, while other losers were Consumer Staples (TCS) -0.4%, Metals & Mining -0.3% and Industrials (TIN) -0.2%. All in all, it was a good week, but the TSX needs to break through the current resistance level to challenge the next one at 21,000. Volume is not overly impressive. Support can be seen down to 19,800.
Source: www.stockcharts.com
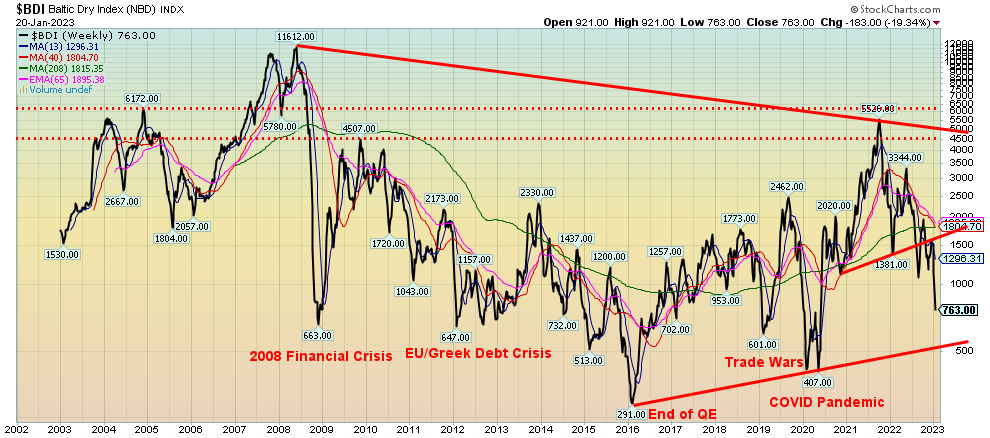
We thought we’d show the Baltic Dry Index (BDI) once again. We were surprised at the sharp drop this past week. The BDI is a measurement of moving major raw materials by sea. It is a sign of sinking economic activity. Lows are usually seen during the time of recessions, as we have labeled above.
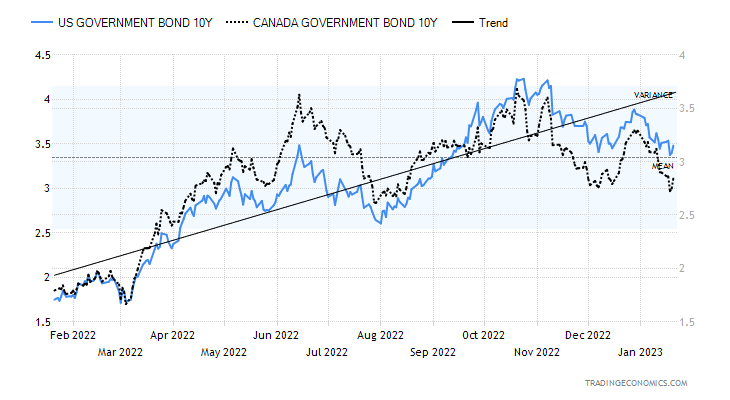
10-year Treasury Bond/Canadian 10-year Government Bond (CGB)
Source: www.tradingeconomics.com, www.home.treasury.gov, www.bankofcanada.ca
Once again, bond yields fell as we noted further signs that the U.S. economy is potentially slowing. It’s not yet showing up in the labour market as once again the weekly claims came in below expectations at 190,000 when they expected 214,000. But other numbers weakened. Building permits for December were down 1.6%, housing starts fell 1.4%, the Philly Fed manufacturing index registered negative 8.9, existing home sales dropped 1.5%, the NY Empire Manufacturing Index was negative 32.9 when they only expected a reading of negative 9, PPI fell 0.5% below the expected decline of 0.1%, and Industrial production fell 0.7% below the expected decline of 0.1%. The result was the U.S. 10-year treasury note dropped to 3.48% from 3.51%. The Canadian 10-year Government of Canada bond (CGB) fell to 2.85% from 2.9%. Even the spreads narrowed somewhat as the U.S. 2–10 spread dropped to negative 0.7% from negative 0.72% and the Canadian 2–10 spread was off to negative 0.75% from negative 0.78%.
This coming week on January 25 is the Bank of Canada (BofC) interest rate decision. The expectation has fallen a bit recently and now many expect only a 25 bp hike. But the BofC could still fool us and deliver 50 bp again. The Fed meets for its interest rate decision February 1. Again, at least 25 bp but it could be 50 bp. The Fed is going to at minimum 5% (current 4.5%), but some continue to say 5.5%. If it’s a 25 bp hike, then the goal is 5%. Watch the U.S. PCE Price Index out next Friday, January 27. The expectation is a 0.1% gain and 5.1% y-o-y.
Source: www.stockcharts.com
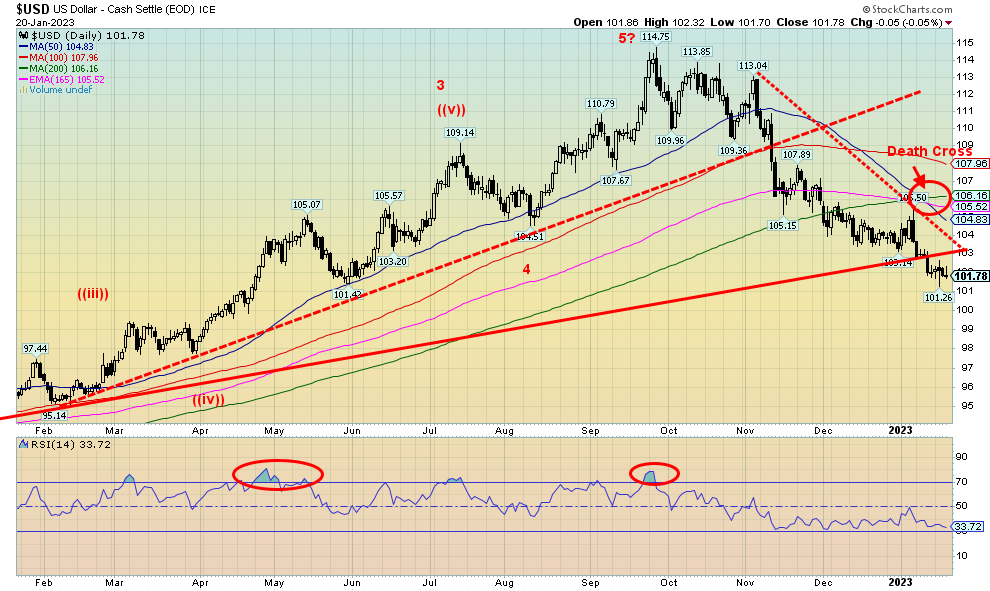
The US$ Index continues its downward trend. We now feel confident that a significant top is in place for the US$ Index seen at 114.75 in September 2022. Wave counts suggest that we may have completed a five-wave down pattern, but it’s not 100% clear. We are not yet at oversold levels. We have broken our key trend line at 103. Targets could easily be down to 100 and even 99 before a rebound develops. The US$ Index, we believe, is falling, especially over the past week, with concerns about the looming debt limit crisis. This would signal some loss of confidence in the currency. As well, with China and Saudi Arabia possibly collaborating on oil for yuan the period of the petrodollar may be coming to a close. If history is correct, the U.S. will do what they have to do to protect the U.S. dollar’s reserve currency status. But, as we have noted before, history is replete with the fall of reserve currencies and they take place against the backdrop of global war.
This past week the US$ Index fell only 0.2%, but it was enough to move it to fresh lows for the current move. The euro gained 0.2%, the Swiss franc was up 0.6%, and the pound sterling jumped 1.4%, but the Japanese yen lost 1.3%. The Canadian dollar was essentially flat on the week.
Note, as well, that the US$ Index has made what is known as the “death cross” where the 50-day MA falls below the 100-day and 200-day MAs. The “death cross” is, as is its bull opposite the “golden cross”, a lagging indicator and a confirmation here of the downtrend. Resistance is up to 103, then up to 104. We’d have to break up through 105.50 to confirm that the downtrend was over.
Source: www.stockcharts.com
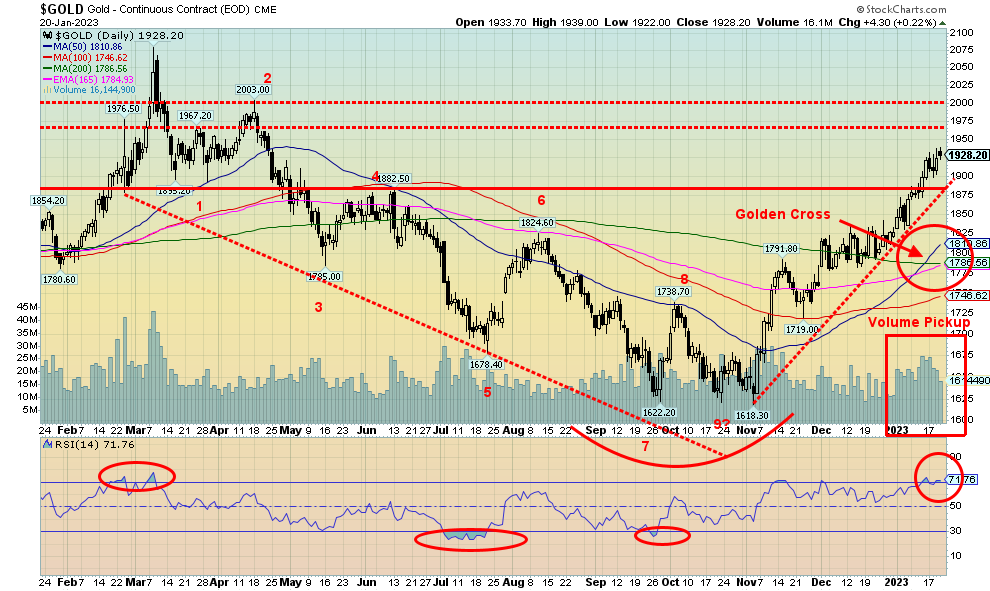
Gold enjoyed another up week, the fifth consecutive up week and up for the ninth time in the past 13 weeks, gaining this time 0.3%. Hopes for a slowing of Fed rate hikes are helping. It was enough to take gold to fresh highs on the current up move. However, the gain for gold didn’t translate well elsewhere as silver refused again to confirm gold’s up move, losing 1.8%. Platinum went down as well, off 2.3%. Of the near precious metals, palladium continued its recent losing ways, off 3.6%; however, copper (a leading indicator) jumped again, up 0.9%. The gold stocks were off small as the Gold Bugs Index (HUI) lost 0.5% and the TSX Gold Index (TGD) dropped 1.1%.
Gold jumped through its $1,875/$1,900 resistance on increased volume, a positive sign. The next hurdle is $1,950/$1,960, but once over $1,975, $2,000 should be next. A move back above $1,975 would start to suggest that the all-time high of $2,089 could be in sight. But let’s get over $2,000 first.
We wonder if gold is responding positively to the looming debt limit crisis in the U.S. The US$ Index has also broken down and that is helping gold as well. The escalating war in Ukraine, where the U.S./NATO are arming Ukraine, has brought some analysts to declare that we are already in World War III as the U.S./NATO fights a proxy war against Russia.
As we have noted before, during the last debt limit crisis in 2011 gold rose to record levels at $1,921. We are now through $1,921, so it is important we hold that level down to $1,900. We consider gold is in trouble if it breaks under $1,825. There are cautionary signs. We note that silver has failed to confirm gold’s move to new
highs. The Daily Sentiment Indicator (DSI) is at 92% which is the highest extreme it’s been at since March 2022 gold’s last key top. There are some divergences with indicators; however, those divergences can remain in place for some time as can overbought conditions in a strong market. Elliott Wave International (www.elliottwave.com) is also calling for a top in gold, believing it has completed a five-wave up pattern. We see three so we don’t believe we have completed this up move yet.
Gold boards and gold analysts are all universally bullish, although we have noted some analysts are issuing cautionary notes after the recent strong up move. Gold is up $300 or 19% from that early November low at $1,618.
Gold is through a key hurdle at $1,900/$1,920, but it now needs to hold that level down to $1,875. The next and final hurdle may be the hardest. Note as well that gold has made the “golden cross” as the 50-day MA has crossed above the 100 and 200-day MAs. The “golden cross” and its bear equivalent the “death cross” are lagging indicators and act more as confirmation to the uptrend.
Source: www.stockcharts.com
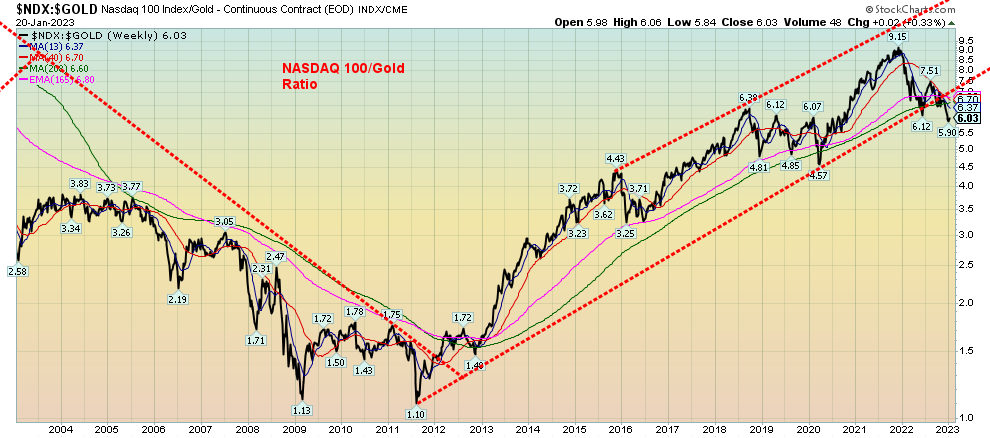
The NASDAQ 100/Gold ratio has broken its uptrend line. The NASDAQ 100/Gold ratio indicates how many ounces of gold would it take to buy the NASDAQ 100. The index peaked in 2000 at 15.9. The low for the ratio was seen in November 1987 at 0.28. The ratio is currently at 6.03 down from its recent high of 9.15.
We emphasize, however, that this is the only one of major indices where the ratio has broken its uptrend line. None of either the DJI, DJT, S&P 500, NASDAQ or the TSX has broken a comparable uptrend. Is the NASDAQ 100 leading? That can only be confirmed by the others also breaking their uptrend line. Still, we thought this worth noting.
Source: www.cotpricecharts.com
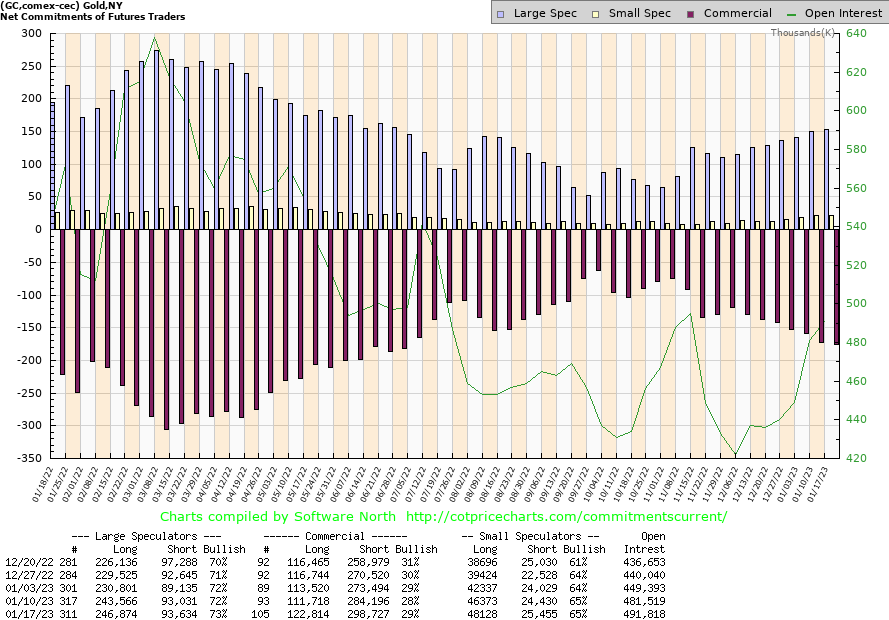
The gold commercial COT (bullion companies and banks) improved this past week to 29% from 28%. Total open interest rose as well on an up week for gold. Long open interest jumped roughly 11,000 contracts but short open interest was also up jumping 14,000 contracts. Despite the bigger jump in shorts, it actually moved the needle higher for the percentage. The large speculators COT (hedge funds, managed futures, etc.) rose to 73% from 72% as they added over 3,000 longs while shorts were quite steady. The gold COT is positive but has weakened over the past several weeks.
Source: www.stockcharts.com
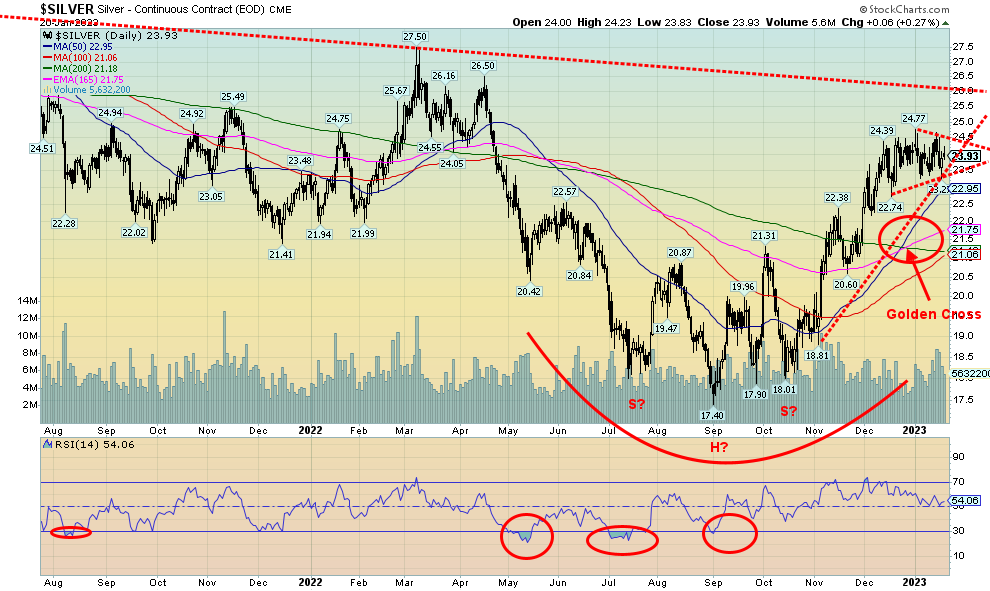
Despite gold moving higher this past week, silver did not, falling 1.8%. Gold also made new highs for the current up move while silver did not. These divergences continue to concern us and, until silver makes new highs to confirm gold and shows leadership once again, we maintain a note of caution on the precious metals. On a positive note, silver appears to be making a pennant formation that should break to the upside. We say “should” because sometimes these consolidation patterns work both ways. It could be a continuation pattern, meaning that it should break in the direction of the main trend which is up. But it can sometimes be a topping pattern and, instead, silver breaks to the downside. A look at the weekly chart of silver also gives rise to some ambiguity. Since peaking back in February 2021 at $30.35, silver has been in a downward sloping channel. The question is, which way will it break? On the pennant, another move above $24 could get things moving higher; however, a break under $23.25 could prove fatal and see a downward move getting underway. A firm breakdown under $23 would confirm a top. On the weekly chart (not shown), a break above $25 could start a stronger move to the upside, although we’d feel more confident if we broke above $26. A move above $27.25 would suggest to us that new highs above $30.35 lie ahead. Ambiguity will continue until we make a break one way or the other. On a positive note, silver has also made the “golden cross” to the upside confirming the emerging uptrend.
Source: www.cotpricecharts.com
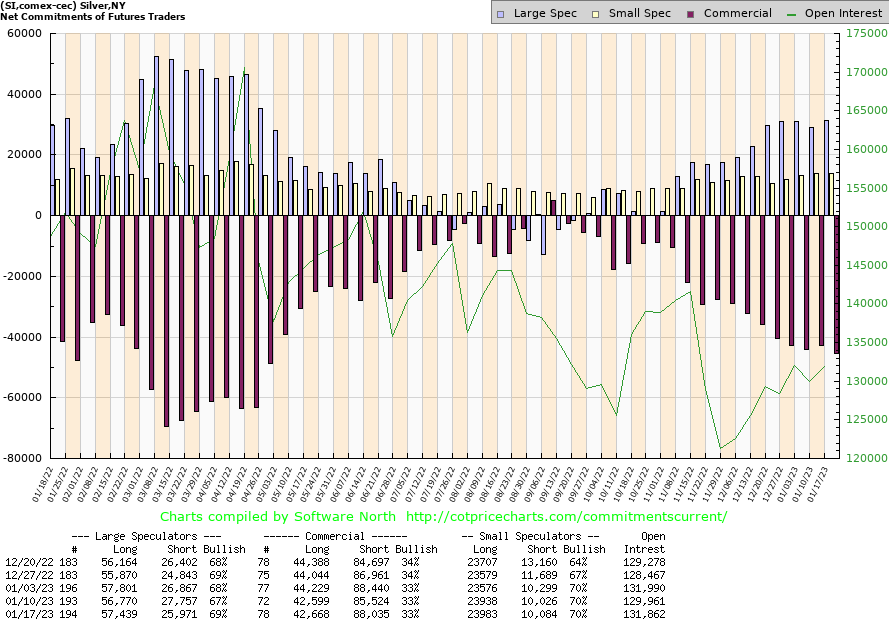
The silver commercial COT was little changed this past week, remaining at 33%. Longs were steady but short open interest jumped about 2,500 contracts. The large speculators COT rose to 69% as they added less than 1,000 longs but cut roughly 2,000 shorts. Overall, the silver COT remains positive but is not showing any increased bullishness.
Source: www.stockcharts.com
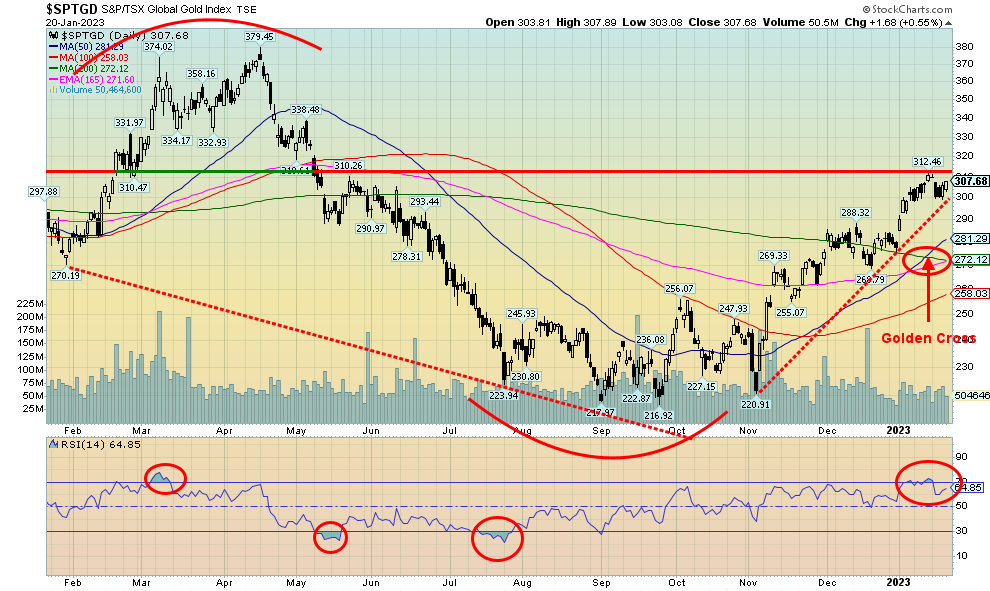
Despite gold putting in a positive week, it was not quite enough to drag the gold stocks to another weekly gain. The TSX Gold Index (TGD) fell 1.1% while the Gold Bugs Index (HUI) lost 0.5%. Still, that left the TGD up 39% since that early November low. The TGD has been testing a zone of resistance at 310/312. Once firmly through 312, we should move to the next resistance level up around 338/340. We remain down some 19% from the March 2022 high. The TGD is making the “golden cross” where the 50-day MA crosses up through the 100 and now the 200-day MA. A positive development. We view the indicator as a confirmation of the uptrend. But it does strengthen the buy signal and it can bring in new players who see the gold stocks as viable investments. Support is now seen at 300 and then down to 270/275. We’d view a breakdown under 270 negatively. But overall, the chart on the TGD looks positive and numerous gold stocks have picked up steam. Some like Dundee Precious Metals (DPM/TSX) even made fresh 52-week highs this past week. Sentiment is still not super-bullish as the Gold Miners Bullish Percent Index (BPGDM) is at 55%, well below levels over 80% that would signal that bullishness was becoming extreme.
Source: www.stockcharts.com
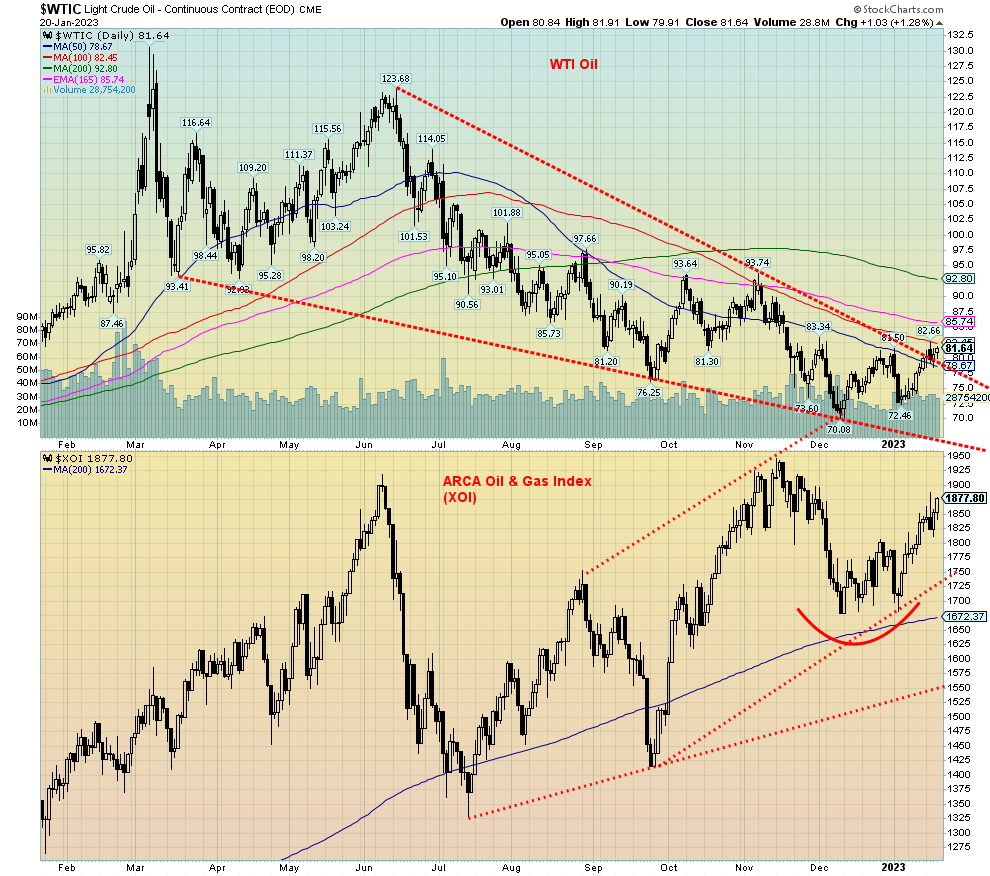
China reopening is good for oil. Both the IEA and OPEC have raised their demand targets. Yes, there was a larger-than-expected oil build in the U.S. this past week, but the market appeared to brush it off. U.S. inventories are at their highest levels since March 2022. And despite forecasts of a slowing U.S. and global economy and U.S. refinery problems, the forecasters see Asia as the driver to push prices higher. The IEA forecast has global demand pushing past 100 million bpd which would be a record. There are even calls for more investment so that increased demand can be met.
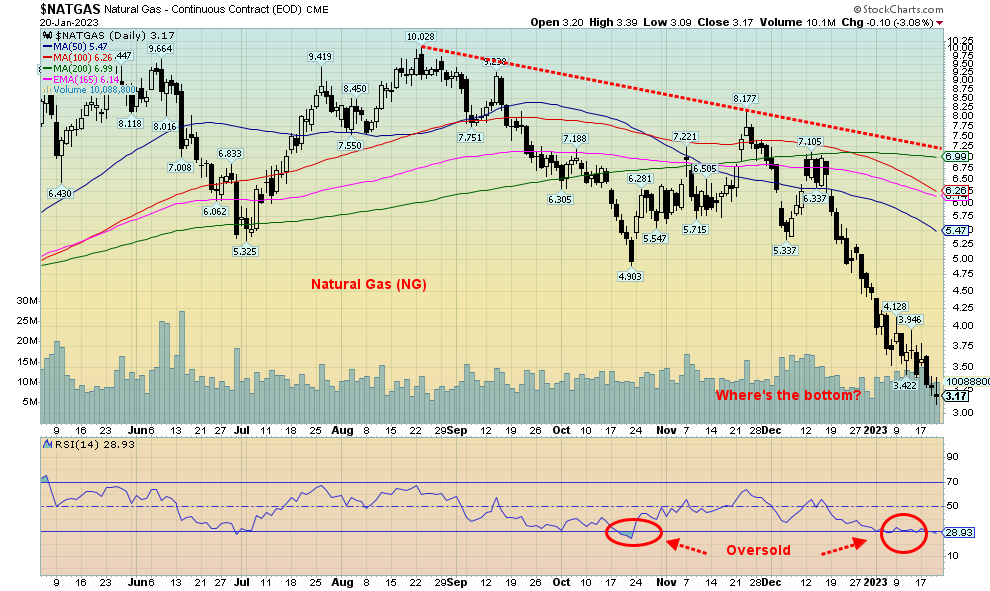
Technically, oil prices appeared to wiggle through what we thought might be a descending wedge triangle. Our preference is that we thrust upward through them, not wiggle through them. The thrust took WTI oil to the 100-day MA but not through it. Last week, WTI oil rose 2.2% while Brent was up 1.1%. Natural gas (NG) was whacked again, falling 7.3% to fresh 52-week lows. The energy indices did well with ARCA Oil & Gas Index (XOI) up 2.0% and Canada’s TSX Energy Index (TEN) gaining 2.6%. Both are now starting to approach the old highs seen in November 2022.
With our wedge pattern now somewhat suspect, we’ll have to await a firm breakout above $93/$94 to suggest higher prices. But momentum appears to have shifted and further gains should be seen. The energy stocks may be leading the way. A breakdown under $72 would be quite negative. There appears to be good support in the $70–$75 range.
Natural gas (NG) has been a disaster zone. The collapse since November/December has been vicious. Warm weather and too much supply have been the culprits. NG may be deeply oversold, but it can remain that way longer than longs can stay solvent. Speaking of longs, when one sees big swift drops like these, thoughts turn to what large fund or firm could be caught offside. In previous collapses, someone it seems always gets caught with losses in the millions of dollars. An announcement of a blow-up could be the antidote for what ails the market. Often it brings us our bottom. But right now, stepping into the NG market is for serious speculators only.
Source: www.stockcharts.com
The energy market is entering its positive seasonal period, so the seasonals alone might help drag this market higher and even save the NG market. Cold weather would also help the NG market. But Europe is too balmy and all the panic over the lack of Russian supply has abated.
Copyright David Chapman, 2023
|
GLOSSARY Trends Daily – Short-term trend (For swing traders) Weekly – Intermediate-term trend (For long-term trend followers) Monthly – Long-term secular trend (For long-term trend followers) Up – The trend is up. Down – The trend is down Neutral – Indicators are mostly neutral. A trend change might be in the offing. Weak – The trend is still up or down but it is weakening. It is also a sign that the trend might change. Topping – Indicators are suggesting that while the trend remains up there are considerable signs that suggest that the market is topping. Bottoming – Indicators are suggesting that while the trend is down there are considerable signs that suggest that the market is bottoming.
|
David Chapman is not a registered advisory service and is not an exempt market dealer (EMD) nor a licensed financial advisor. He does not and cannot give individualised market advice. David Chapman has worked in the financial industry for over 40 years including large financial corporations, banks, and investment dealers. The information in this newsletter is intended only for informational and educational purposes. It should not be construed as an offer, a solicitation of an offer or sale of any security. Every effort is made to provide accurate and complete information. However, we cannot guarantee that there will be no errors. We make no claims, promises or guarantees about the accuracy, completeness, or adequacy of the contents of this commentary and expressly disclaim liability for errors and omissions in the contents of this commentary. David Chapman will always use his best efforts to ensure the accuracy and timeliness of all information. The reader assumes all risk when trading in securities and David Chapman advises consulting a licensed professional financial advisor or portfolio manager such as Enriched Investing Incorporated before proceeding with any trade or idea presented in this newsletter. David Chapman may own shares in companies mentioned in this newsletter. Before making an investment, prospective investors should review each security’s offering documents which summarize the objectives, fees, expenses and associated risks. David Chapman shares his ideas and opinions for informational and educational purposes only and expects the reader to perform due diligence before considering a position in any security. That includes consulting with your own licensed professional financial advisor such as Enriched Investing Incorporated. Performance is not guaranteed, values change frequently, and past performance may not be repeated.
About the author


Website: https://www.enrichedinvesting.com
Disclaimer: David Chapman is not a registered advisory service and is not an exempt market dealer (EMD) nor a licensed financial advisor. We do not and cannot give individualised market advice. David Chapman has worked in the financial industry for over 40 years including large financial corporations, banks, and investment dealers. The information in this newsletter is intended only for informational and educational purposes. It should not be considered a solicitation of an offer or sale of any security. The reader assumes all risk when trading in securities and David Chapman advises consulting a licensed professional financial advisor before proceeding with any trade or idea presented in this newsletter. David Chapman may own shares in companies mentioned in this newsletter. We share our ideas and opinions for informational and educational purposes only and expect the reader to perform due diligence before considering a position in any security. That includes consulting with your own licensed professional financial advisor.