
—Archibald MacLeish, American poet and writer, associated with the modernist school of poetry, 1st Assistant Secretary of State for Public Affairs 1944–1945, 9th Librarian of Congress 1939–1944; 1892–1982
“Securities pricing is, in every sense a psychological phenomenon that arises from the interaction of human beings with fear. Why not greed and fear as the equation is usually stated? Because greed is simply fear of not having enough.”
—John Bollinger, American author, financial analyst, technical analyst, developer of Bollinger Bands, book Bollinger on Bollinger Bands 2001, publisher of the Capital Growth Letter since 1987; b: 1950
“In Wall Street, the man who does not change his mind will have no change to mind.”
—William D. Gann, legendary finance trader, technical analyst, developed Gann Angles and Master Charts featuring the Spiral Chart, the Hexagon Chart, and the Circle of 360, author, forecasting methods based on geometry, astronomy, astrology, and ancient mathematics; 1878–1955
Is the glass half full or half empty? In looking at returns in the markets over the years, the argument could easily be that it’s actually pretty full. If you go back to 1970, stock markets have given investors pretty good returns. The NASDAQ, for example, is up 10,258% in that time. A huge winner. But if one looks only at this year’s return, an investor is down 31%. An interesting one to look at from 1970 is gold, as one can actually buy physical gold. Yes, you can buy index funds, but back in 1970 there were no index funds. The first one that we are aware of came out in 1976. Instead, you bought individual stocks. Gold has returned 4,620% since 1970. Silver? Only 920%. The S&P 500 slightly less, 3,940% and the Dow Jones Industrials (DJI) 3,714%. But in 2022 gold is down 9%, the S&P 500 is off 22% and the DJI down 16%. The investor that held on from 1970 might consider the glass at least half full. But one who just got into the market at the outset of 2022 might consider the glass half empty.
Since 1900 there have been 37 corrections/bear markets and 38 bull markets (Dow Jones industrials (DJI) Source: www.stocktradersalmanac.com). The 38th bear market is in progress. Of those 37 corrections/bear markets, 22 or 59% of them have fallen 25% or more. The average correction/bear market lasts about 400 days vs. bull markets lasting almost 800 days. On average, correction/bear markets fall 30.8% while bull markets gain 85.9%. But for bear markets falling 25% or more, the average loss rises to 38.3% and the average duration is about 475 days. The range – losses of 25.2% (1966) to 86% (1930–1932) lasting from 40 days (the pandemic crash) to 959 days (the War bear market September 1939 to April 1942). Again, using the DJI as the measure, the DJI has fallen, so far, at its recent low 22.4% and has lasted 289 days. To reach the averages, the DJI could fall another 16% and last at least another six months. There is little sign so far that couldn’t happen.
Yes, bear market rallies will occur. Since the current bear got underway in early January 2022, there have been four rebound rallies. We may be working on the fifth rebound. The best one so far was the June/August rally that saw the DJI gain 15.5%. Only one other hit 10%, which was the February/April upswing. The 2007–2009 financial crisis bear market saw only five rebounds of any significance. Two of them were rebounds of 20% or more. And those rebounds came during the volatile period of September 2008 to March 2009. But the rallies didn’t last and the DJI fell to new lows, making its final low in March 2009. There were a lot of choppy rebounds during the 1973–1974 bear market, but only one had any legs and that was for a gain of only about 18%. That bear was a relentless downtrend.
Since the huge outside reversal day seen on October 13, 2022, the DJI has gained roughly 7%. Potential targets could be up to the 200-day MA, currently at 32,775, a gain of another 7%. Many believe the October 13 outside day reversal was key and the market has bottomed for good. It’s highly unlikely. The conditions are not there yet. Despite the U.S. reporting two consecutive quarters of negative GDP growth, there has been no announcement of an official recession. Year-over-year, the U.S. is still posting positive gains. What is consistent is the beat of the central banks that further interest rate hikes are on the table to bring down the rate of inflation. It is widely expected that the BofC will hike at least 50 bp at its October 26 meeting. The Fed is also expected to hike at least 50 bp at its November 1–2 FOMC. Our table below shows the huge negative differential between the official rate of inflation for the G7 countries + 2 and the central bank rate (CBR) and the 10-year treasury. The table encompasses the nine largest economies by GDP in the world.
G7 + 2 Inflation Rates and spread differentials
|
Country |
Inflation |
Central Bank Rate (CBR) |
10 Yr. Treasury |
CBR-Inflation |
10 Yr.-Inflation |
GDP Annual Growth Rate Q2 |
|
|
|
|
|
|
|
|
|
US |
8.20% |
3.25% |
4.15% |
-4.95% |
-4.05% |
1.8% |
|
Canada |
6.90% |
3.25% |
4.73% |
-3.65% |
-2.17% |
2.9% |
|
UK |
10.10% |
2.25% |
3.81% |
-7.85% |
-6.29% |
4.4% |
|
Germany |
10.00% |
1.25% |
2.40% |
-8.75% |
-7.60% |
1.7% |
|
France |
5.60% |
1.25% |
2.96% |
-4.35% |
-2.64% |
4.2% |
|
Italy |
8.90% |
1.25% |
4.73% |
-7.65% |
-4.17% |
1.8% |
|
Japan |
3.00% |
-0.01% |
0.25% |
-3.01% |
-2.75% |
1.6% |
|
|
|
|
|
|
|
|
|
China |
2.80% |
3.65% |
2.74% |
0.85% |
-0.06% |
0.1% |
|
India |
7.40% |
5.90% |
7.48% |
-1.50% |
0.08% |
13.5% |
Source: www.tradingeconomics.com
The spread differential between the official rate of inflation, the CBR, and 10-year treasury is problematic. We are reminded that, to bring down the high rate of inflation in the U.S. in the 1970s, Paul Volcker, the Chair of the Federal Reserve, hiked the key Fed rate above the rate of inflation and sparked a steep recession that didn’t end until the mid-1980s. Yes, there are signs that the inflation rate could be moderating, but we are reminded that the inflation of the 1970s was two-pronged. The CPI rose from 2.95% in July 1972 to 12.2% in November 1974, then fell to 5.04% by December 1976. A major contributor to bringing inflation down was the recession of 1973–1974. Then inflation rose again to 14.6% by March 1980. In response, the Fed hiked the Fed rate to 19%-20% in 1980. The 10-year U.S. treasury note shot up to 15.4% by August 1981. Both were above the rate of inflation.
It is no surprise that one of the prime reasons for the 1970s inflation was the sudden rise in energy prices sparked by the OPEC oil embargo of 1973. The result was that prices spiked and shortages rose. There was also a boom in agriculture commodities that contributed to inflation. The first energy crisis eased, but a secondary energy crisis exploded at the end of the decade with the Iranian revolution.
In many respects, today’s inflation is even more difficult. The Russia/Ukraine war was a big catalyst. WTI oil rose from $62.43 in December 2021 to $92.80 on February 24, 2022, the day the invasion commenced, and then hit a peak of $130.50 in early March 2022. While it has since subsided, the current price still hovers around $85. OPEC has added to the woes with their 2 million bpd cut. While some of that might be offset by slowing economies and the U.S. releasing millions of barrels from its strategic reserves, the economies have thus far been surprisingly resilient as demand remains strong despite the high cost. According to forecasts from the IMF, it is highly expected that the eurozone, the U.K., Japan, South Korea, Australia, Canada, and the U.S. will all fall into official recessions by 2023.
Russia cut off oil and gas supplies, primarily to Europe. This has presented numerous dislocations. Energy prices have hit all-time highs in the EU and UK. The resulting energy crunch has caused corporate bailouts in Germany and household bailouts in the UK. But the war in Ukraine goes beyond an energy crunch. It has also sparked a food supply crunch. Russia and the Ukraine supplied 10% of the world’s calories. Numerous countries received at least half their food needs from Russia/Ukraine. Together, they exported at least a third of the world’s grain and barley and 70% of the world’s sunflower oil. They are also major suppliers of corn.
Another major contributor to inflation has been supply-chain disruptions and negative fallout from climate change or, should we say, severe weather. Supply-chain disruptions started under the pandemic and have deepened, even if they are constantly changing. Sanctions are another disruption that has sparked supply shortages. The result has seen a contraction in world trade, slowing globalization, supply instability, price inflation, logistical disruptions, and growing labour discontent. Severe weather has sparked major flooding and severe droughts, both of which have contributed to rising food prices. When one-third of Pakistan is flooded or the horn of Africa falls into a severe drought, the inflationary effects on food are felt in the grocery stores of North America. With the strong rise in the U.S. dollar, which actually helps mitigate inflation in the U.S., the resultant downward pressure on a host of currencies results in those countries importing at sharply higher prices, given that commodities are priced in U.S. dollars.
In that respect, Japan has been particularly hard hit. The Japanese yen has fallen almost 32% since a high in January 2021. Japan imports some 78% of its oil, over 90% of its natural gas (NG), and 60% of its food based on calories consumed. Yet inflation at 3% is the lowest in the G7. The Bank of Japan (BOJ) has continued with its quantitative easing (QE) programs. Japan also has the lowest interest rates in the G7, even as the 10-year Japanese Government Bond (JGBs) has gone from negative 0.28% in September 2019 to +0.25% today. No surprise, however, that gold priced in Japanese yen is up almost 16% during the same time that the yen has collapsed. Our chart below shows the Japanese yen, JGBs, and gold in yen since 2017.
Despite all of this, no G7 economy has officially fallen into a recession. All reported positive year-over-year GDP growth in Q2. Japan was the lowest at 1.6%. Economic numbers being released in the U.S. are still robust, despite some slipping lower. This should keep the pressure on the central banks to continue to hike interest rates to combat inflation. Irrespective of this, with sharply rising interest rates problems are growing, particularly in the housing market and many households, especially those with high consumer debt, are feeling the pinch.
The Sinking Japanese Yen 2017–2022
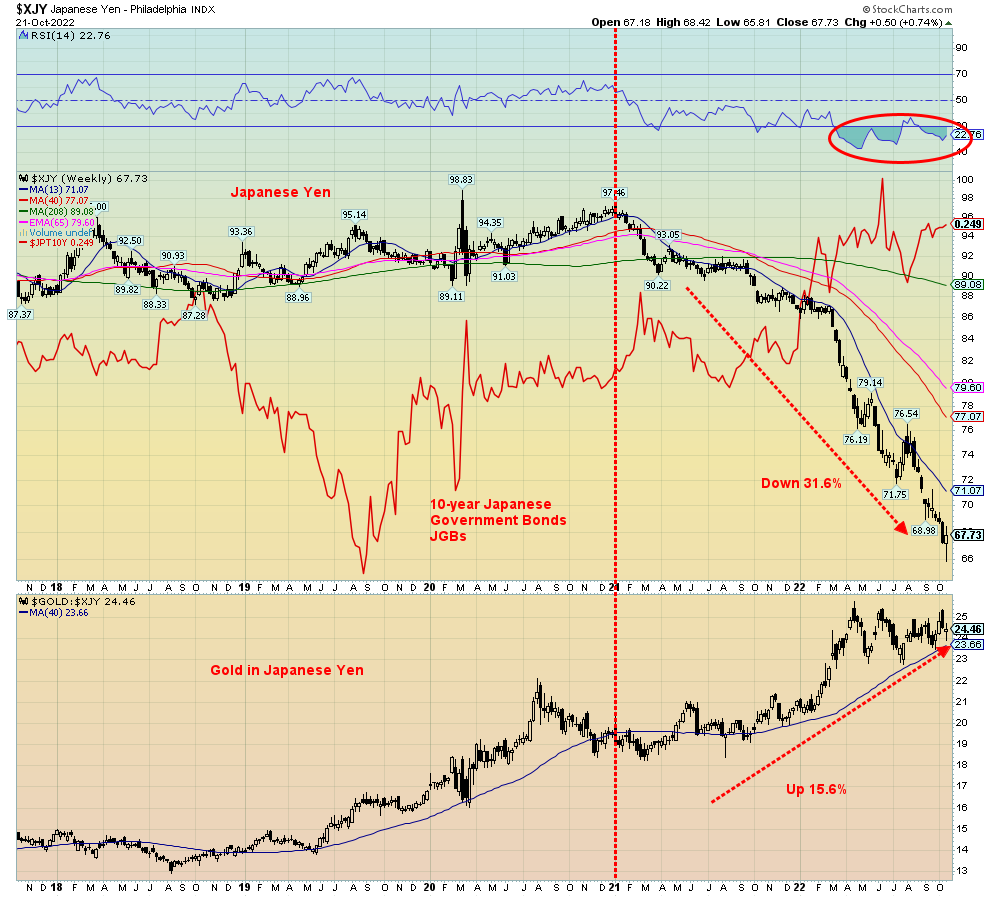
Source: www.stockcharts.com
With high inflation and slowing economies, thoughts turn to stagflation. As we outlined in the previous Scoop October 17, 2022, the Kondratiev Wave Cycle appears to pinpoint these periods with considerable precision. Our chart of the previous week showed inflationary/stagflationary periods constituting the summer of the Kondratiev Wave. The long Kondratiev wave lasts roughly 50–60 years. By our calculation, the last long Kondratiev wave was 1949–2009, a period of 60 years. The first period, the Kondratiev spring, ended by our
calculation with the stock market top in early January 2002. We measure each complete wave from trough to trough in the stock market. Interim periods we measure from stock market trough to stock market peak or peak to trough. We believe we have entered the summer of the Kondratiev Wave, a period defined by inflation, stagflation, weak economic growth, weak stock markets, and rising commodity markets, including gold. Since the onset of the Kondratiev Wave dating back to the American revolution, we believe we are in the fifth wave, although some say the sixth wave. The chart below from the Corporate Finance Institute (www.corporatefinanceinstitute.com) suggests we are in the sixth wave. 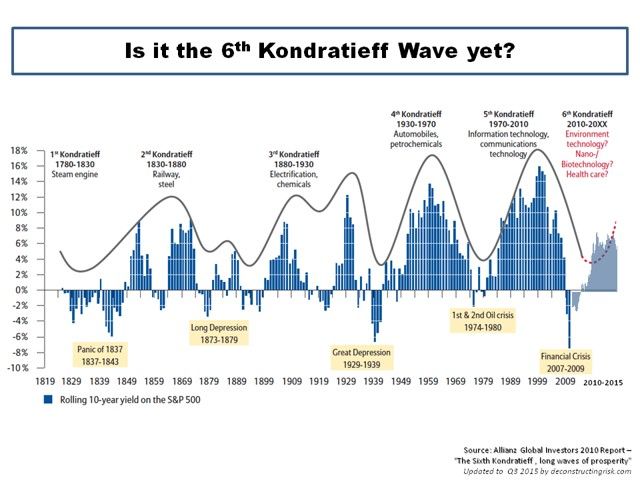
Source: www.corporatefinanceinstitute.com
Regardless of the differences in interpretation, we both appear to agree that we have embarked on a new Kondratiev wave. The panic of 1837, 1837–1843 fits well with the winter of the first Kondratiev wave 1784–1844. The Long Depression 1873–1879 is a part of the winter of the second Kondratiev wave 1845–1896. The Great Depression 1929–1939 is a part of the winter of our third Kondratiev wave 1896–1949. The first and second oil crises noted above are a part of the summer of the fourth Kondratiev wave. Finally, the financial crisis of 2007–2009 occurred in the winter of the Kondratiev wave 1949–2009.
The differences are as follows:
Corporate Finance Institute Long Wave Group
|
Wave 1 |
1780–1830 |
1784–1844 |
|
Wave 2 |
1830–1880 |
1844–1896 |
|
Wave 3 |
1880–1930 |
1896–1949 |
|
Wave 4 |
1930–1970 |
1949–2009 |
|
Wave 5 |
1970–2010 |
2009–??? |
|
Wave 6 |
2010–??? |
|
Source: www.corporatefinanceinstitute.com, www.longwavegroup.com
All previous summers of the Kondratiev wave cycle have shared similar characteristics. If we are correct that we are in the summer of the cycle, we should see continued inflation/stagflation, weak economies, weak stock markets, rising commodity prices, and rising gold prices. Some of these are not currently being seen, but none of that suggests that they won’t. Being armed with a bit of knowledge of how things might unfold going forward will help one in planning on how to deal with the coming difficult period.
Chart of the Week
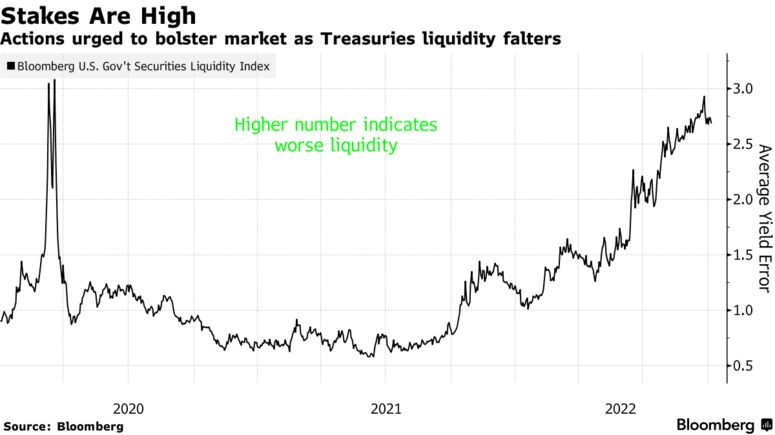
Source: www.bloomberg.com
Something we have constantly been concerned about ever since the bond sell-off got underway in 2020 is that there will be a bond market blow-up at some point. Tellingly, the U.S. 10-year treasury note has gone from 0.52% in August 2020 to 4.25% today. That is quite a move.
Turning it the other way, the price (yields move inversely to price) of the U.S. 10-year treasury note has fallen from a high of 140.36 to a low of 109.48, a decline of 22%. The 30-year U.S. treasury bond is down 35% in price from its high. For the record, the 5-year has fallen 16% and the 2-year 8%. Yes, there have been bond crashes in the past, most notably in 1994 and 2000, but the current crash is more reminiscent of the bond crash of the late 1970s. A major low for the 30-year bond was seen in October 1981. At the time it was the lowest price, highest yield seen for bonds in the entire history of the U.S. dating back to 1776. Conversely, the lows in yield, highs in price seen in 2020 was the lowest yield ever recorded.
The question is, will we see a bond crash or a major liquidity crisis? As our chart below of the 30-year U.S. treasury bond shows, the 30-year has broken down under a 34-year up-trend line. It appears to be currently at the uptrend line from 1981. The long bull market for bonds appears to be over. We have entered a potential long-term bond bear market. The losses on bond portfolios in pension funds, mutual funds, and more have yet to be measured, even as most will just hold the bonds to maturity. But what if they are forced to sell?
What the chart (Stakes Are High) seems to be indicating is that a potential major liquidity crisis is looming for the bond market. With yields in a constant state of rising (prices falling), the institutions (commercial banks, dealers, foreign governments, life insurance companies, etc.) that provide liquidity are backing off. Even foreign buyers have eased off as major foreign holders of U.S. treasury securities are down $70 billion in the past year. Traditional market makers are not making markets or the spreads are widening. It is noteworthy that banks, for example, have to set aside capital on their bond trading activity. Making things worse is that the Fed is trying to cut its own bond portfolio through quantitative tightening (QT). They are doing this at a rate of $60 billion/month. The next bid is lower than the previous bid.
All these troubles are sparking talk of the Fed switching gears and easing off on its QT. That was one of the prime reasons for Friday’s sharp reversal rally. No word as to when they would actually start QE again. After all, a major liquidity crisis in the bond market, particularly the U.S. treasury market—the biggest and most liquid treasury market in the world—would not be in anyone’s interest. One only has to look at the mess in the U.K. with the meltdown in the U.K. gilt market (and pound sterling). The BOE was forced to try and tighten by raising interest rates in the face of the U.K.’s 10%+ inflation on one hand and also deal with a bond (and currency) market meltdown with the other—a mess that resulted in the Prime Minster, Liz Truss, resigning (the shortest reign for any PM in U.K. history). The BOE was tightening and loosening at the same time. But could the mess in the U.K. spread? In a word, could there be contagion?
We are only four years into the current bond market’s 18-year cycle. The last 18-year cycle low was 2018, so the next one isn’t due until around 2036 +/- 3 years. The top in 2020 appears now to be the crest of the current 18-year cycle. The 18-year cycle breaks down normally into three 6-year cycles and the 6-year in turn breaks down into either two 3-year cycles or three 2-year cycles. We are now at the stretch point for the 3-year cycle to have bottomed, given we are now four years from the 2018 low. The only hope now is that the uptrend line from 1981 holds and a rebound rally develops. Either that or an even bigger bond crisis is looming. That in turn could force the Fed’s hand to prevent a major collapse. A disturbing scenario.
U.S. 30-year treasury bond 1978–2022
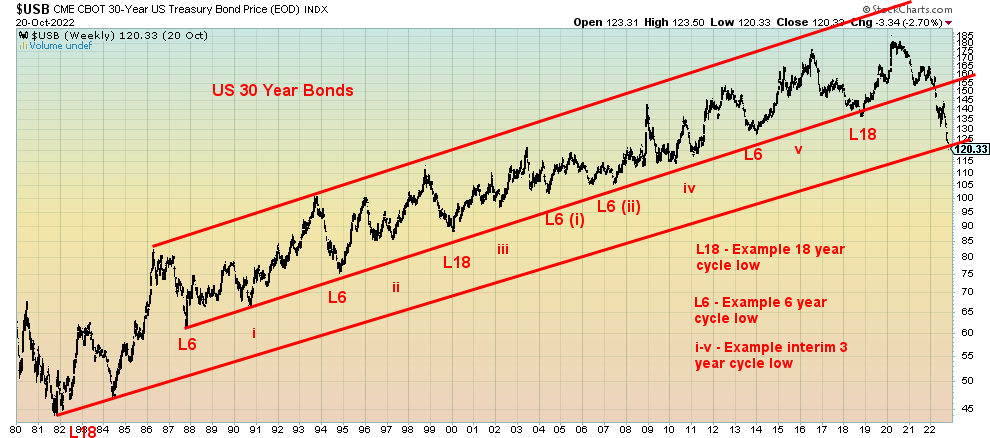
Source: www.stockcharts.com
Markets & Trends
|
|
|
|
% Gains (Losses) Trends
|
|
||||
|
|
Close Dec 31/21 |
Close Oct 21/22 |
Week |
YTD |
Daily (Short Term) |
Weekly (Intermediate) |
Monthly (Long Term) |
|
|
Stock Market Indices |
|
|
|
|
|
|
|
|
|
`S&P 500 |
4,766.18 |
3,752.75 |
4.7% |
(21.3)% |
down (weak) |
down |
neutral |
|
|
Dow Jones Industrials |
36,333.30 |
31,082.56 |
4.9% |
(14.5)% |
neutral |
down |
neutral |
|
|
Dow Jones Transport |
16,478.26 |
12,692.75 |
1.5% |
(23.0)% |
down (weak) |
down |
neutral |
|
|
NASDAQ |
15,644.97 |
10,859.72 |
5.2% |
(30.6)% |
down |
down |
down (weak) |
|
|
S&P/TSX Composite |
21,222.84 |
18,860.95 |
2.9% |
(11.1)% |
down (weak) |
down |
neutral |
|
|
S&P/TSX Venture (CDNX) |
939.18 |
593.09 |
2.1% |
(36.9)% |
down |
down |
down |
|
|
S&P 600 |
1,401.71 |
1,127.54 |
3.3% |
(19.6)% |
down (weak) |
down |
neutral |
|
|
MSCI World Index |
2,354.17 |
1,733.94 |
2.7% |
(26.4)% |
down |
down |
down |
|
|
Bitcoin |
47,907.71 |
19,008.30 |
(2.3)% |
(60.3)% |
down |
down |
down |
|
|
|
|
|
|
|
|
|
|
|
|
Gold Mining Stock Indices |
|
|
|
|
|
|
|
|
|
Gold Bugs Index (HUI) |
258.87 |
196.14 |
6.9% |
(24.2)% |
neutral |
down |
down |
|
|
TSX Gold Index (TGD) |
292.16 |
238.81 |
4.0% |
(18.3)% |
up (weak) |
down |
down |
|
|
|
|
|
|
|
|
|
|
|
|
% |
|
|
|
|
|
|
|
|
|
U.S. 10-Year Treasury Bond yield |
1.52% |
4.21% (new highs) |
4.7% |
177.0% |
|
|
|
|
|
Cdn. 10-Year Bond CGB yield |
1.43% |
3.61% (new highs) |
3.4% |
153.5% |
|
|
|
|
|
Recession Watch Spreads |
|
|
|
|
|
|
|
|
|
U.S. 2-year 10-year Treasury spread |
0.79% |
(0.26)% |
45.8% |
(132.9)% |
|
|
|
|
|
Cdn 2-year 10-year CGB spread |
0.48% |
(0.57)% |
17.4% |
(218.8)% |
|
|
|
|
|
|
|
|
|
|
|
|
|
|
|
Currencies |
|
|
|
|
|
|
|
|
|
US$ Index |
95.59 |
111.98 |
(1.1)% |
17.2% |
up |
up |
up |
|
|
Canadian $ |
.7905 |
0.7320 |
1.7% |
(7.4)% |
down |
down |
down |
|
|
Euro |
113.74 |
98.64 |
1.4% |
(13.3)% |
down (weak) |
down |
down |
|
|
Swiss Franc |
109.77 |
100.24 (new lows) |
0.7% |
(8.7)% |
down |
down |
down |
|
|
British Pound |
135.45 |
113.03 |
1.2% |
(16.6)% |
down (weak) |
down |
down |
|
|
Japanese Yen |
86.85 |
67.84 (new lows) |
0.8% |
(21.9)% |
down |
down |
down |
|
|
|
|
|
|
|
|
|
|
|
|
|
|
|
|
|
|
|
|
|
|
Precious Metals |
|
|
|
|
|
|
|
|
|
Gold |
1,828.60 |
1,656.30 (new lows) |
0.5% |
(9.4)% |
down |
down |
down (weak) |
|
|
Silver |
23.35 |
19.07 |
5.5% |
(18.3)% |
down (weak) |
down |
down |
|
|
Platinum |
966.20 |
933.90 |
4.4% |
(3.3)% |
up |
down |
down (weak) |
|
|
|
|
|
|
|
|
|
|
|
|
Base Metals |
|
|
|
|
|
|
|
|
|
Palladium |
1,912.10 |
2,005.50 |
0.4% |
4.9% |
down |
down (weak) |
neutral |
|
|
Copper |
4.46 |
3.47 |
1.5% |
(22.3)% |
down (weak) |
down |
neutral |
|
|
|
|
|
|
|
|
|
|
|
|
Energy |
|
|
|
|
|
|
|
|
|
WTI Oil |
75.21 |
85.05 |
(0.7)% |
13.1% |
neutral |
down |
up |
|
|
Nat Gas |
3.73 |
4.96 |
(23.1)% |
33.0% |
down |
down |
up |
|
Source: www.stockcharts.com
Note: For an explanation of the trends, see the glossary at the end of this article.
New highs/lows refer to new 52-week highs/lows and, in some cases, all-time highs.
Source: www.shadowstats.com
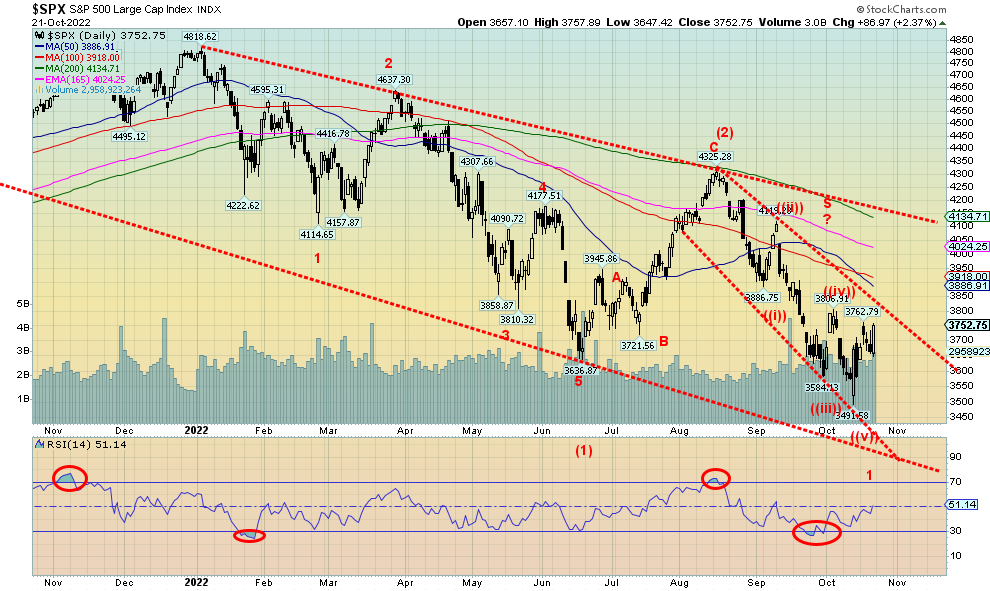
The stock market appears to have found its rally caps. It was a big up week with the Dow Jones Industrials (DJI) leaping over 700 points on Friday. Earnings? Smearnings! Some earnings disappointed but the market seemed to ignore them. The bond market, led by the 10-year, surged to new high yields but the stock market spurned that as well. An oversold bounce? However, rumours that the Fed might ease up on QT helped spur the market. Growing illiquidity in the bond market may have been behind the rally. Growing illiquidity in the bond market could spark a flight into stocks. Fears of a recession also played a role as the market thought that the Fed might even ease up on rate hikes. Still, it is widely expected at the Nov 1–2 FOMC the Fed will hike at least 50 bp, with many expecting 75 bp. But there is also growing consensus that the Fed’s rate hikes could be coming to an end. Will they hike again in December? The Fed has signaled their aim is to get to 5% and then stop. Still, that’s 175 bp away.
This past week the S&P 500 gained 4.7%, the DJI was up 4.9%, the Dow Jones Transportations (DJT) gained 1.5%, and the NASDAQ was up 5.2%. The small cap S&P 600 was up 3.3% while the mid-cap S&P 400 gained 3.0%. We’d prefer to see the small cap and mid cap leading the way. In Canada, the TSX Composite was up 2.9% and the TSX Venture Exchange (CDNX) gained 2.1%. In the EU, the London FTSE was up 1.6% despite all the chaos elsewhere, although maybe it was celebrating the end of Liz Truss. The Paris CAC 40 was up 1.7% and the German DAX gained 2.4% as natural gas (NG) prices eased. Asia didn’t fare as well as China’s Shanghai Index (SSEC) fell 1.1% and the Tokyo Nikkei Dow (TKN) was off 0.7% against the backdrop of massive currency intervention for the yen by the BOJ. If there was a loser on the week it was Bitcoin as it fell 2.3%. Stories that Bitcoin could fall to $10,000 didn’t help.
The huge outside reversal day seen on September 27 has been a catalyst for the recent gains. The S&P 500 needs to break above 3,800 to confirm to us that a low is in. After that there is resistance up 3,900 then up to 4,100 and the 200-day MA. We believe this is just another bear market rally but it could carry us to that 200-day MA as it has done before, most recently in June. The S&P 500 would have to get above 4,300 to suggest that we have a rebound that might have more legs. A breakdown under 3,600 would be negative and under 3,500 new lows are probable.
Rest of page is blank
S&P 500 PE Ratio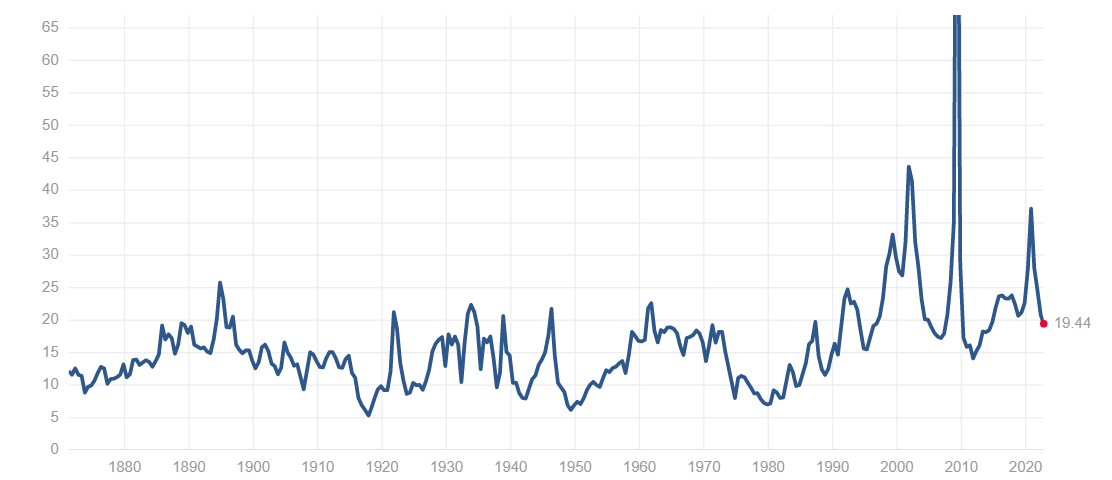
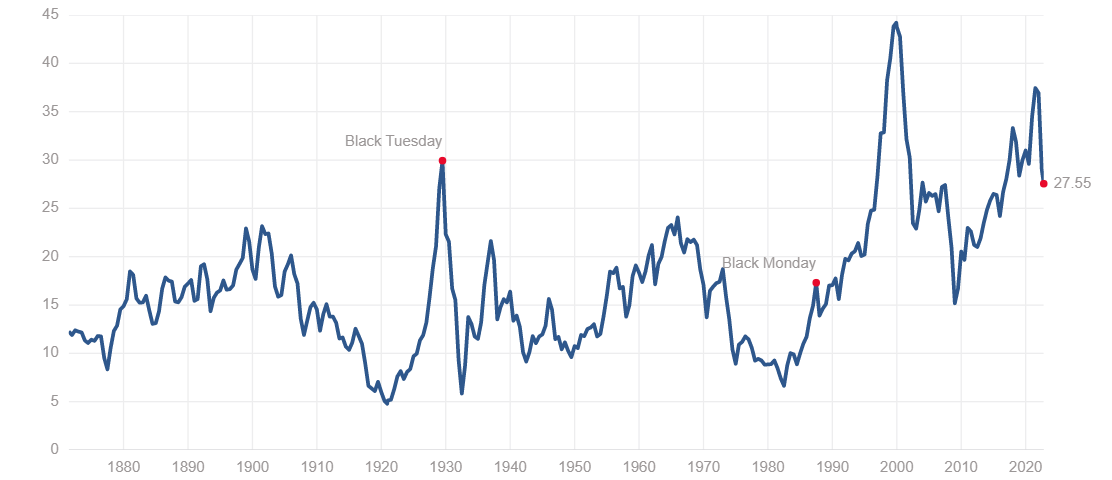
S&P 500 Shiller PE Ratio
Source: www.multpl.com
No matter how we seem to look at it, the PE ratio for the S&P 500 is still too high. The regular PE ratio at 19.44 is above both the mean 15.98 and median 14.91 PE seen over the past 150 years. The same holds for the Shiller S&P 500 PE ratio. Its mean is 16.98 and the median is 15.89. It’s no surprise that eventually everything returns to the mean. By these measurements the S&P 500 and stocks have further to fall.
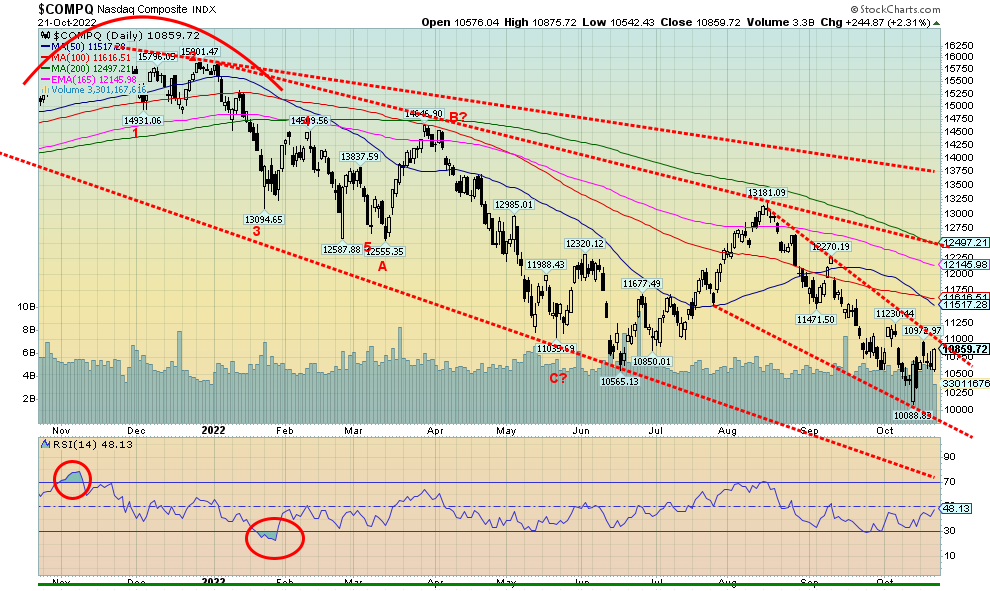
Source: www.stockcharts.com
The NASDAQ, led by the FAANG stocks, enjoyed a gain of 5.2% this past week. Leading the way on the FAANG stocks was Netflix with a whopping 25.9% gain, following news that its viewership increased and it had plans to crack down on sharing. Not all FAANG stocks were up as the Chinese FAANGS fell, with Baidu down 9.0% and Alibaba off 1.1%. Both made fresh 52-week lows. Other good gainers were Nvidia up 11.0%, Amazon up 8.6%, Apple up 6.4%, and Microsoft gaining 5.9%. Even Tesla gained up 4.6% but Twitter fell 1.1%. Yes, the ongoing Elon Musk saga and Twitter. The NASDAQ could be poised to break up through what appears to be a descending wedge triangle. The breakout is above 11,000. This should happen given the outside reversal day on September 27 and Friday’s upside reversal as well. A break back under 10,500 would be negative.
Source: www.stockcharts.com
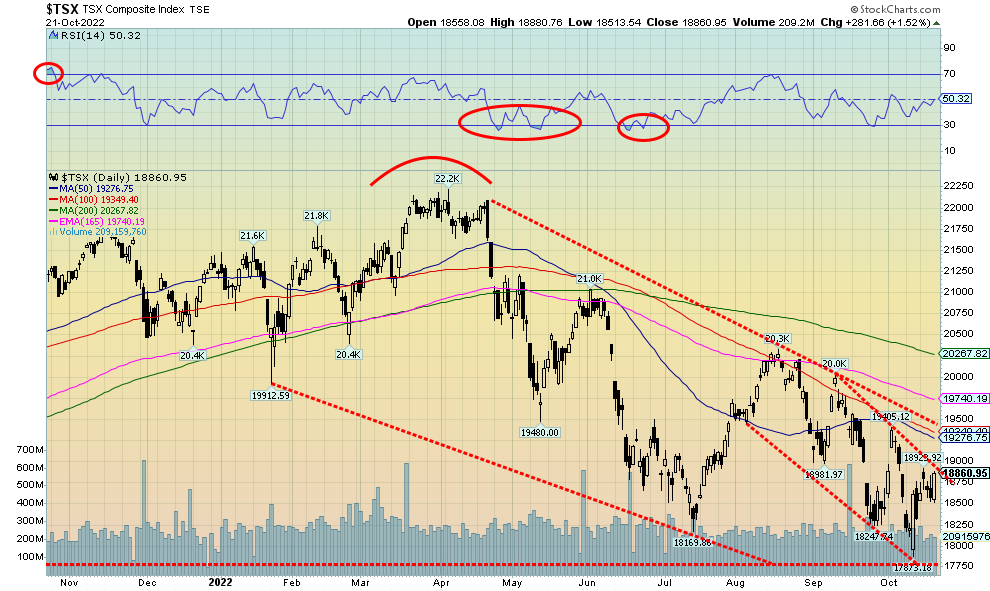
The TSX Composite joined the rebound seen for stocks this past week, gaining 2.9% with most of the gain coming on the reversal up day on Friday. This follows the huge outside reversal day seen on October 13. Just above lies a trendline that the TSX needs to break to confirm the low. The trendline comes in around 18,860. The TSX Venture Exchange (CDNX) also gained on the week, up 2.1%. There was green all around for the sub-indices as all 14 were up on the week. The leader was Energy (TEN), up 6.0%, followed by Information Technology (TKK), gaining 5.1%. Others with gains over 4% were Golds (TGD) +4.0%, Metals & Mining (TGM) +4.7%, and Materials (TMT) +4.5%. The biggest loser this year on the TSX has been Health Care (THC), down 53.2% on the year but up 1.3% this past week. Is Health Care worth a look for investors, given how bad it has been? Many of its components have been beaten down. But then the index is dominated by cannabis stocks, retirement homes, and a few pharmaceutical companies. The TSX appears poised to break out. A move back below 18,250 would be negative.
10-year Treasury Bond/Canadian 10-year Government Bond (CGB)
Source: www.tradingeconomics.com, www.home.treasury.gov, www.bankofcanada.ca
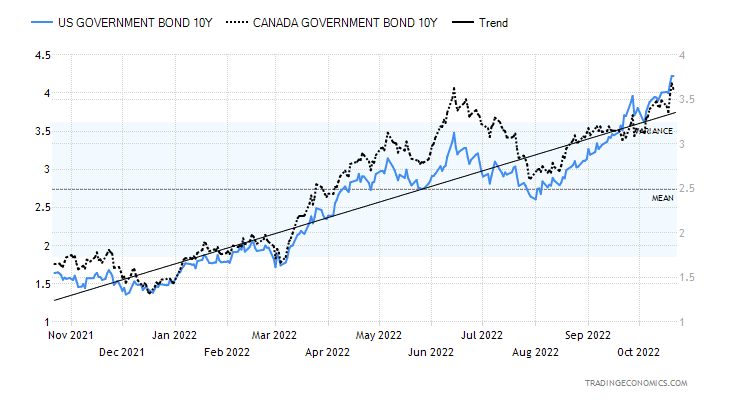
Upward pressure on interest rates continued this past week as both the 10-year U.S. treasury note and the 10-year Government of Canada bond (CGB) made fresh 52-week highs. The 10-year U.S. treasury topped at 4.24% before pulling back on Friday to close at 4.21%. Canada’s CGB closed at 3.61%. The rise of the 10-year saw the spreads narrow. The U.S. 2–10 spread narrowed to negative 26 bp while the Canadian 2–10 narrowed to negative 57 bp. Both are still negative, signaling that a recession is coming, but it still might officially be six months away. The 3-month–10-year spread did go briefly negative 3 bp this week before closing at +12 bp. The catalyst seemed to be the rumour that the Fed might ease up on QT, given the growing liquidity problems in the U.S. treasury bond market and fear that the mess in the U.K. gilt market might spread elsewhere; i.e., contagion. The growing illiquidity in bond markets is a growing concern that might yet blow up.
There wasn’t much for bonds to trade on this past week. Industrial production year-over-year for September was up a much stronger than expected 5.3%. The market had expected only a gain of 3.4%. Canada reported an inflation rate of 6% year-over-year for September, but that was still above consensus of 5.7%. PPI was up 9.0% when they expected only 8.5%. Housing starts in the U.S. were 1,439 thousand units which was below the consensus 1,465 thousand and well below the 1,566 thousand reported in August. Building permits, however, were 1,564 thousand vs. expected 1,487 thousand. Initial claims came in lower than expected at 214 thousand vs. an expected 230 thousand. But the Philly Fed was negative 8.7, below the expected negative 6. Canada’s retail sales for August year-over-year were up 7%, better than the expected 6.5% but below July’s 8%.
Key numbers out this week include the S&P Global Composite, expected at 50.1 vs. 49.5 the previous month, Case-Shiller home prices, expected up 15% vs. 16.1% the previous month, and the Conference Board’s Consumer Confidence Index, expected at 107 for October vs. 108 for September. A biggy is the advanced Q3 GDP, expected to be +2.5% vs. the negative 0.6% for Q2. It would stop a string of two consecutive negative growth quarters. In Canada, the BofC meets October 26 for the interest rate decision. It is widely expected the Bank will hike at least another 50 bp with many expecting another 75 bp. The Bank then speaks at 11 am that day.
Source: www.stockcharts.com
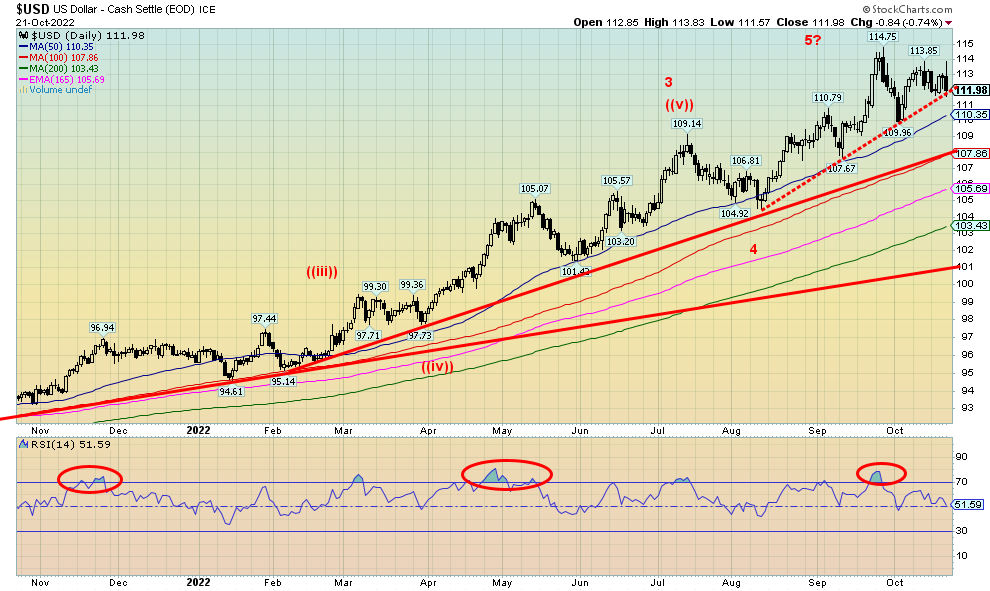
Is the US$ Index topping? That’s the question we have, following a week that saw the US$ Index reverse on Friday, putting in an outside day. The catalyst was two-fold, even three-fold. First, thoughts that the Fed may ease up on QT going forward; second, massive intervention by the BOJ to stem the decline in the Japanese yen; and, third, intervention by the BOE to stem the decline of the pound sterling and the U.K. gilt market. On the week it didn’t seem like much, but the US$ Index finished down 1.1% and now sits on the cusp of a possible breakdown. That line, which was at 110 a couple of weeks ago, is now here. A break under 111.75 could do it, although there is some support down to 110.35 at the 50-day MA. The pound gained 1.1% on the week while the yen was up 0.8% following a huge outside day and possible key reversal on Friday. Outside reversal in that the yen saw new lows for the move, then reversed and closed sharply higher. The euro was also up, gaining 1.4%, while the Swiss franc also made new lows for its move, then reversed and closed higher
by 0.7%. The Cdn$ gained 1.7% on the week. A falling US$ Index would be positive for gold. Gold did make small new lows, then reversed and closed the week up 0.5%.
Follow-through to the downside will be important this coming week if the US$ Index has truly topped. There is support down to 110, then down to 108. A breakdown under 107.75 would signal further losses. Major long-term support is down at 101. Only a move back above 114 might change the bearish scenario.
Source: www.stockcharts.com
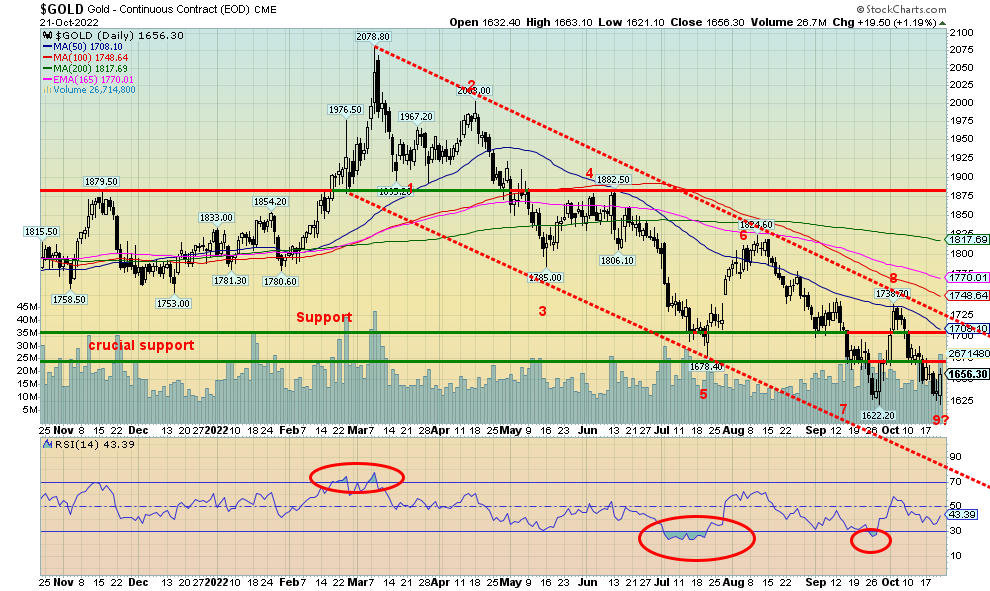
Gold made fresh 52-week lows this past week, albeit the new low was very small. The low was seen at $1,621.10 vs. a low of $1,622.20 on September 27, 2022. Friday and September 27 have other similarities in that gold reversed to the upside and put in an outside day. Another possible key reversal day. The catalyst was twofold. First, there were rumours that the Fed might ease up on QT, given growing liquidity problems in the U.S. treasury market. No word that the Fed would stop hiking rates and a 50 bp hike at the Nov 1–2 FOMC is built-in. But after that there was some speculation as to whether the Fed might ease up on its rate hikes. Second was massive intervention in the currency markets by the BOJ to support the sinking Japanese yen. That, as we noted, sparked a huge upside reversal for the yen and a downward move for the US$ Index. The result was that gold also jumped, gaining in the end about 0.5% on the week. Silver did even better, up 5.5%, while platinum rose 4.4%. Palladium was also up, gaining 0.4%, and copper jumped 1.5%. The gold stocks gained on the week with the Gold Bugs Index (HUI) up 6.9% and the TSX Gold Index (TGD) up 4.0%.
Despite the up move, gold has a lot more work to do to prove that a low is in. We have lowered our points to confirm a low. First, gold needs to regain back above $1,675 to suggest a low, then above $1,725 to confirm a low. That still leaves gold a long way from the 200-day MA, currently near $1,818. Friday’s low near $1,620 must now hold. A breakdown under $1,600 could suggest a decline to $1,500. The recent high was seen at $1,738 so that level must also be taken out. Gold has made an interesting 9-wave decline from the March high of $2,078. We rarely see that pattern, but if it holds, then we could see the start of a strong up
move. What’s key, of course, is that it doesn’t fail again, making another lower high below $1,738. That’s why we feel getting through $1,725 would give us impetus to take out $1,738 and move higher.
Source: www.cotpricecharts.com
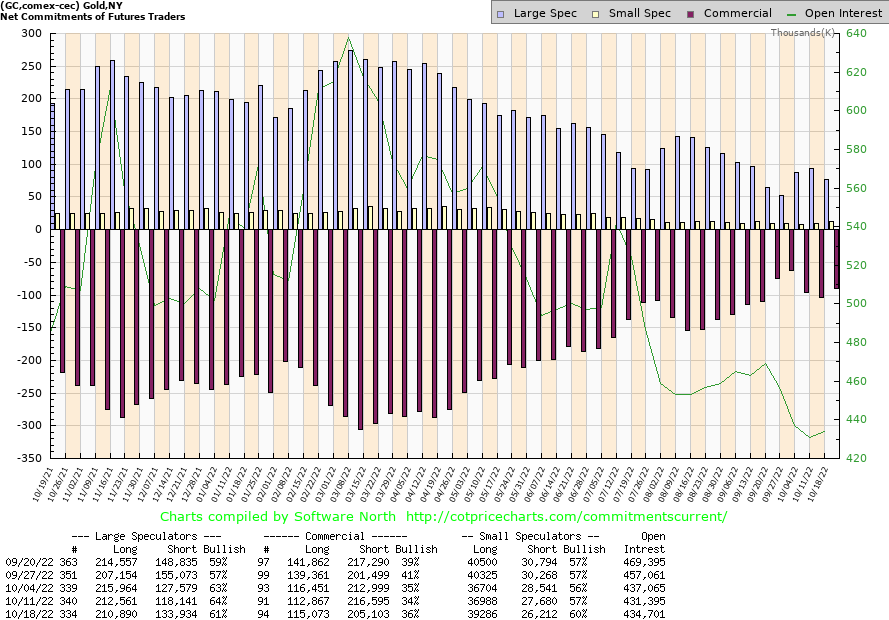
As we suspected, last week’s sell-off towards the end of the week could see a jump for the commercial COT. The commercial COT (bullion companies and banks) jumped to 36% this past week from 34%. The large speculators COT (hedge funds, managed futures, etc.) slipped to 61% from 64%. Overall, open interest rose over 3,000 contracts on an up week. That’s a positive sign. The commercial COT saw long open interest rise around 2,500 contracts while short open interest fell over 11,0000 contracts. That suggests short covering. The
large speculators saw their long position fall about 2,500 contracts while their short position jumped over 15,000 contracts. Overall, we view this COT report as positive and bullish for gold.
Source: www.stockcharts.com
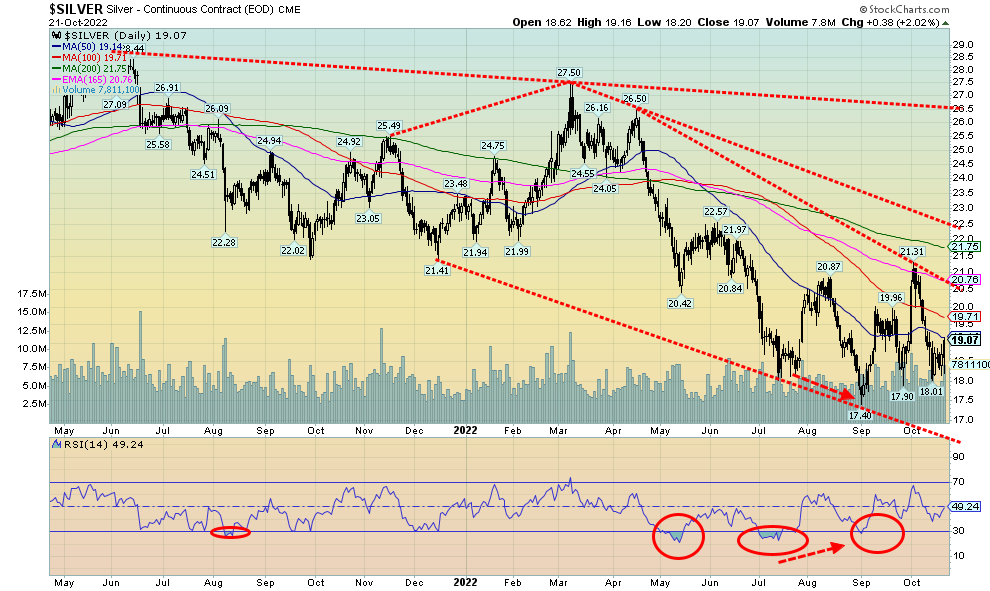
Silver prices enjoyed a strong up week, gaining 5.5%. Tellingly once again, silver did not see new lows for the current move even as gold did make small new lows. As we note next, the commercial COT improved significantly on the week. That’s a bullish sign as well. Silver rose for the same reasons gold jumped, given the recent doubt about how the Fed will proceed going forward and a falling US$ Index. If silver is making a bottom pattern, it is an odd, awkward-looking low being traced out. Since making a low in July there have been three sharp jumps for silver prices followed by three sharp drops. The most recent rise took silver up to the 165-day MA near $20.75 (high was $21.31) before it fell back once again, falling a swift 15.5% in just days. Resistance is now seen up to $20.75. Silver closed just marginally below the 50-day MA this past week. Silver needs to overhaul—first $19.75, then $20.75, and finally $21.75—to convince us that a low may finally be in. Support remains down to $17.90/$18.00. A break under that level and especially under $17.50 could see silver fall further towards $17.
Source: www.cotpricecharts.com
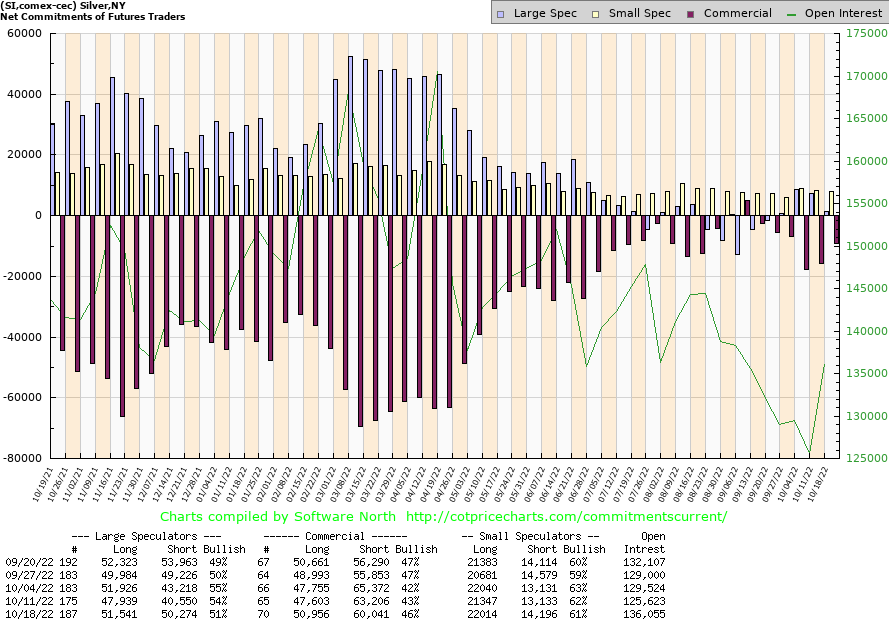
The silver commercial COT improved to 46% this past week from 43%. Given the shakedown the previous week, this may not be surprising. Long open interest rose over 3,000 contracts while short open interest fell over 3,000 contracts. The large speculators COT slipped to 51% from 54%. Still, their long position rose almost 4,000 contracts but their short position rose almost 10,000 contracts. Overall, open interest rose over 10,000 contracts on an up week. That is bullish.
Source: www.stockcharts.com
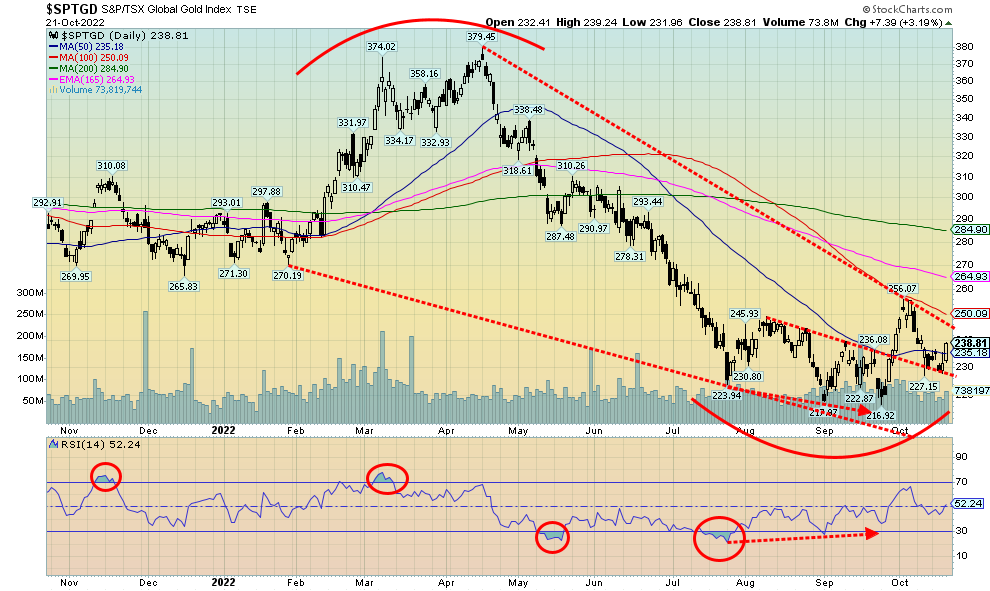
The gold stocks had a positive week with the TSX Gold Index (TGD) rising 4.0% and the Gold Bugs Index (HUI) up 6.9%. Rising gold and silver prices were the prime catalysts. It’s noteworthy that once again gold made small new lows but the gold stock indices did not. A higher low could suggest that a further rebound to come. As well, we note that the TGD held a support line near 225–230. Originally the TGD failed at the 100-day MA currently near 250. A firm breakout over 250 could send the index up towards the 200-day MA near 285. What’s key is that 225 continues to hold. The rise this past week did give us a small buy signal so a continuance of the rally this coming week becomes important. As we have pointed out so many times, the gold stocks are cheap to the price of gold. The last time gold stocks were expensive vis-à-vis gold was from 2001–2008. There continue to be positive signs that the gold stocks are being accumulated. This is particularly true for the junior gold and silver miners that dominate the TSX Venture Exchange (CDNX). These companies continue to raise funds easily with private placements often oversubscribed. All this despite weak gold and silver prices.
Source: www.stockcharts.com
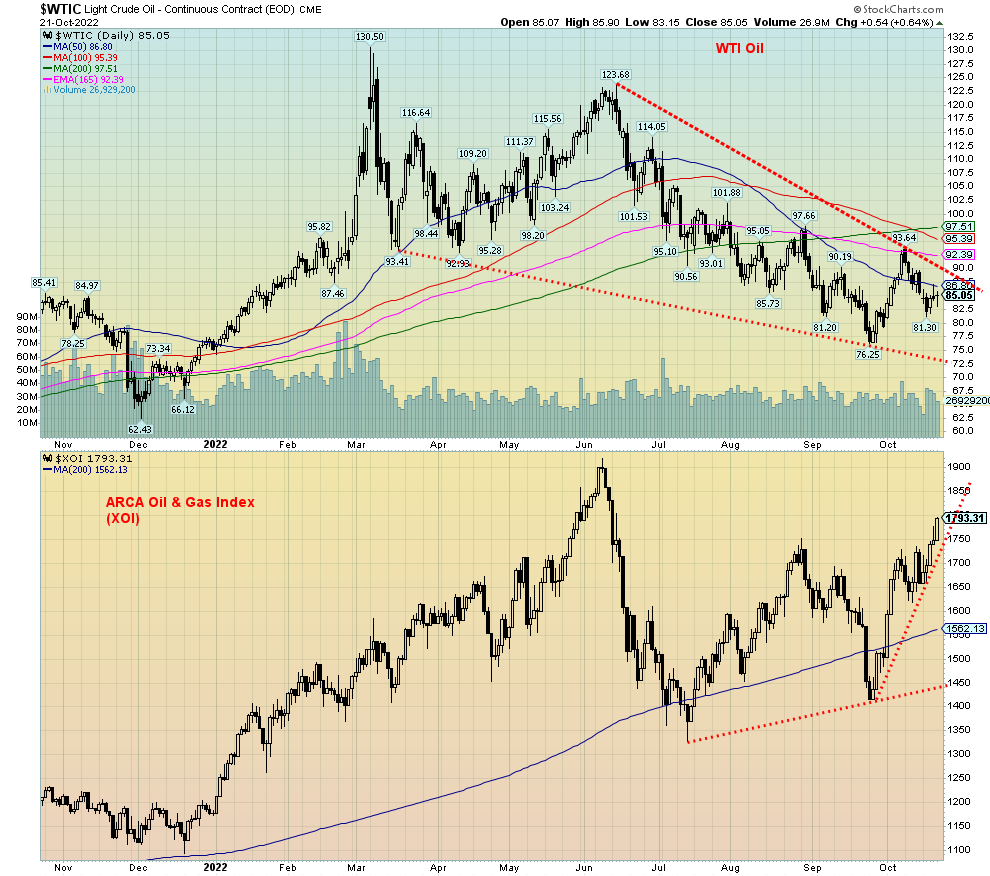
The oil market doesn’t seem to know which way to turn. Fears of recession and another strategic petroleum reserve release were offset by news of production declines in OPEC countries and China continuing to lift lockdowns. The result is that WTI oil fell about 0.7% this past week. Natural gas (NG) prices fell a sharp 23.1%, thanks to news that the EU’s storage supplies were somewhat better than expected, and that the U.S. showed a larger than expected storage build this past week. Fears of recession also helped as did somewhat lower demand out of China. Colder weather turning warmer also helped. In the EU, NG at the Dutch hub fell 20% on the week.
None of that seemed to negatively impact the energy stocks as the ARCA Oil & Gas Index (XOI) jumped 8.1% and the TSX Energy Index (TEN) was up 6.0%. Despite the recent rebound for WTI oil, the sector remains in a downtrend. Once again, WTI oil has fallen under the 50-day MA. It failed at the 165-day EMA, well shy of the current 200-day MA at $97.50. The bottom of the bear channel is down around $72.50. That’s a level that coincides with President Biden’s musings that once WTI oil gets down to around $67–$72/barrel the U.S. will start to replenish its strategic reserves. Currently, supplies hover near the bottom of the 5-year range. Gasoline supplies, on the other hand, are now well below the 5-year average range. Both could use replenishing. Still, it was a surprise to see the energy stocks respond so well, considering the current bearishness for both oil and gas.
Also helping the supply side was news that Germany continues plans to keep its nuclear plants and is also ramping up coal production. The EU may muddle through the winter. Still, risks abound. Accusations that Iran has declared war on Ukraine, and by extension NATO, have brought out fears that Iran could be attacked. That would raise the specter of the potential closing, or at least sparking slowdowns on shipments of oil through the Straits of Hormuz, a major oil conduit carrying upwards of 20% to 30% of the world’s oil supply. The Straits of Hormuz is the world’s most important oil transit chokepoint.
Despite the pullback for WTI oil over the past couple of weeks, the pattern still has the look of a descending wedge triangle. That’s potentially bullish if WTI were break back above $90. Targets could then revert to the June high near $124. The low this week was at $81.30. A breakdown under $80 could then set WTI for a fall towards $72. NG has become quite oversold and has fallen almost 26% under the 200-day MA. The odds favour a rebound. As well, seasonals may kick in as oil’s strength is seen December to June and NG’s strength is seen primarily February to June; however, a rise can and has got underway sooner in the past.
It may have been a relatively flat week for oil and a weak one for NG, but no one should feel assured that the longer-term bull is over for either oil or gas. The long-term trends remain to the upside.
Copyright David Chapman, 2022
|
GLOSSARY Trends Daily – Short-term trend (For swing traders) Weekly – Intermediate-term trend (For long-term trend followers) Monthly – Long-term secular trend (For long-term trend followers) Up – The trend is up. Down – The trend is down Neutral – Indicators are mostly neutral. A trend change might be in the offing. Weak – The trend is still up or down but it is weakening. It is also a sign that the trend might change. Topping – Indicators are suggesting that while the trend remains up there are considerable signs that suggest that the market is topping. Bottoming – Indicators are suggesting that while the trend is down there are considerable signs that suggest that the market is bottoming. |
Disclaimer
David Chapman is not a registered advisory service and is not an exempt market dealer (EMD) nor a licensed financial advisor. He does not and cannot give individualised market advice. David Chapman has worked in the financial industry for over 40 years including large financial corporations, banks, and investment dealers. The information in this newsletter is intended only for informational and educational purposes. It should not be construed as an offer, a solicitation of an offer or sale of any security. Every effort is made to provide accurate and complete information. However, we cannot guarantee that there will be no errors. We make no claims, promises or guarantees about the accuracy, completeness, or adequacy of the contents of this commentary and expressly disclaim liability for errors and omissions in the contents of this commentary. David Chapman will always use his best efforts to ensure the accuracy and timeliness of all information. The reader assumes all risk when trading in securities and David Chapman advises consulting a licensed professional financial advisor or portfolio manager such as Enriched Investing Incorporated before proceeding with any trade or idea presented in this newsletter. David Chapman may own shares in companies mentioned in this newsletter. Before making an investment, prospective investors should review each security’s offering documents which summarize the objectives, fees, expenses and associated risks. David Chapman shares his ideas and opinions for informational and educational purposes only and expects the reader to perform due diligence before considering a position in any security. That includes consulting with your own licensed professional financial advisor such as Enriched Investing Incorporated. Performance is not guaranteed, values change frequently, and past performance may not be repeated.
About the author


Website: https://www.enrichedinvesting.com
Disclaimer: David Chapman is not a registered advisory service and is not an exempt market dealer (EMD) nor a licensed financial advisor. We do not and cannot give individualised market advice. David Chapman has worked in the financial industry for over 40 years including large financial corporations, banks, and investment dealers. The information in this newsletter is intended only for informational and educational purposes. It should not be considered a solicitation of an offer or sale of any security. The reader assumes all risk when trading in securities and David Chapman advises consulting a licensed professional financial advisor before proceeding with any trade or idea presented in this newsletter. David Chapman may own shares in companies mentioned in this newsletter. We share our ideas and opinions for informational and educational purposes only and expect the reader to perform due diligence before considering a position in any security. That includes consulting with your own licensed professional financial advisor.