
“The administration does not favor, as a general proposition, government aid to private corporations.”
—G. William Miller, 65th Secretary of the Treasury, 1979–1981, 11th Chairman of the Federal Reserve 1978–1979; 1925–2006
“I’m the fellow who takes away the punch bowl just when the party is getting good.”
—William McChesney Martin Jr., 9th Chairman of the Federal Reserve 1951–1970, head of Export-Import Bank 1946–1949; 1906–1998
“How much would you pay to avoid a second depression?”
—Ben Bernanke, 14th Chairman of the Federal Reserve 2006-2014, 23rd Chair of the Council of Economic Advisors 2005–2006; b. 1953
An unholy mess! Oh yes, the debates. The debates don’t have much, if any, impact on the markets. That’s despite the stock markets being up roughly 1% the day after the September 29 debate. The fact that the Dow Jones Industrials (DJI) was down some 300 points after the debates underscores that those things are of the moment and new news can change the picture very quickly. The Dow Jones Industrials (DJI) closed the day up 328 points or 1.2%. Markets were responding more to the potential for a fiscal stimulus deal and possibly the better than expected ADP employment numbers that were released on September 30. Markets were closing on an up note at the end of the third quarter with the S&P 500 gaining about 8.5% on the quarter, even as it is down 6.3% from the recent high.
As to the debates? Well, it was either the introduction for the latest match-up of the WWE or “Grumpy Old Men 2.” Or, as one pundit described it, that we are getting closer to the end of the American Empire. He then noted that, according to Sir John Glubb (soldier, scholar, author; 1897–1986), empires have roughly a 250-year cycle (The Fate of Empires and Search for Survival). Oh yes, and empires do not usually begin or end on a certain date but where, oh where are they all today? Just to name a few—Assyrian, Grecian, Roman (Republic and Empire), Persian, Arab, Ottoman, Spain, Romanov Russian, and, oh yes, the British Empire where the sun apparently did eventually set. Naturally, we are assuming the American Empire got underway in 1776.
All of this led to us wondering whether there is a clue in the very early performance of the stock market after the election of the new president (or return of the old one, as may be the case) and leading up to the inauguration. After all, we have the “January barometer or the January effect,” the “first five days of January effect,” “sell in May and go away,” “buy when it snows, sell when it goes,” the “Santa Claus rally,” and, of course, the “Presidential cycle.” So, we thought we’d call it the “New President Effect.” We cover each president back to the election of Dwight Eisenhower in 1952. We show the gain/loss from the election day to inauguration day and the gain/loss for the term of the president.
The New President Effect
|
President Elect (Party) |
Election Date (ED) |
Inauguration Date (ID) |
Gain/(Loss) DJI (ED to ID) |
Gain/(Loss) DJI 4 Year Term |
|
Donald Trump (Rep) |
Nov 8, 2016 |
Jan 20, 2017 |
8.2% |
40.1% * |
|
Barack Obama (Dem) |
Nov 6, 2012 |
Jan 20, 2013 |
3.1% |
17.3% |
|
Barack Obama (Dem) |
Nov 4, 2008 |
Jan 20, 2009 |
(17.4)% |
71.7% |
|
George W. Bush (Rep) |
Nov 2, 2004 |
Jan 20, 2005 |
4.3% |
(21.4)% |
|
George W. Bush (Rep)1 |
Dec 12, 2000 |
Jan 20, 2001 |
(1.7)% |
(0.4)% |
|
Bill Clinton (Dem) |
Nov 5, 1996 |
Jan 20, 1997 |
10.8% |
54.9% |
|
Bill Clinton (Dem) |
Nov 3, 1992 |
Jan 20, 1993 |
(0.3)% |
109.9% |
|
George H.W. Bush (Rep) |
Nov 8, 1988 |
Jan 20, 1989 |
5.1% |
45.4% |
|
Ronald Reagan (Rep) |
Nov 6, 1984 |
Jan 20, 1985 |
(1.3)% |
82.4% |
|
Ronald Reagan (Rep) |
Nov 4, 1980 |
Jan 20, 1981 |
1.4% |
26.4% |
|
Jimmy Carter (Dem) |
Nov 2, 1976 |
Jan 20, 1977 |
1.3% |
(1.9)% |
|
Richard Nixon/Gerald Ford (Rep)2 |
Nov 7, 1972 |
Jan 20, 1973 |
4.3% |
(5.6)% |
|
Richard Nixon (Rep) |
Nov 5, 1968 |
Jan 20, 1969 |
(1.5)% |
9.7% |
|
Lyndon Johnson (Dem) |
Nov 3, 1964 |
Jan 20, 1965 |
2.4% |
4.4% |
|
John F. Kennedy/Lyndon Johnson (Dem)3 |
Nov 8, 1960 |
Jan 20, 1961 |
5.3% |
41.7% |
|
Dwight Eisenhower (Rep) |
Nov 6, 1956 |
Jan 20, 1957 |
(3.6)% |
32.4% |
|
Dwight Eisenhower (Rep) |
Nov 4, 1952 |
Jan 20, 1953 |
6.6% |
66.4% |
Source: www.wikipedia.com, www.stockcharts.com
- Election dispute decided by Supreme Court, Dec 12, 2000
- Richard Nixon resigned Aug 8, 1974, President Gerald Ford
- John F. Kennedy assassinated Nov 22, 1963, President Lyndon Johnson
- To date
As might have been expected, if the in-between period between the election and inauguration day resulted in a rising stock market, that was normally carried over for the 4-year term of the presidency. But it wasn’t always the case. In 27% of the cases where the stock market rose between election day and inauguration day, the next four years saw a down market. Of the 11 instances, only 8 resulted in a rising market for the term of the presidency. In the six cases where the stock market fell between the election date and the inauguration date, in five of those six instances the stock market actually rose over the next four years. Only once did the losing record between election and inauguration result in a losing four years. That happened under the presidency of George W. Bush (Rep) in 2001–2005.
So, what this tells us is that, if the stock market is up during the period between the election and inauguration date, the odds favour a rising stock market throughout the term. However, a losing stock market record between election and inauguration also favours a rising stock market for the remaining term. Out of seventeen elections since 1952, thirteen of them resulted in a rising stock market for the duration of the presidency. The biggest winner was Bill Clinton (Dem) who was president during a 109.9% rise for the stock market during 1993–1997. While Donald Trump’s (Rep) 40.1% gain thus far during his presidency is impressive, it ranks only sixth out of thirteen. The biggest loser was George W. Bush’s (Rep) 4-year term (2005–2009) when the DJI was down 21.4%. That was during the period of the 2008 financial crisis. It was, however, nowhere near the biggest loser, Herbert Hoover (Rep) during 1929-1933, when the DJI fell 82.1% through the 1929 stock market crash and Great Depression.
There is also the well-known Presidential Election Stock Market Cycle originally developed by Yale Hirsch, the founder of the Stock Traders Almanac (www.stocktradersalmanac.com). The Presidential Cycle examines the behaviour of the stock market over the entire 4-year period by year.
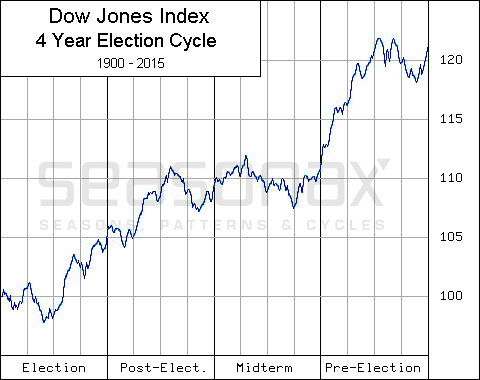
Source: www.dowjones.com, www.seasonalcharts.com
The coming cycle is as follows:
2021 – Election year
2022 – Post-election year
2023 – Mid-term year
2024 – Pre-election year
According to the Stock Trader’s Almanac, the election year is the weakest of the four years, recording 22 up years vs 24 down years with an average return of 3.0% since 1833. The strongest year is the Mid-term year, recording 34 up years with 12 down years and an average return of 10.2%. The Pre-election year, which 2020 is, was the second strongest and has shown 31 up years and 15 down years for an average return of 6.0%. So far, at least, the DJI is down on the year with Q4 to go.
Irrespective of the actions of the president, who has little direct influence over the stock market other than setting a tone, the real power behind how the stock market might perform is the Federal Reserve. With interest rates at record lows and massive piles of liquidity being provided through QE along with economic stimulus packages, the odds favour a continuance of a rising stock market over the next four years, regardless of who becomes president. Of course, there is always a caveat that something could go wrong and spark a stock market panic. With record amounts of debt outstanding one might note and say, accidents can happen.
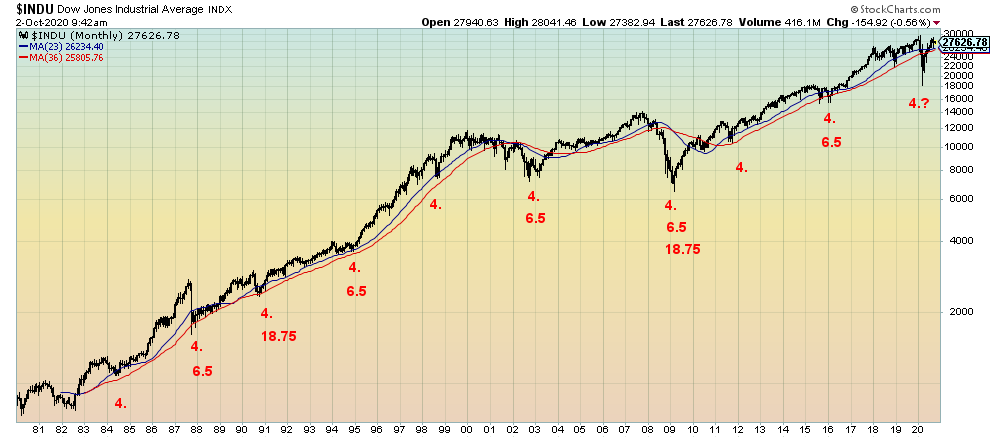
Cycles also play a role and our well-known four year (range 3–5 years) and 6.5 years (range 5–8 years) are due in 2021–2023. The 4-year cycle last bottomed, we believe, in December 2018 but we could also argue that the March 2020 pandemic collapse was our 4-year cycle low as it was within the range and it was deeper than the 2018 decline. The 6.5-year cycle last bottomed in 2015 (although the final low wasn’t seen until February 2016). Could the March 2020 low also be the 6.5-year cycle low? It is possible although we believe it came in too early to qualify. Since we have not been able to make new stock market all-time highs universal (NASDAQ, S&P 500 were the exceptions) there remains a question as to whether the March 2020 low is the final one.
We have questioned as to whether there is a 90-year cycle. That cycle last bottomed in 1932 and 90 years later is 2022. A better known 75-year cycle bottomed, we believe, with the 2008 financial crisis (previous 75-year cycle low was also 1932). Nonetheless, all of this suggests that the stock market could face some struggles over the next few years. But that doesn’t eliminate new all-time highs once again. With so much money sloshing around because of QE and ultra-low interest rates, anything is possible.
It is interesting to read what economist David Rosenberg, of Rosenberg Research & Associates (www.rosenbergresearch.com) has written—that we are in a depression, not a recession. We would tend to agree. We just don’t know we are in a depression, yet. Nor is it officially being called a depression. Still, it would fit neatly with the 90-year cycle that has a history of depressions. The last 90-year cycle was the Great Depression in 1929–1939. 90 years earlier was a huge depression that lasted roughly from 1836 to about 1850 and with downswings even after that. The stock market bottom occurred in 1842. The depression was accompanied by famines, a potato blight, financial collapse, and more. It was known as the “Hungry Forties.”
90 years before that puts us in the period of roughly 1750–1785. This was the period of the Seven Years’ War (1756-1763) and the American Revolution (1775-1783). It was also a period of a severe economic depression accompanied by stock market lows in 1761 and 1783. After the end of the American Revolution in 1783, stock markets began to rise again, peaking eventually about 1806. The wars had severely disrupted trade, contributing to the depression. It was also a period of famines. 90 years before that takes us into the 1670s, a period when the world was going through a plague, a mini-ice age, famines and a severe economic depression. 1672 was known as the “Disaster Year.”
Source: www.stockcharts.com
Our long-term monthly chart of the Dow Jones Industrials (DJI) shows examples of the 4-year and 6.5-year cycles. The 4-year cycle is actually 46 months with an orb of roughly 10 months. We also show the 18.75-year cycle which in turn is the half-cycle of 37.5 years, which in turn is half the 75-year cycle. From 1932, the 37.5-year cycle bottomed in 1974 and again in 2008–2009. 2008–2009 was also the low of the 75-year cycle. The 18.75-year cycle would have also bottomed in 1974 and it came in again in 1990. The 1987 stock market crash was a part of that cycle low. The next one came in with the 2008 financial crisis. The next 18.75-year cycle low is not due to bottom until sometime between 2021 to 2031. We are now moving into that cycle.
It is interesting to note that the 23-month MA only crossed over the 36-month MA twice—in 2001 and again in 2008. If we are really to go into a more serious downturn as might be implied with an economic depression, then the 23-month MA should cross the 36-month MA to the downside once again. We’ll keep a close eye on that as in both instances it signaled a sharp drop ahead for the stock markets. Just remember, however, that MA crossovers are a lagging indicator.
In the lead-up to the election, we know it promises to be controversial and potentially violent, given the deep divisions in the U.S today. From what we have learned, neither side will accept the other as president. Now the election has been thrown a loop with the news that President Trump has contracted COVID-19. At this stage it is considered mild and he may only be out of commission for the 2-week self-isolation period. But what if it is worse? Then what?
No matter how we look at it, the next few years promise to be rocky. Given the election may not even be decided on election night, but instead get dragged out as it did in 2000, what comes after for the market is an unknown. After winning the election, thanks to the Supreme Court, the next eight years of President Bush’s term proved to be one of the worst-performing stock markets ever. History doesn’t repeat but it can rhyme.
MARKETS AND TRENDS
|
|
|
|
% Gains (Losses) Trends
|
|||||
|
|
Close Dec 31/19 |
Close Oct 2/20 |
Week |
YTD |
Daily (Short Term) |
Weekly (Intermediate) |
Monthly (Long Term) |
|
|
Stock Market Indices |
|
|
|
|
|
|
|
|
|
S&P 500 |
3,230.78 |
3,348.42 |
1.5% |
3.6% |
down (weak) |
up |
up |
|
|
Dow Jones Industrials |
28,645.26 |
27,682.81 |
1.9% |
(3.0)% |
down (weak) |
up (weak) |
up |
|
|
Dow Jones Transports |
10,936.70 |
11,297.10 |
0.2% |
3.6% |
up (weak) |
up |
up |
|
|
NASDAQ |
9,006.62 |
11,075.02 |
1.5% |
23.4% |
neutral |
up |
up |
|
|
S&P/TSX Composite |
17,063.53 |
16,199.25 |
0.8% |
(5.1)% |
down |
neutral |
up |
|
|
S&P/TSX Venture (CDNX) |
577.54 |
708.06 |
1.9% |
22.7% |
down |
up |
up |
|
|
S&P 600 |
1,021.18 |
876.58 |
5.0% |
(14.2)% |
down (weak) |
neutral |
down |
|
|
MSCI World Index |
2,033.60 |
1,854.24 |
1.3% |
(8.8)% |
down |
neutral |
down (weak) |
|
|
NYSE Bitcoin Index |
7,255.46 |
10,523.58 |
(0.9)% |
45.0% |
down |
up |
up |
|
|
|
|
|
|
|
|
|
|
|
|
Gold Mining Stock Indices |
|
|
|
|
|
|
|
|
|
Gold Bugs Index (HUI) |
241.94 |
324.54 |
1.4% |
34.1% |
down |
up |
up |
|
|
TSX Gold Index (TGD) |
261.30 |
361.44 |
0.8% |
38.3% |
down |
up |
up |
|
|
|
|
|
|
|
|
|
|
|
|
Fixed Income Yields/Spreads |
|
|
|
|
|
|
|
|
|
U.S. 10-Year Treasury yield |
1.92 |
0.70 |
7.7% |
(63.5)% |
|
|
|
|
|
Cdn. 10-Year Bond yield |
1.70 |
0.56 |
3.7% |
(67.1)% |
|
|
|
|
|
Recession Watch Spreads |
|
|
|
|
|
|
|
|
|
U.S. 2-year 10-year Treasury spread |
0.34 |
0.57 |
9.6% |
67.7% |
|
|
|
|
|
Cdn 2-year 10-year CGB spread |
0 |
0.32 |
6.7% |
3,200.0% |
|
|
|
|
|
|
|
|
|
|
|
|
|
|
|
Currencies |
|
|
|
|
|
|
|
|
|
US$ Index |
96.06 |
93.91 |
(0.8)% |
(2.2)% |
up |
down |
down (weak) |
|
|
Canadian $ |
0.7710 |
0.7520 |
0.7% |
(2.4)% |
down |
up (weak) |
down (weak) |
|
|
Euro |
112.12 |
117.14 |
0.7% |
4.4% |
down |
up |
up |
|
|
Swiss Franc |
103.44 |
108.63 |
0.9% |
5.0% |
down |
up |
up |
|
|
British Pound |
132.59 |
129.40 |
1.5% |
(2.3)% |
down (weak) |
up (weak) |
neutral |
|
|
Japanese Yen |
92.02 |
94.89 |
0.2% |
3.1% |
up |
up |
up |
|
|
|
|
|
|
|
|
|
|
|
|
Precious Metals |
|
|
|
|
|
|
|
|
|
Gold |
1,523.10 |
1,907.60 |
2.2% |
25.2% |
down |
up |
up |
|
|
Silver |
17.92 |
24.03 |
4.1% |
34.1% |
down |
up |
up |
|
|
Platinum |
977.80 |
891.40 |
5.9% |
(8.8)% |
down |
neutral |
neutral |
|
|
|
|
|
|
|
|
|
|
|
|
Base Metals |
|
|
|
|
|
|
|
|
|
Palladium |
1,909.30 |
2,325.00 |
4.6% |
21.8% |
up |
up |
up |
|
|
Copper |
2.797 |
2.98 |
0.3% |
6.5% |
down (weak) |
up |
up (weak) |
|
|
|
|
|
|
|
|
|
|
|
|
Energy |
|
|
|
|
|
|
|
|
|
WTI Oil |
61.06 |
37.05 |
(8.0)% |
(39.3)% |
down |
neutral |
down |
|
|
Natural Gas |
2.19 |
2.44 |
(13.2)% |
11.4% |
neutral |
up |
neutral |
|
Source: www.stockcharts.com, David Chapman
Note: For an explanation of the trends, see the glossary at the end of this article.
New highs/lows refer to new 52-week highs/lows.
Chart of the Week
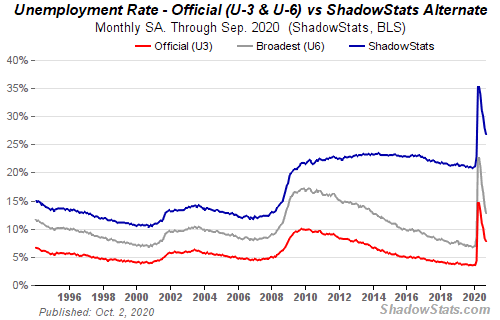
Source: www.shadowstats.com
Yes, it is that time of the month again when the U.S. job numbers are released. Canadians will have to wait another week for their employment numbers. The Bureau of Labour Statistics (BLS) reported that nonfarm payrolls rose 661,000 in September vs. a gain of 1,489,000 in August. The market had expected a gain of 850,000. During March/April 2020 the U.S. lost 22,160,000 jobs. Since then they have regained only 11,417,000 which is 51.5% of the jobs lost. Continuing jobless claims are only 11,767,000 but these are only the insured claims. The actual continued unemployed is 26.5 million. In 2009 at the peak of the financial crisis, continuing unemployed totaled 9.5 million and in 2019 continuing unemployed totaled only 1.4 million.
The question was, of course, did anyone care about the job numbers when the top story was President Trump testing positive for the COVID-19? Stock markets initially fell almost 500 points, prompting some to quip that the markets must be correlated to Trump winning a second term. The markets did snap back later, suggesting that when everyone learned it was only mild (at least for the moment) it was again correlated to Trump winning. Nonetheless, it appears he’ll be sidelined for a short while, at least.
The official unemployment rate (U3) fell to 7.9% from 8.4%. That was below the expected rate of 8.2%. When one includes short-term discouraged workers, the unemployment rate (U6) was 12.8% vs. 14.2% in August. Adding in the long-term discouraged workers and those defined out of the labour force back in 1994 the Shadow Stats (www.shadowstats.com) unemployment number was 26.9% vs. 28.0%. The BLS labour force participation rate for September was 61.4% vs. 61.7% in August. A lower labour force participation rate helps to lower the actual unemployment (U3) rate. The employment-population rate for September was 56.6% vs. 56.5% in August. The labour force has contracted since February 2020 falling by 4,403,000. The missing labour force numbers show up in “not in the labour force”. Given population gains it is difficult to comprehend that the labour force has actually shrunk over the past six months.
Assuming the U.S. can continue to add 850,000 jobs each month, then it will take at least 13 months to regain all of the jobs lost in March/April. But what this month’s report says is that job growth is actually slowing, not growing. The U.S. needs at least 100,000 jobs per month just to keep up with population growth. Over the past week alone we have learned about thousands of additional layoffs from airlines, insurance, banks, oil industry, fashion industry and, yes, even Disney who announced 28,000 mostly part-timers are to be laid off because of a huge drop in attendance.
Part-time and full-time employment remains below previous levels. Part-time employment was 24,973 thousand in September vs. 23,982 thousand in August. The peak was 28,134 in 2019. Full-time employment in September was 122,369 thousand vs. 119,532 thousand in August. The peak was 131,755 thousand. Those not in the labour force in September totaled 100,599 thousand vs. 99,720 thousand in August. In February 2020 those not in the labour force totaled 95,082 thousand. 5.5 million people don’t just willingly drop out of the labour force in just 6 months. Of the total not in the labour force, 55.1 million are retirees and 9.8 million are disabled. The number of employed persons totaled 147,563 thousand in September vs. 147,288 thousand in August. In February the employed persons level was 158,759 thousand.
One reason there is a disparity in the number officially listed as unemployed vs. the number actually unemployed is that 11.8 million unemployed are listed under the Pandemic Unemployment Assistance Program. They don’t qualify for regular unemployment insurance and are not listed in the monthly jobs report. With over 11 million fewer workers employed than there was in February, this bad unemployment situation will persist into the election. The 11 million is the equivalent of five years of job gains. With over 26 million unemployed it doesn’t quite fit into the 6.6 million supposed job vacancies. That’s four persons for every job and many may not even be qualified for the jobs that are available. With the failure to pass another relief package, that could translate into a huge spike in homelessness as evictions rise.
As a final note, the BLS continues to acknowledge the misclassification of some “unemployed persons” as “employed.” The BLS notes that some 773,000 are classified as “employed” who should be classified as “unemployed.” This would hike the U3 unemployment rate to 8.3% up from the 7.9% officially reported. The BLS also notes that there are 7.2 million counted as part of the labour force who want a job, but because they were not actively looking, they are counted as not in the labour force. There are also listed some 581,000 who are marked as discouraged workers but believe there is no job available (they are probably right).
When you take everything into consideration the September employment report is not very good. It is consistent with a L recovery and definitely not a V recovery.
Source: www.stockcharts.com
What a week. A chaotic presidential debate, President Trump and First Lady Melania coming down with COVID, and weaker than expected job numbers for September. The markets tanked on Friday in response to the chaotic week. The S&P 500 fell 1.0% on Friday but managed to stay afloat for the week, gaining 1.5%. The Dow Jones Industrials (DJI) rose 1.9% while the Dow Jones Transportations (DJT) continues to perform well, up 0.2%. The NASDAQ gained 1.5%. The small cap S&P 600 continued to surprise, up 5.0% on the week, but a reminder that it remains down 14.2% on the year. The TSX Composite gained 0.8% while the TSX Venture Exchange (CDNX) was up 1.9%. In the EU, the London FTSE was up 1.1%, the Paris CAC 40 gained 2.0%, while the German DAX was up 1.8%. In Asia, China’s Shanghai Index (SSEC) was flat while the Tokyo Nikkei Dow (TKN) fell about 0.8%.
Last week we anticipated a bounce-back week, but now we are wondering whether the party is ending before it really gets underway. With COVID numbers rising threatening lockdowns again, signs of economic weakness, layoffs galore being announced, continued uncertainty about the election, and now the president down with the COVID, October could be shaping up to be a volatile month.
October is known as the crash month—1929, 1987, 1989, 1997, 1978, and 1979. But October is also a month known as a “bear killer” with key lows in 2002 and 2008 but also in 1946, 1957, 1960, 1974, 1987, 1990, 1998, and 2001. We also recall the important top in October 2007. October is also known as the last month of the worst six months of the year (although that is a bit of a myth). Overall, October is actually the seventh best performing month of the year which puts them in the lower middle of the range. October is known as great month to buy. And November marks the beginning of “buy when it snows.”
Given everything going on, this October is looking to be a very uncertain month—which in turn throws a big uncertainty into the market; i.e., what if the president becomes incapacitated, or worse? We add to that the chaos created out of the first debate, a non-debate more like a shouting match. There remains huge election uncertainty despite the candidate Joe Biden seeming to be comfortably ahead in the polls. There have already been violent incidents at early polls with intimidation and attempts to block voters. Trump has threatened to send in Homeland Security troops to guard the election. Effectively another form of intimidation. There is controversy over mail-in ballots. There is the threat of violence during the month related to the election and violence on election day. There are threats by the president to challenge the results of the election, regardless of what the margin is. There is looming controversy over the confirmation of a new Supreme Court judge. And there are signs that the economy is softening, given the weaker than expected job numbers on Friday. Huge layoffs have been announced. There is controversy over a new stimulus package with congress suggesting one number and the Senate another.
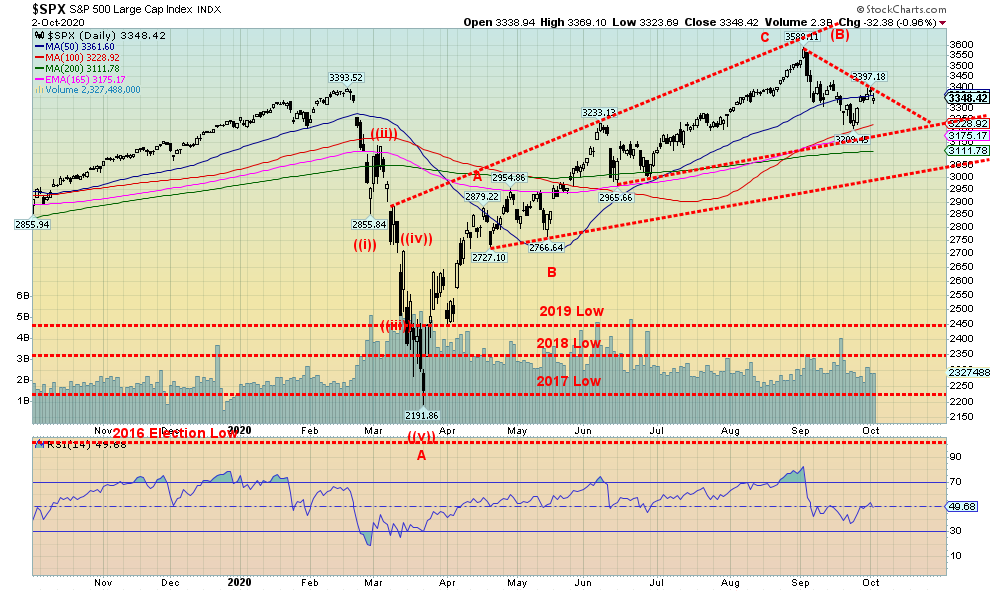
And not only is October shaping up as a volatile month, but it is shaping up as a potential down month. However, we don’t want to jump the gun too quickly on that as we need to take out first 3,300 and then 3,200, the recent low (3,209). Below 3,200 the S&P 500 could target down to last good support at around 3,000. A breakdown under 3,000 could spark a panic and another October crash. Interim support is at 3,100 and the 200-day MA.
Despite Friday’s down day, the breadth wasn’t impressive so we still might have some ability to rise first before falling. But we need to take out the recent high near 3,400 to suggest a move up to 3,450/3,500. Above 3,500 new highs are probable.
But the downside is our concern as there are just too many controversies and too many uncertainties. Be prepared for a rocky volatile bumpy month.
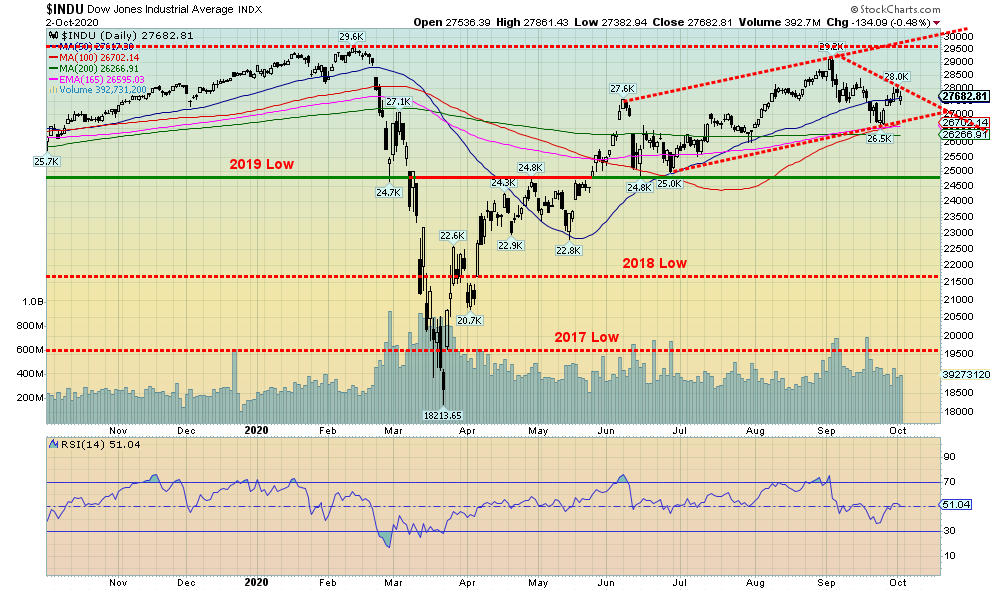
Source: www.stockcharts.com
The DJI gained 1.9% this past week. However, on Friday following the news that President Trump was down with COVID, the DJI fell 134 points or 0.5%. It is a possible that a gentle upsloping channel is developing; however, a breakdown under 27,000 would be negative, prompting a decline to 24,000 to get underway. In between, there is support at around 26,300 and again at 25,000. The high Thursday was at 28,041 so we would need to take that point out to suggest further up moves. Above 28,575 new highs are possible. It is possible that the high on Thursday at 28,041 represents a high. We could be beginning a third wave down once we break the recent low at 26,537.
Source: www.stockcharts.com
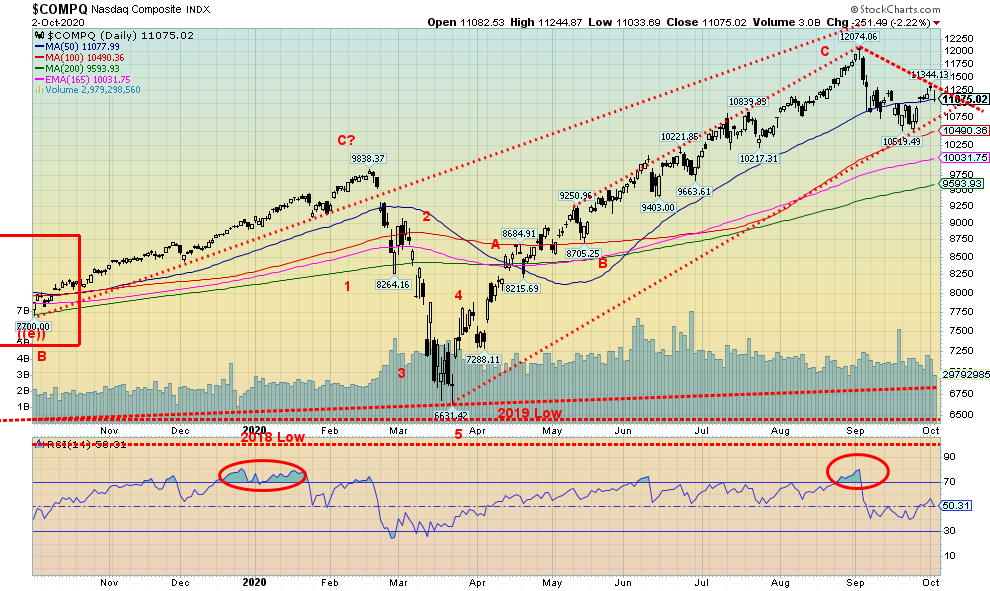
The NASDAQ remains the star index thanks to its heavy weighting of tech stocks that have led this market higher from the March pandemic mini-panic. The NASDAQ gained 1.5% on the week and remains up 23.4% in 2020. How did the biggies fare this past week? Netflix led the way up 4.2%, Facebook gained 2.0%, Google was up 0.9%, Amazon was up almost 1.0%, and Apple up 0.7%. But Microsoft had a bad week, off 0.8%. Berkshire Hathaway gained 0.7% and Tesla continues to be hot, up 1.9%. The NASDAQ’s gain this week is slightly tainted as it spiked up to 11,344 and then reversed, falling sharply on Friday, off 2.2% or 251 points. So, a small top might well be in. Now we have to watch the downside once again. The breakdown point is at 10,750. If the recent low at 10,520 breaks, then the NASDAQ is liable to fall to 10,000 and even down to the 200-day MA near 9,600. If a larger decline is underway the NASDAQ may have only completed waves 1 and 2. A third wave down could take the NASDAQ down to 8,960. New highs above 11,344 would be positive and above 11,700 new all-time highs are possible.
Source: www.stockcharts.com
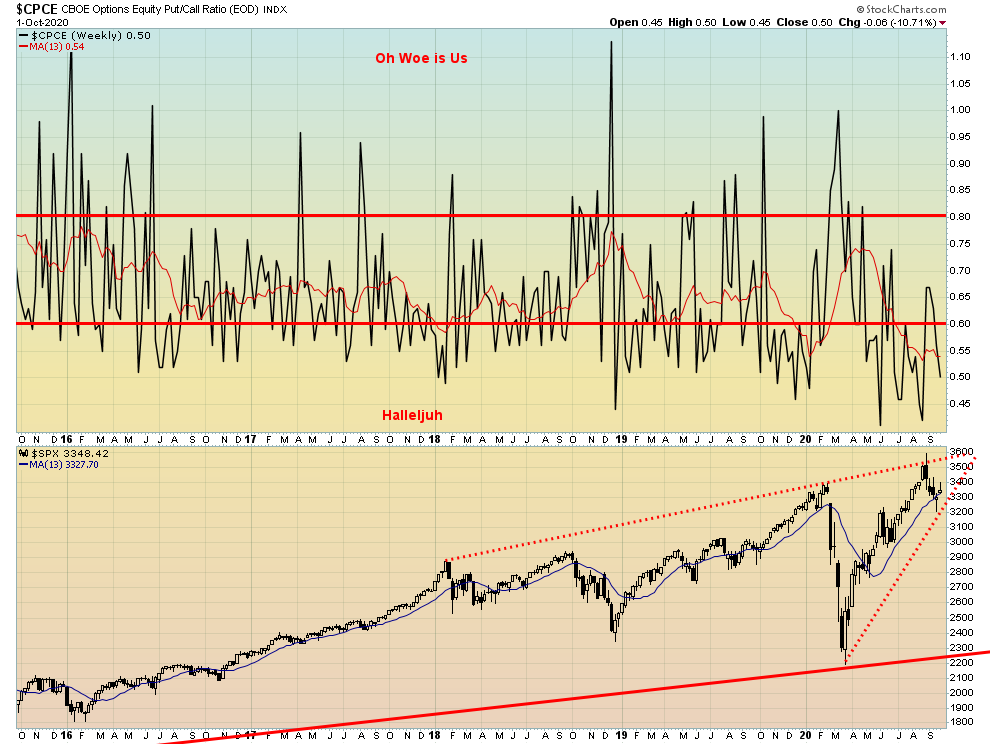
We were quite surprised that, despite the feeble rise of the stock market this past week, the put/call ratio fell to 0.54, not far from its recent record low at 0.40. This was stunning because we would not have thought the market would have become so bullish so quickly. But it appears to be the case. And if that’s correct, then this market is primed for a fall.
Source: www.stockcharts.com
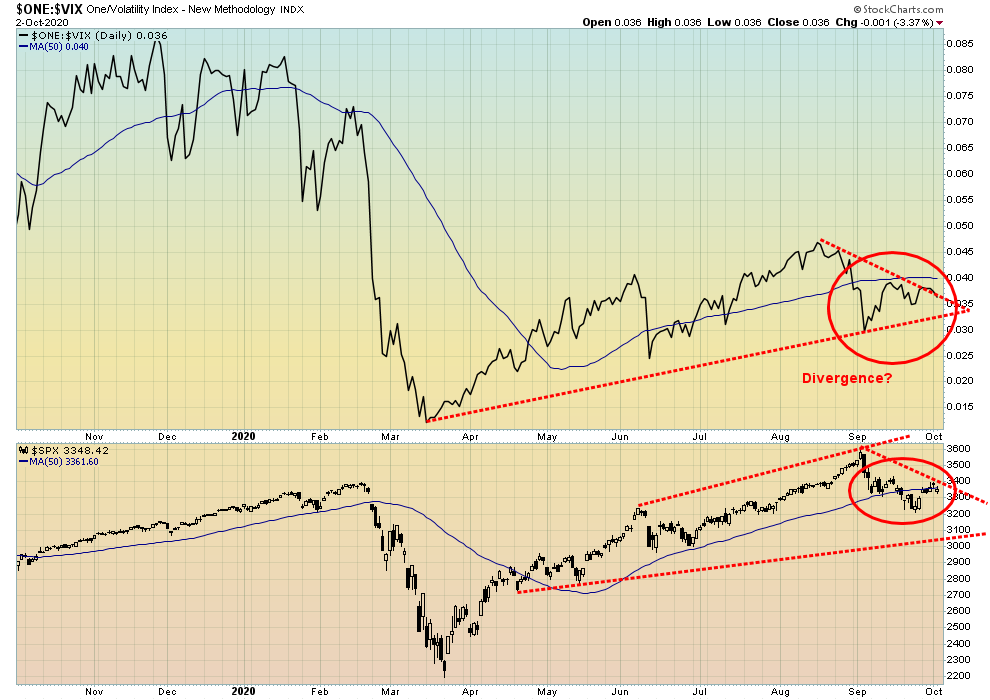
The divergence between the price action of the S&P 500 and the VIX volatility indicator continues into this week. It is not a major divergence but it is worth noting. On the positive side, both are at or below the 50-day MA. However, the S&P 500 recently made a new low for its move down while the VIX did not, a divergence.
Source: www.stockcharts.com
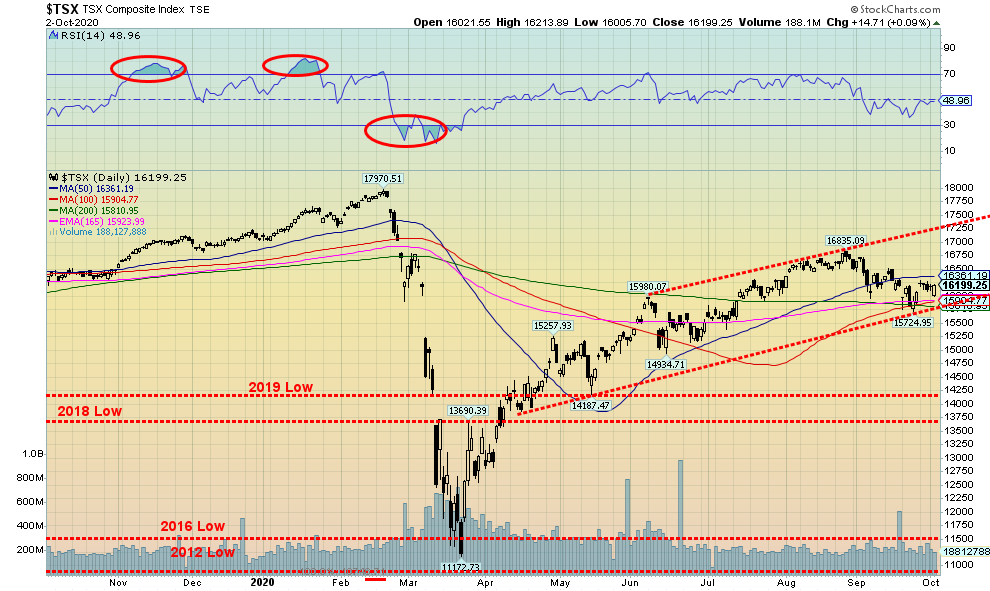
The TSX Composite managed to eke out a gain of 0.8% this past week. Canada’s major index failed, however, to break above its 50-day MA, keeping the recent downtrend in place. The TSX appears to remain within a gentle sloping bull channel although it is down near the bottom of the channel. A small downtrend has developed from the recent high of 16,835, leaving the TSX down 3.8% from that high. The TSX Is down 5.1% on the year. This past week only three of the fourteen sub-indices were down. Leading the way down was Energy (TEN), off 4.2%. But the Energy sector is a large component on the TSX so it has an overall drag. The other two down were Consumer Staples (TCS), down 0.4%, and Health Care (THC), off 0.1%. Leading the way to the upside was Income Trusts (TCM), up 3.1%. Also, with a decent gain this past week was Consumer Discretionary (TCD) up 2.9%, Real Estate (TRE) up 3.0%, and Information Technology (TKK) up 2.2%.
As long as the TSX can hold above 15,800 the index should remain in the gentle upsloping channel. A break of 15,800 would be negative and suggest that the TSX could fall to next major support near 14,250. The TSX needs to regain back above 16,550 to suggest to us that the mini-downtrend might be over. Above 16,570 the TSX could rise to new highs.
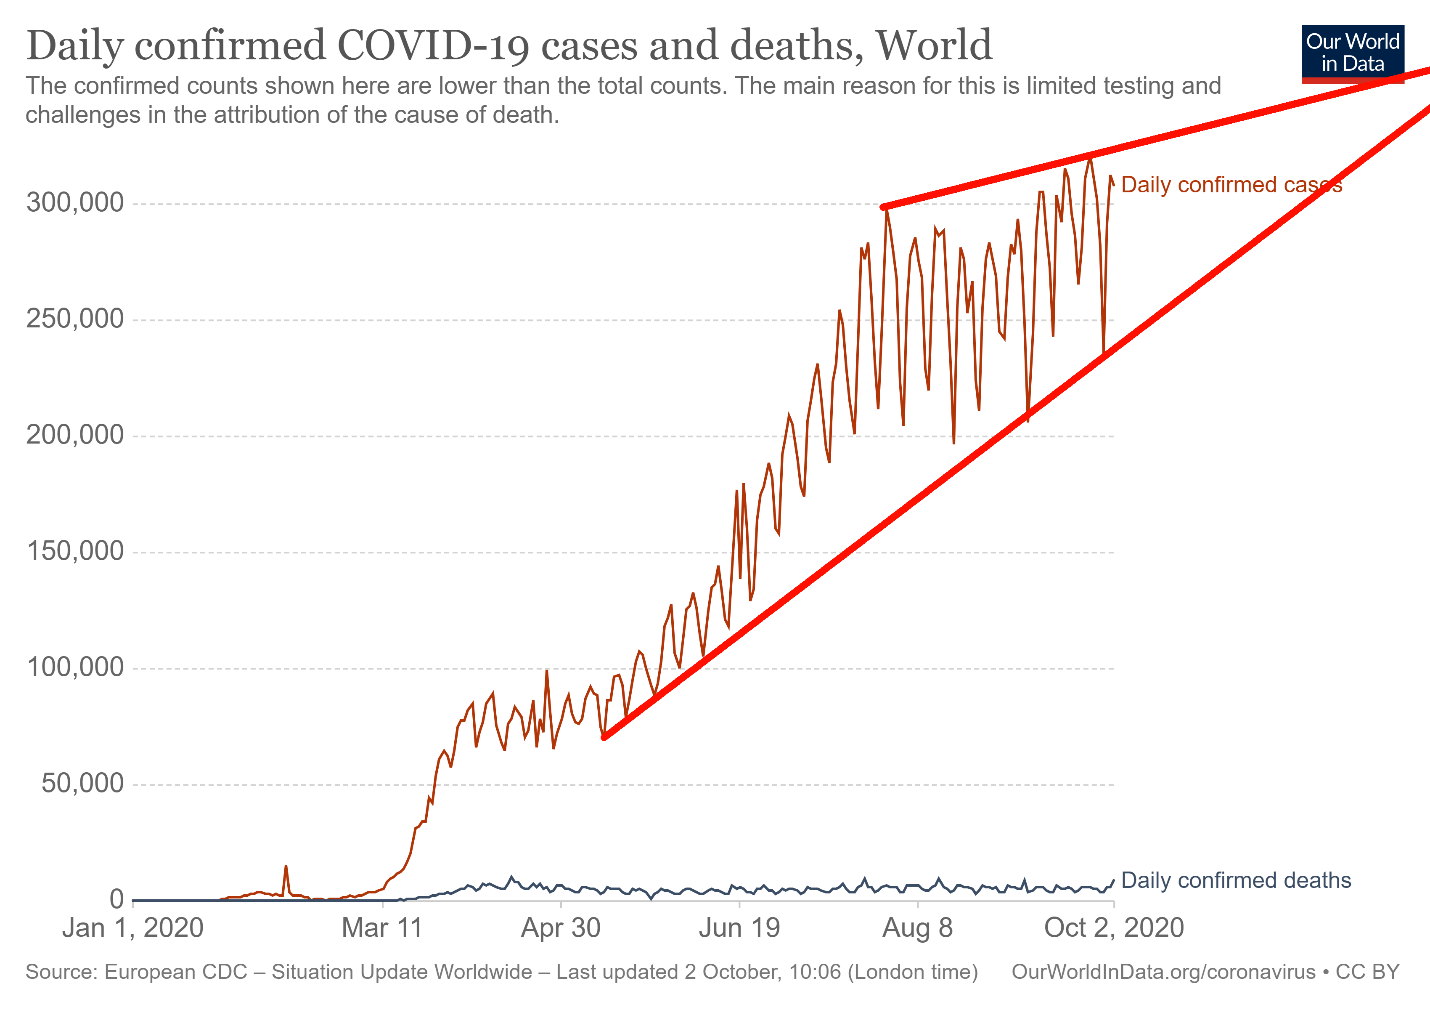
Source: www.ourworldindata.org/coronavirus
The world remains on a rising trajectory in terms of daily COVID-19 cases, now recording on average 287 thousand cases daily and 5,000 deaths daily. That puts the world on pace for over 60 million cases and over 1.5 million deaths by year end. The daily case load is rising in what appears to be an ascending triangle. That is usually a bearish sign, so despite the rise this could actually be good news. The trouble is that the number of daily cases still has room to rise within the context of the triangle, but the channel should or at least could get narrower and narrower. The U.S., India, and Brazil remain ensconced as number 1, 2, and 3 in the world in cases. The U.S. has over 7.5 million, India over 6.5 million, and Brazil (who has slowed of late) close to 5 million cases. In terms of deaths, the U.S. has a big lead over number 2 Brazil. India is third in deaths as its generally younger population is able to survive the COVID-19 better. But India may also be grossly underreporting both cases and deaths.
Coronavirus Pandemic – October 4, 2020 15:30 GMT
Number of Cases: 35,230,988
Number of Deaths: 1,039,332
Source: www.ourworldindata.org/coronavirus
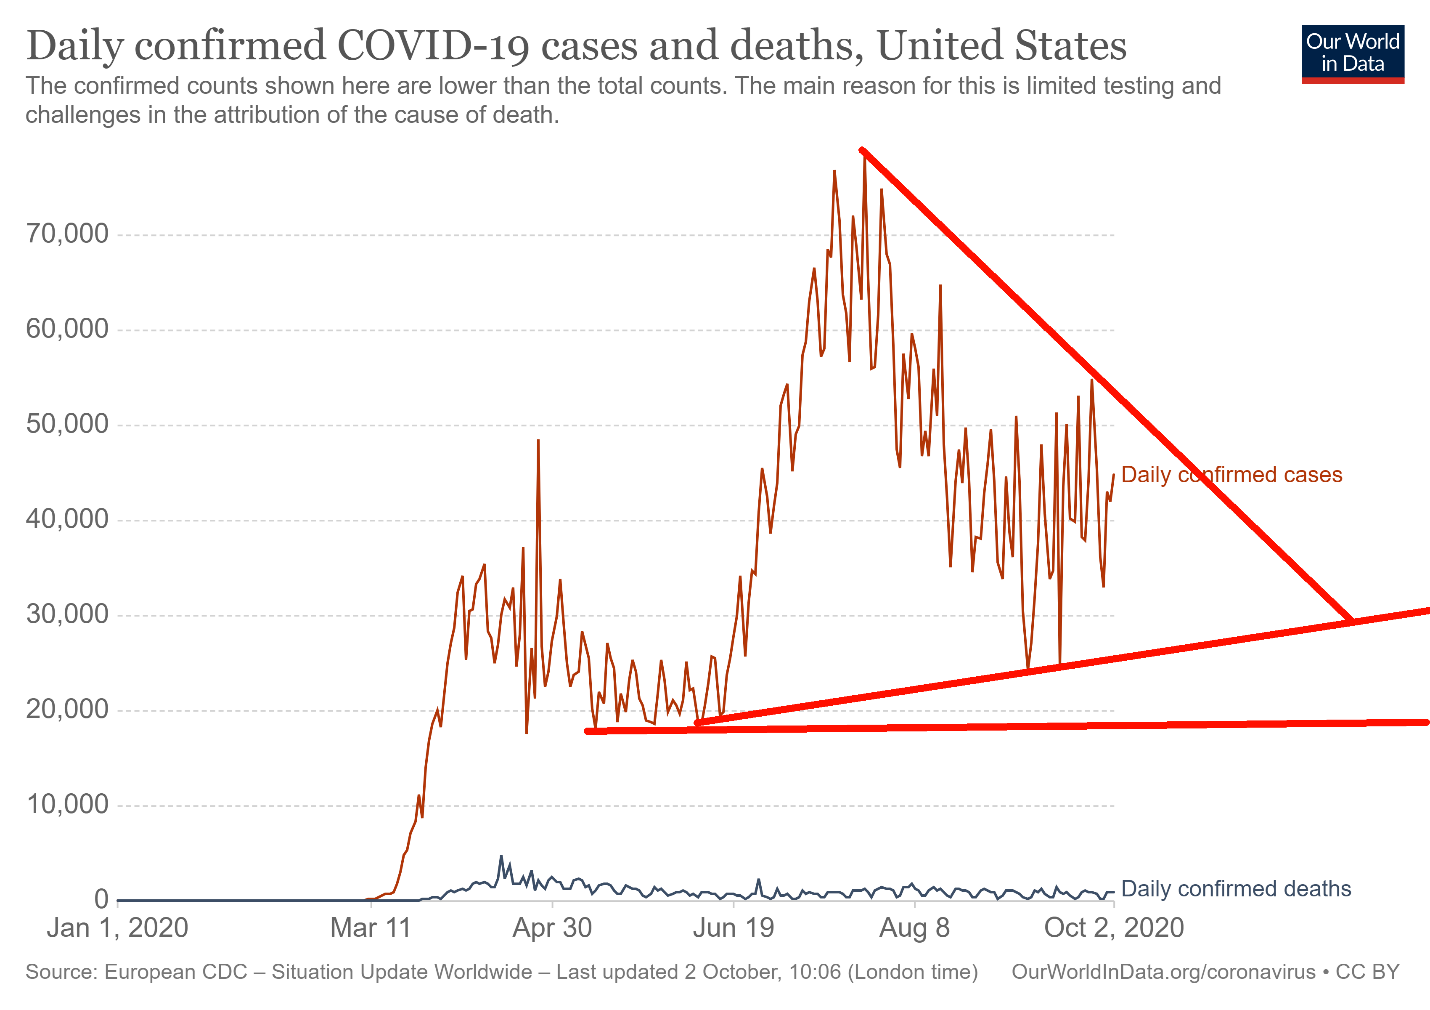
With President Trump coming down with the COVID-19, he is now just a statistic. On October 2, 2020 some 51,403 Americans were diagnosed with COVID-19, including President Trump and his spouse the First Lady Melania Trump. The U.S. also experienced 864 deaths that day as well. Trump joins a host of world leaders who have contracted COVID-19, including Boris Johnson PM of the U.K., Mikhail Mishustin PM of Russia, Jair Bolsonaro President of Brazil, and Alexander Lukashenko President of Belarus, plus others. Here in Canada Erin O’Toole the leader of the opposition Conservative Party and Yves Blanchette the leader of the Bloc Québécois have contracted COVID-19. The COVID has now struck other members of the Trump White House including Kellyanne Conway, campaign manager Bill Stepien, Hope Hicks (previously announced), plus at least three or four senators. Presidential candidate Joe Biden and his spouse have tested negative as has VP Mike Pence.
The U.S. remains number 1 in terms of both cases with over 7.6 million and deaths with over 214 thousand. When you put that in terms of cases and deaths per million population the U.S. ranks lower. The U.S. ranks number 12 in terms of cases per million population and number 10 in terms of deaths per million population. That is still no mean feat. You can’t really compare the U.S. with tiny San Marino who ranks number 1 in terms of deaths per million and Qatar who ranks number 1 in terms of cases per million population. Their populations are much lower. The U.S. ranks as the third most populous country in the world behind China and India. That represents just a bit over 4% of the globe’s population. The number of cases has been rising once again pushing back over 50,000/day. But that remains well short of the peak seen back in June and July when the U.S. recorded days with over 70,000 cases. Deaths remain elevated with over 1,000/day being reported quite regularly. California, Texas, and Florida continue to lead the number of cases while New York, Texas, and New Jersey are leading the death count. However, California and Florida are quickly gaining and could soon surpass both Texas and New Jersey. The U.S. remains on pace for 11–12 million cases and over 300,000 deaths by year end.
Coronavirus Pandemic – October 4, 2020 15:30 GMT
Number of Cases: 7,606,854
Number of Deaths: 214,330
Source: www.ourworldindata.org/coronavirus
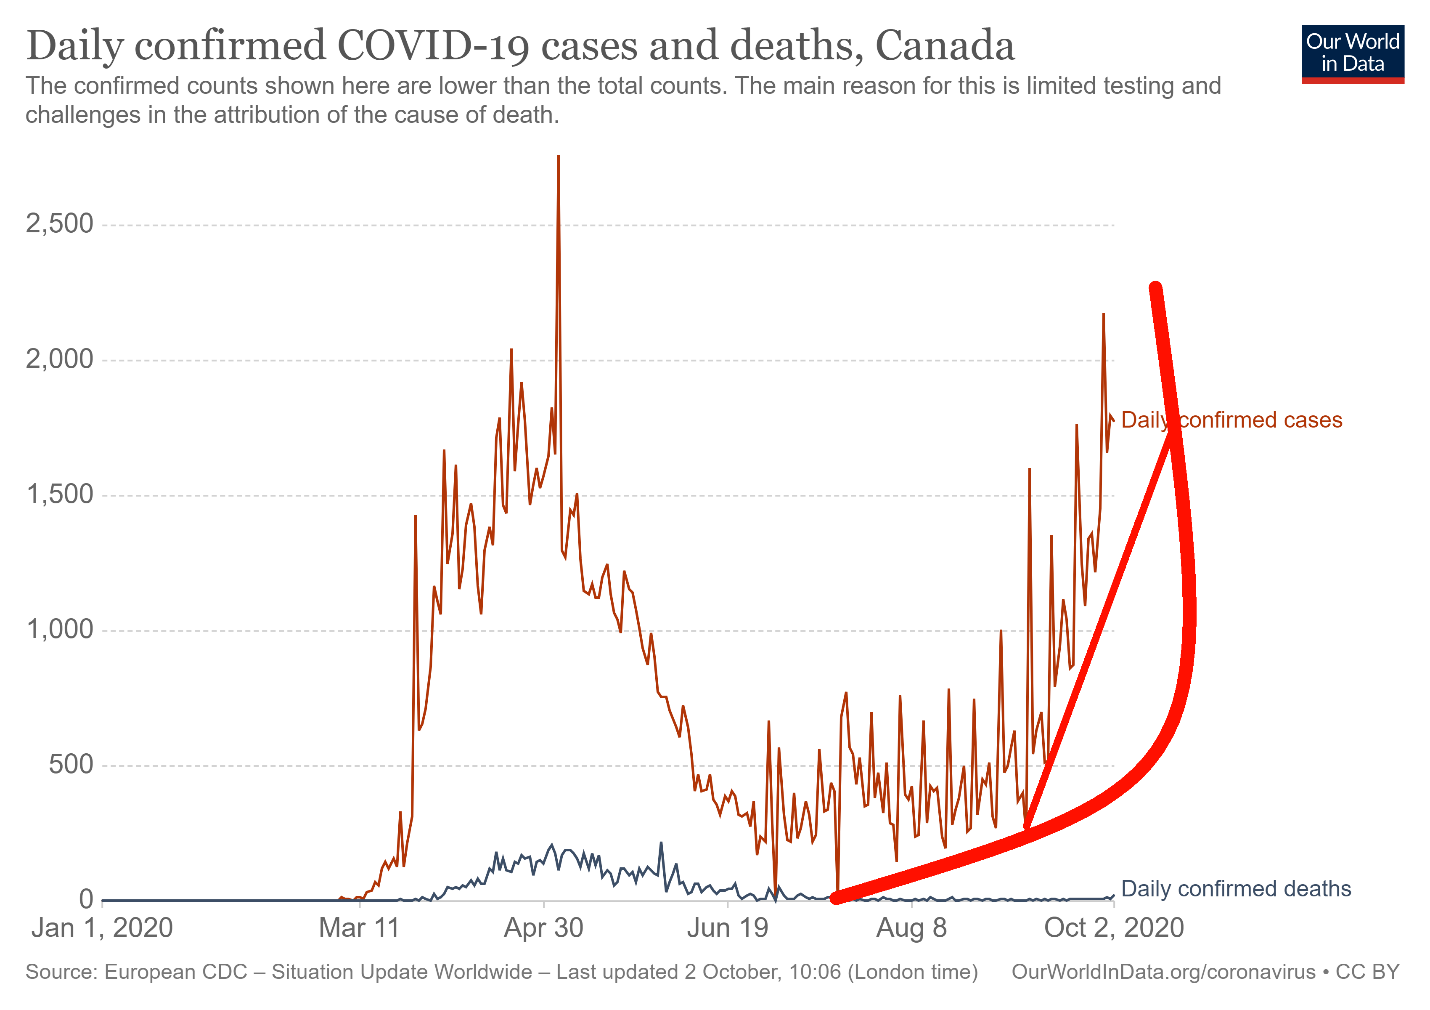
The number of cases in Canada has jumped precipitously over the past couple of weeks. From a 7-day average of between 350 to 400 cases daily back in August 2020 the 7-day average has now soared to over 1,700, hitting a peak so far of 2,176 cases on September 28. That’s still short of the over 2,700 cases Canada saw on May 3 at the height of wave 1. Wave 2 in Canada is taking on some meaning. That’s the bad news. The good news is the death toll is lower. From a high 7-day average of 175 daily back in May 2020 the average today is down around 20. But that number has doubled from levels seen only a week or two back. The number has been pushed up recently, with a spike on October 2 when 90 deaths were recorded. The cases are also showing up more often in younger people; hence, the prime reason the death toll is down as they are more likely to survive. Back at the peak, upwards of 80% of the deaths were occurring at long-term care homes. Canada continues to rank at number 26 in terms of cases and number 20 in terms of deaths. Overall, that is still quite high. However, when you look at it in terms of cases per million population Canada is well down at 85th. In terms of deaths per million population, Canada ranks 33rd.
Coronavirus Pandemic – October 4, 2020 15:30 GMT
Number of Cases: 165,037
Number of Deaths: 9,468
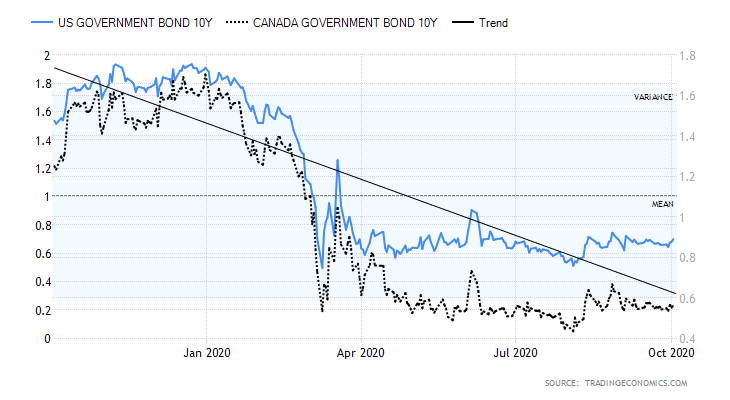
US 10-Year Treasury Note, Canada 10-Year Government Bond (CGB)
Source: www.tradingeconomics.com
Interest rates backed up slightly this past week with the U.S. 10-year treasury yield rising to 0.70% from 0.65% and the Canadian 10-year Government of Canada Bond (CGB) rising to 0.57% from 0.52%. We are not reading a lot into it and our expectations are that both 10-year bonds should remain low within a trading range. We see no reason that bond yields are about to rise, given the pledge from the Fed to keep rates low for the next few years and the weak pandemic conditions continuing. We say this irrespective of what is going on with the pandemic, the economy, or the election. The low bond yields have encouraged U.S. corporations to borrow $1.38 trillion in 2020 thus far, pushing their already huge large debt loads into even higher record territory. This is in both the U.S. and Canada. Nobody seems worried that there could be an accident in the corporate debt market because they know the Fed (and BofC) will keep rates low for years to come and they know that the Fed (and BofC) will ride to the rescue if anything happens. As well, both the Fed and the BofC continue to buy corporate bonds. The U.S. Federal debt has also shot up now over $27 trillion and the budget deficit appears headed for $6 trillion. Print, print, print. By the time inauguration day January 20, 2021 rolls around the U.S. debt could be close to $28 trillion. At some point the stuff will hit the fan, but right now nobody cares or is worried. The U.S. debt to GDP ratio is 137% (Canada’s is around 49%). The U.S. is the most indebted country in the world. Empires don’t last that have become so indebted that bankruptcy is threatened. Ask Britain and France following WW1.
Source: www.stockcharts.com
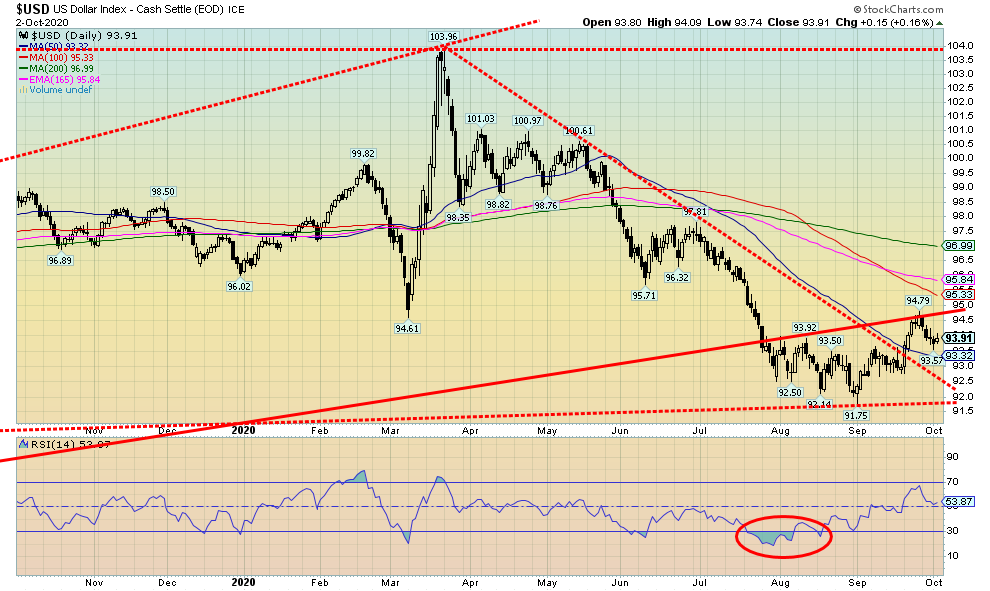
With President Trump coming down with COVID plus the weak job numbers on Friday, the US$ Index appears to have stalled out at a key resistance line. The US$ Index fell 0.8% this past week after stalling out above 94. The euro was up 0.7%, the Swiss franc gained 0.9%, the pound sterling jumped 1.5% (Brexit, what Brexit?), and the Japanese yen gained a small 0.2%. The Cdn$ was also up, gaining 0.7%. The failure so far of the US$ Index to firmly break out above 94 raises both bullish and bearish potential. The bullish case is that the US$ Index pushes through 94 and the recent high of 94.79 to test up to the 200-day MA near 97. The bearish case has the US$ Index topping out at the recent 94.79 and a break back below 92.75 would suggest that the next move to the downside was underway with potential targets down to 88/89. If, following the weaker than expected job numbers, economic numbers continue to be weak, the controversies surrounding the election deepen, and Congress and the Senate finally come up with more aid packages, then the US$ Index is liable to fall. Ultimately, the US$ Index is going to fall further but the short-term outlook is cloudier with a case for either up or down.
Source: www.stockcharts.com
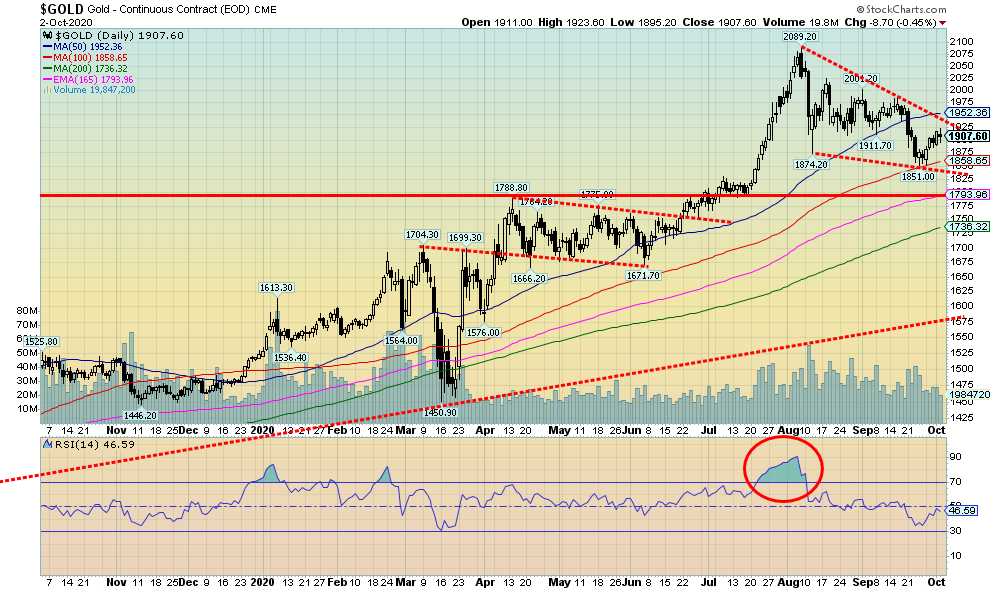
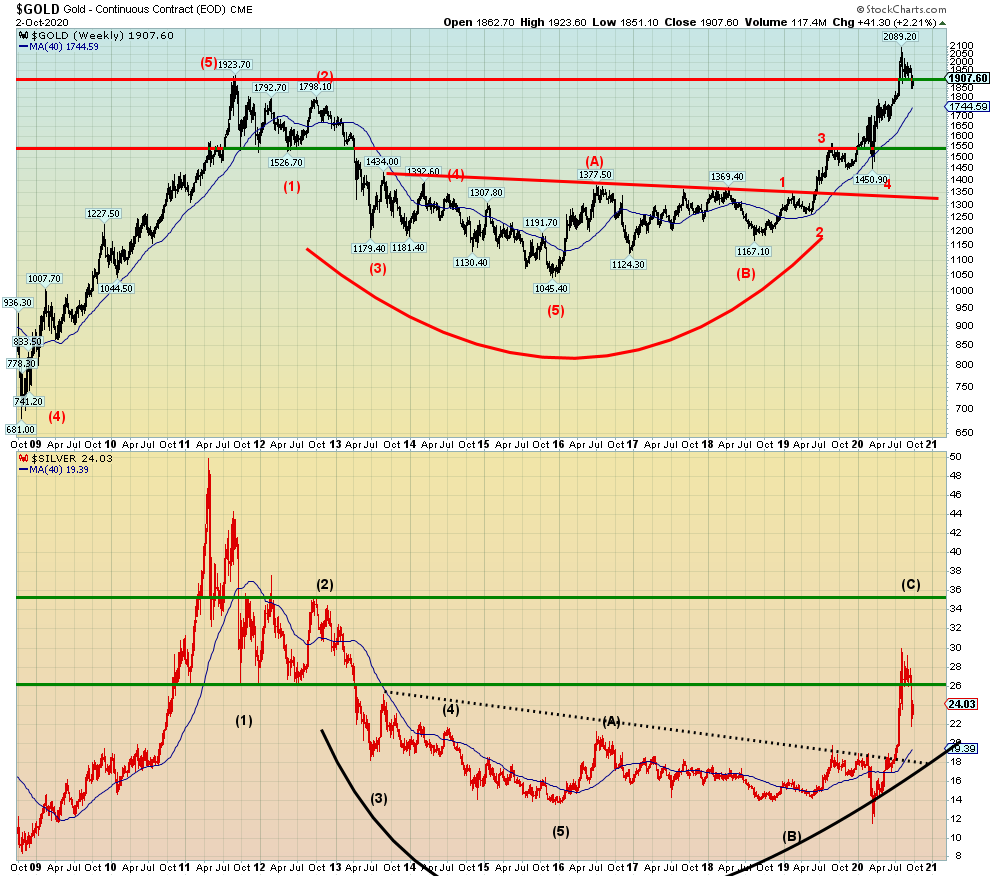
Gold prices rose this past week by 2.2% but remained within the confines of what appears to be forming descending wedge triangle. If that is correct, then the pattern is ultimately bullish but gold prices do not yet appear to be ready for a final low. Other metals prices also rose with silver up 4.1%, platinum gaining 5.9%, palladium up 4.6%, and copper up 0.3%. Usually declines within the confines of a descending wedge triangle unfold as five waves down ABCDE. We see a potential A, B, and C and we may be forming the D wave. A breakout above $1,950 now would suggest the triangle is breaking to the upside. But if we need more downside work, the zone might act as resistance and we fail near there. The bottom of the channel is currently down near $1,825. A break under $1,860 could easily send us down to those levels. If the pattern is correct, we should find a low sometime later this month. But we cannot rule a more serious correction just yet so a break now of $1,825 could send us tumbling towards long term 200-day MA support near $1,735. A breakout to the upside and especially taking out $2,000 and $2,040 could suggest a move to targets near $2,200. Bullish sentiment has fallen but it is not yet at levels that suggest a low. The RSI is still in the 40s and we’d prefer to see gold’s RSI below 30 to suggest a possible low. Our long-term prognosis remains bullish, but the short-term picture remains cloudy with more downside potential possible.
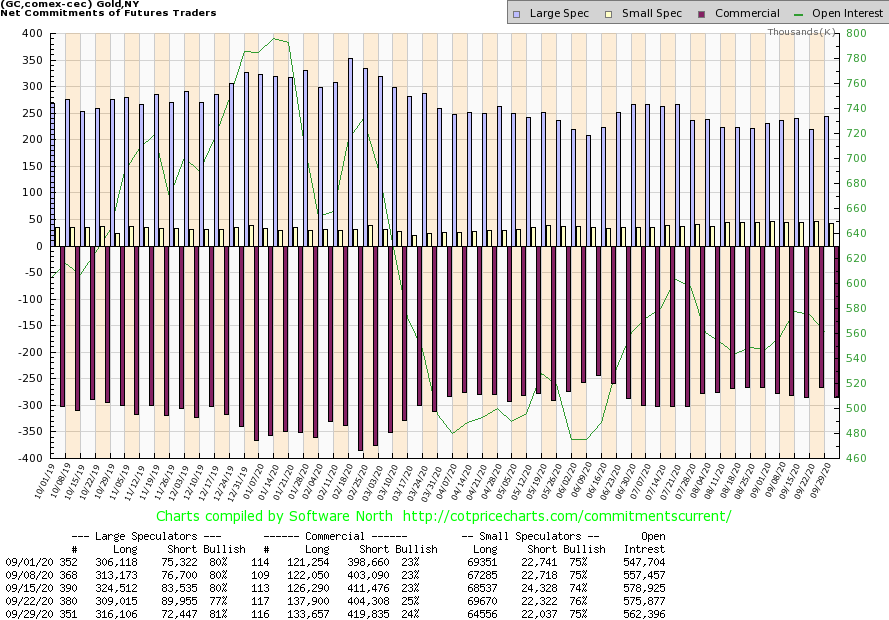
Source: www.cotpricecharts.com
The gold commercial COT slipped to 24% this past week from 25%, suggesting that we are not yet quite ready for a prime time rise for gold. Long open interest fell over 4,000 contracts while short open interest rose over 5,000 contracts. Overall, open interest fell on a week that gold prices rose. That’s mildly bearish as both open interest and prices should rise together in a bull market (in a bear market open interest rises as prices fall). The large speculators COT (hedge funds, managed futures, etc.) rose to 81% from 77%, suggesting they may be jumping the gun and getting too bullish too fast. Their long open interest rose roughly 7,000 contracts while short open interest fell over 17,000 contracts. This report is somewhat bearish.
Source: www.stockcharts.com
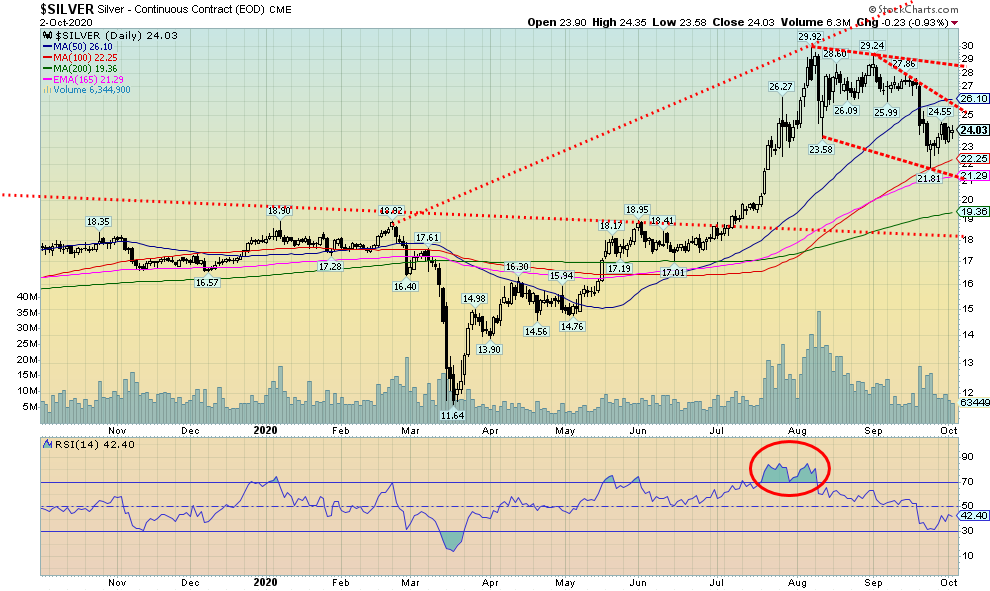
Silver prices continued this past within the confines of what looks like a forming descending wedge triangle. The bottom of the channel is down around $21 while a breakout above $26 might signal that silver is embarking on a new uptrend. We don’t want to read too much into the pattern just yet because even if it is a descending wedge it is still early. As long as we hold the bottom of the channel on any downswing, silver should remain good as we await a low. We suspect that one may not yet be in. Above $26, silver would need to break out above $28 to suggest a possible run to new highs above $29.92. Above $30, potential targets are up to $34/$35. Our major breakout line is down near $18 and in a severe correction we could test that breakout line before resuming the uptrend. But we like the look of the potential pattern forming so for now we’ll assume a descending wedge triangle is forming. Ultimately that is bullish, but a decline to near $21 and the bottom of the channel cannot be ruled out. Below that, the 200-day MA is near $19. With silver having broken out of a multi-year bottom pattern we don’t believe the rise is over in a mere six months. Ultimate targets could be well beyond $35, but right now we can only see up to that level as potential.
Source: www.cotpricecharts.com
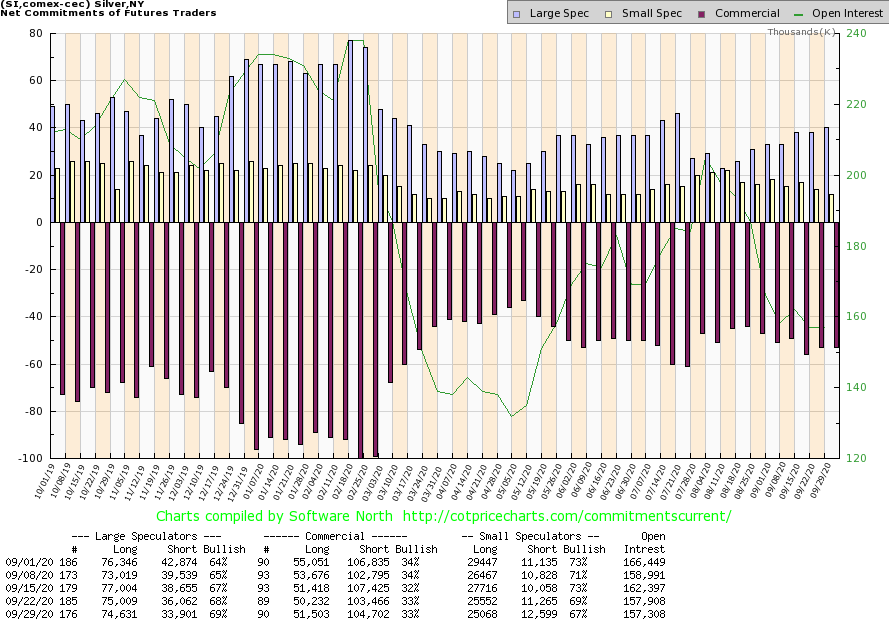
The silver commercial COT was unchanged this past week at 33%. There was little shift in the long and short open interest position with each up roughly 1,000 contracts. Total open interest was relatively flat on the week on a week that saw silver prices rise. The large speculators COT rose slightly to 69% from 68% as traders cut their short positions by around 2,000 contracts.
Source: www.stockcharts.com
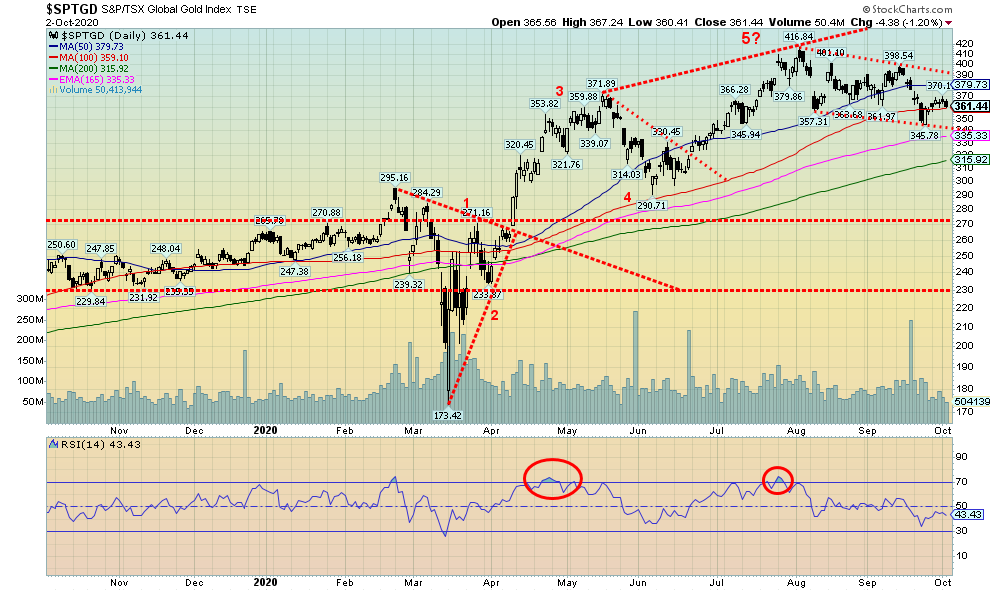
Gold stocks, as represented here by the TSX Gold Index (TGD), continue to trade in bear channel. The TGD managed to eke out a gain of 0.8% this past week as both gold and silver prices rose. The Gold Bugs Index (HUI) was up 1.4% on the week. That left both of them below their recent highs. The TGD Is off by 13.3% from its recent high. In looking back at the huge run-up in 2008–2011, we note that the TGD rose 300% but it did suffer two corrections of about 25% and one of 18% along the way. The TGD at its recent high was 240% above the March 2020 low, an impressive run. The TGD is in a relatively gentle sloping downtrend right now. But we should be wary of a breakdown under 340 as that could push the TGD into a new downswing. To the upside, the TGD needs to break out over 390 to suggest that new highs lie ahead. Longer term support can be seen down to 315 and the 200-day MA. During the 2008–2011 rise the TGD tested the 200-day MA a number of times, including on about three occasions breaking under for a short period of time. Since this rise started, we have yet to challenge the 200-day MA, so a test cannot be ruled out.
Source: www.finance.yahoo.com, www.ibma.org, www.stlouisfed.org, www.tradingeconomics.com, www.dailyfx.com, Jeff Clark@TheGoldAdvisor
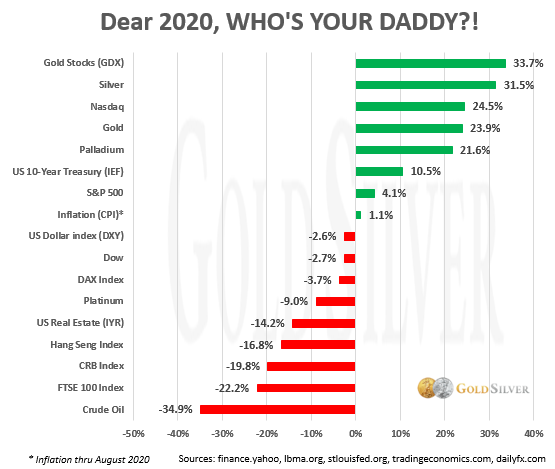
It seems that, so far in 2020, only the NASDAQ has been able to penetrate the top five performers. The other four are all in the precious metals category with the GDX (representing gold stocks) leading the way, followed by silver, gold, and palladium. No surprise that the worst performer in 2020 is oil. The chart excludes Bitcoin which would actually be at the top with a gain of 45% in 2020. But the crypto market remains small with a market cap of $337 billion compared to the gold stock market cap of over $500 billion. Still, we crack that Apple could buy the entire crypto and gold stock market and still have change left over. Crypto, unlike gold and silver, is virtual (you can’t touch it), can’t be used for much, and the sector is still riven with hacks and scams.
Source: www.stockcharts.com
Here is a long-term chart of both gold and silver dating back to the 2008 financial crisis low. After that low in October/November 2008, both gold and silver soared as the world embarked on huge liquidity injections (QE) to save us from the financial crisis. Initially, that benefitted gold and silver as gold soared to a record high over $1,900 and silver equalled its 1980 high of $50. But all of that changed in 2013 when both collapsed into multi-year lows, finally bottoming in 2015. Another rise was underway in 2016 but it wasn’t sustainable. Gold continued to outperform silver during that period. That proved to be a negative sign as both fell into lows in 2016 and again in 2018. Both finally broke through their major resistance that had been in place from 2013–2019, but only gold soared to new all-time highs. Silver has lagged terribly and hasn’t even taken out its 2012 high. This leaves silver still considerably undervalued compared to gold. However, the recent rise for gold and silver has seen silver lead and this past week the gold/silver ratio closed at 80.68 on September 30. We would have preferred to see it close under 80 although Friday’s close was at 79.39. That is down from a peak of 131.41 seen in March 2020.
Source: www.stockcharts.com
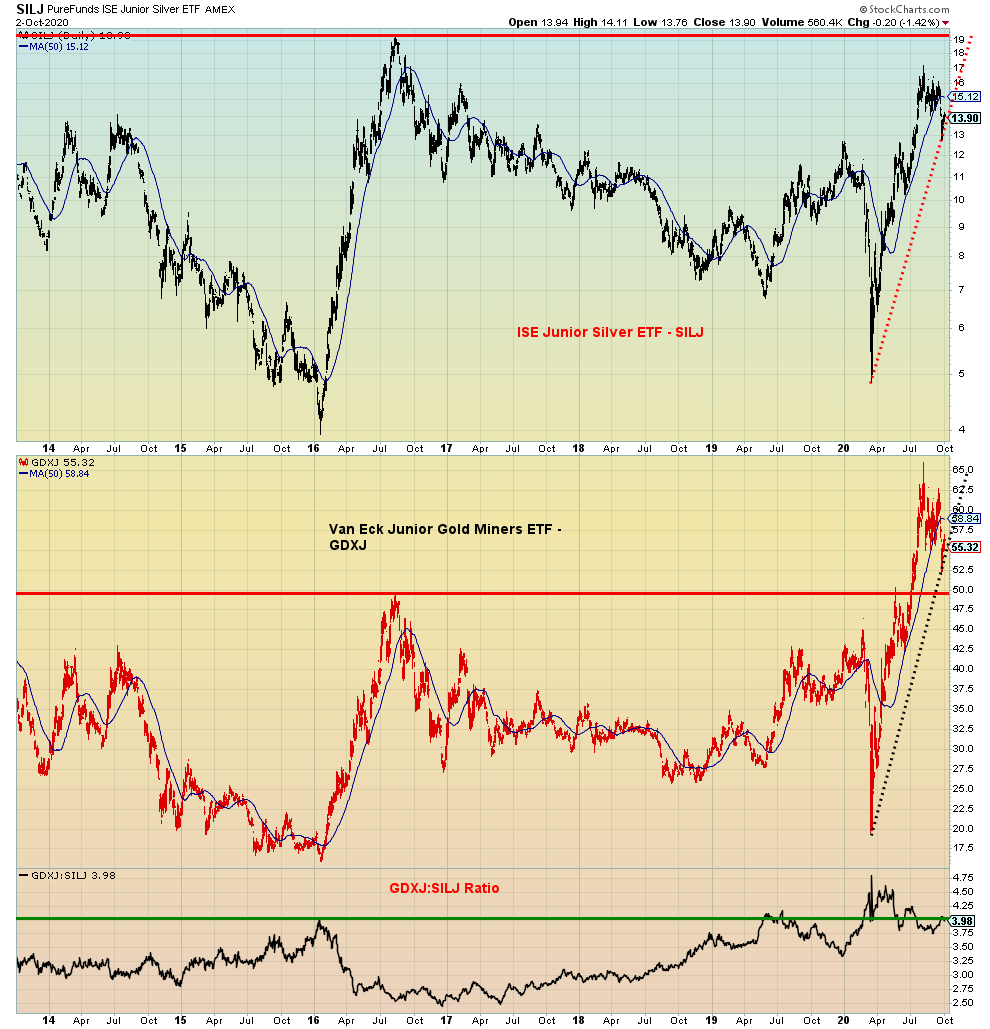
This is another way of looking at the gold/silver ratio. Above is the ISE Junior Silver ETF (SILJ) and the Van Eck Junior Gold Miners ETF (GDXJ). The GDXJ has soared to new highs above its 2016 high, while the SILJ has not. But more recently the GDXJ/SILJ ratio has begun to fall, suggesting that the SILJ is beginning to outperform the GDXJ. It has a long way to go to reach the lows seen during 2016–2018 when the SILJ was outperforming the GDXJ.
Source: www.stockcharts.com
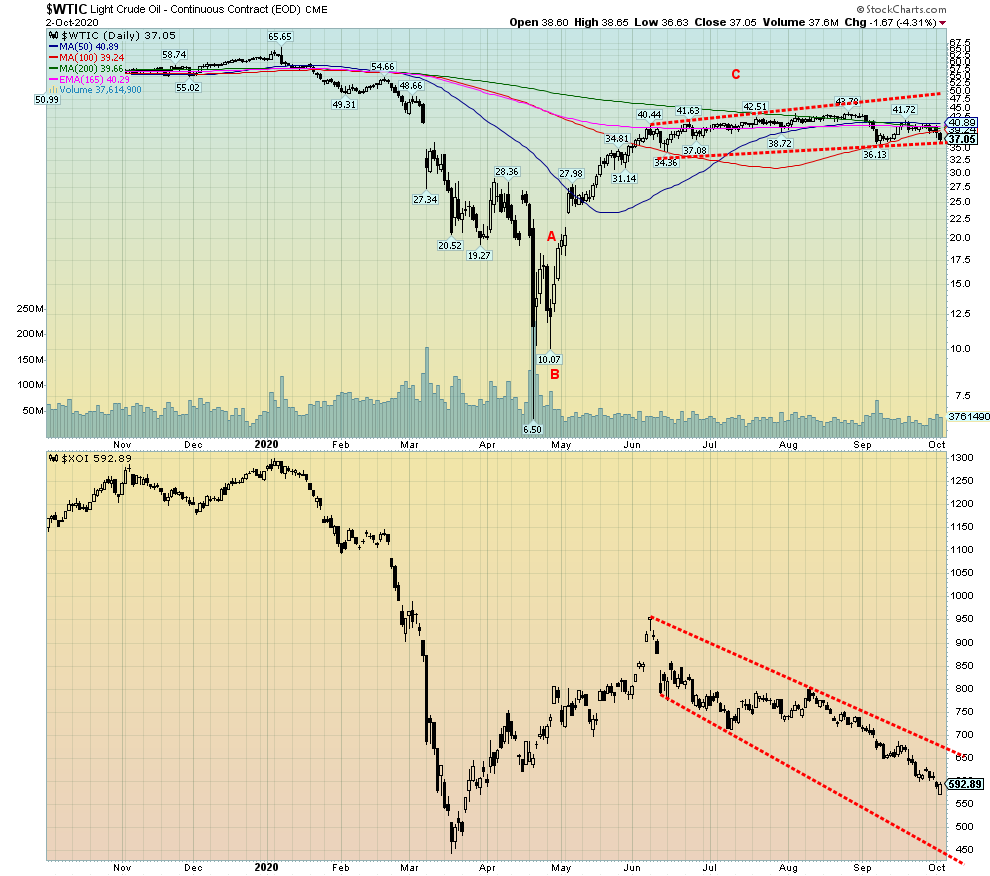
With both Donald and Melania Trump testing positive for COVID-19, oil prices effectively suffered a mini-crash, dropping $1.67 for WTI oil on Friday or 4.3%. On the week WTI oil fell $3.20 or 8.0%. That leaves WTI oil down 39.3% in 2020 even if the price is $30.55 off the low recorded in March 2020 as a panic was underway with the pandemic. Despite the drop, WTI oil remains within the confines of its recent trading range of $36–43. However, it might not take much now to push oil prices below that range. A breakdown now under $36.30 could suggest a swift decline to potential targets down to $26/$27. That would not make major producers in Saudi Arabia or Alberta very happy. Both need prices above $80 to think about balancing their budgets. The energy stocks could still be leading the way. The ARCA Oil & Gas Index (XOI) fell 3.3% this past week while the TSX Energy Index (TEN) was down 4.2%. Not even natural gas (NG) helped as NG fell down from its recent 52-week high, losing 13.2% this past week.
The oil companies continue to shed jobs with Royal Dutch Shell saying that 9,000 jobs will be cut and both Chevron and Exxon Mobil ready to announce job cuts as well. But there could well be a lot of jobs for cleanup. As producers fall into bankruptcy, they are leaving behind a high number of abandoned wells that need to be cleaned up. The trouble is, it is the taxpayer both in Canada and the U.S. that could be on the hook for cost of the cleanup, estimated to be in the billions as the companies responsible are—well, bankrupt. As far as jobs are concerned it is like good news-bad news.
Despite the drop in NG prices this past week, NG could do well into the winter as production cuts, coupled with increased demand in the winter, could boost prices to fresh highs once again. We wish we could say the same thing for oil prices. Both NG and oil face continued resistance to pipelines. Nonetheless, with oil prices poised to fall further, the focus will remain on oil, not NG.
Copyright David Chapman, 2020
|
GLOSSARY Trends Daily – Short-term trend (For swing traders) Weekly – Intermediate-term trend (For long-term trend followers) Monthly – Long-term secular trend (For long-term trend followers) Up – The trend is up. Down – The trend is down Neutral – Indicators are mostly neutral. A trend change might be in the offing. Weak – The trend is still up or down but it is weakening. It is also a sign that the trend might change. Topping – Indicators are suggesting that while the trend remains up there are considerable signs that suggest that the market is topping. Bottoming – Indicators are suggesting that while the trend is down there are considerable signs that suggest that the market is bottoming. |
About the author


Website: https://www.enrichedinvesting.com
Disclaimer: David Chapman is not a registered advisory service and is not an exempt market dealer (EMD) nor a licensed financial advisor. We do not and cannot give individualised market advice. David Chapman has worked in the financial industry for over 40 years including large financial corporations, banks, and investment dealers. The information in this newsletter is intended only for informational and educational purposes. It should not be considered a solicitation of an offer or sale of any security. The reader assumes all risk when trading in securities and David Chapman advises consulting a licensed professional financial advisor before proceeding with any trade or idea presented in this newsletter. David Chapman may own shares in companies mentioned in this newsletter. We share our ideas and opinions for informational and educational purposes only and expect the reader to perform due diligence before considering a position in any security. That includes consulting with your own licensed professional financial advisor.