
This past week saw the release of the U.S. inflation numbers. They were subdued but remain well above Fed targets. If the war heats up again, oil prices will rise (they did this past week) and inflation could tick higher again. Canada releases its inflation numbers this coming week.
The Japanese yen has become a hot topic. We take another look. The attempt to raise the yen was a coordinated intervention from the BOJ and the U.S. Treasury. Highly unusual. It was initially successful, but then the yen fell again. More intervention to come? This is highly unusual and a concern.
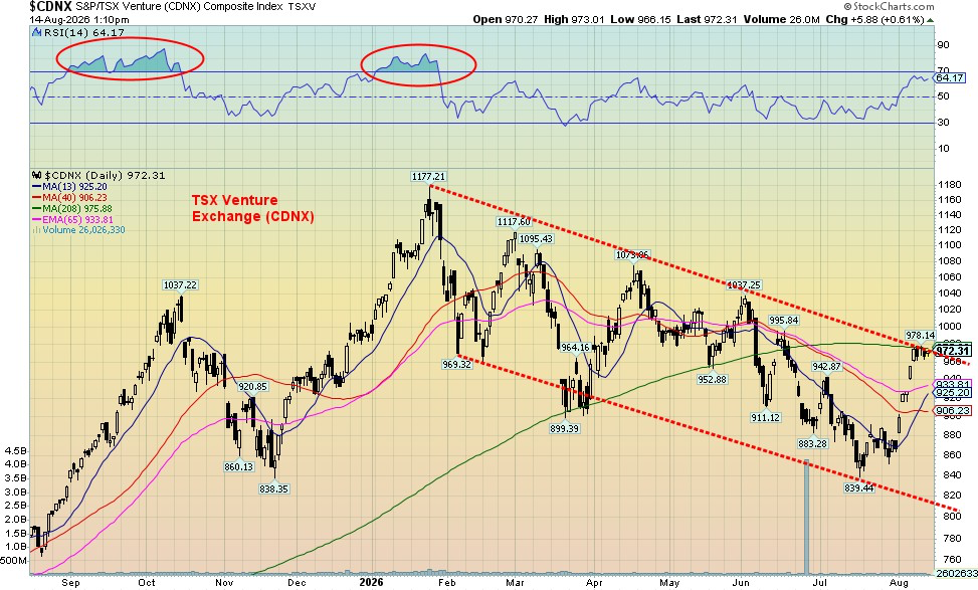
The TSX Venture Exchange (CDNX) has shown some life. But it remains well below the highs seen in 2008 and 2011. Recently, it has been consolidating again. But it may be poised to move higher soon. The CDNX is the topic of our chart of the week.
It was a quiet week in the markets. The S&P 500 made new all-time highs, but the others didn't follow. A divergence? Gold had some follow-through from the previous week. A positive sign. And once again tensions are flaring up in the Strait of Hormuz. As a result, oil prices jumped up again. This is likely to benefit oilfield service and product providers such as CES Energy Solutions Corp., which reported record revenue and strong free cash flow, pays a dividend, and is held in the Enriched Capital Conservative Growth Strategy.* Oil has become a football between the U.S. and Iran with the on-again, off-again war. Make no mistake; the war is on no matter how many times President Trump announces a deal is at hand. Note: it never is.
Summer is marching on. Enjoy it while you can. Have a great week.
DC
* Reference to the Enriched Capital Conservative Growth Strategy and its investments, celebrating an
8.5 - year history of 208% growth (annual 14.16%) strong alpha and top July ranking at www.emergingmanagers.ca, is added by Margaret Samuel, President, CEO and Portfolio Manager of Enriched Investing Incorporated, who can be reached at 416-203-3028 or msamuel@enrichedinvesting.com This information should not be construed as an offer, or a solicitation of an offer or sale of any security. Past performance does not guarantee future returns.
“Cargo shipping, cruising, mining, oil drilling, fishing – all these industrial activities could expand to the Arctic, one of the last remaining wild places, and with potentially devastating consequences.”
—Tatiana Schlossberg, American environmental journalist and author, wrote for The New York Times and others, author of Inconspicuous Consumption: The Environmental Impact You Don't Know You Have (2016); 1990–2025
“We aren't addicted to oil, but our cars are.”
—James Woolsey, American lawyer, served in numerous government positions, including director, Central Intelligence Agency (CIA) 1993–1995, undersecretary of the Navy, 1977–1979; 1941–2026
“The Iranians have shot down drones. They tried to destroy the Saudi oil fields. They tried to storm our embassy. So, when my Democratic friends say we need appeasement, well, appeasement hasn't worked. And I think that we've learned, with respect to Iran, that weakness invites the wolves.”
—John N. Kennedy, American politician and attorney, junior U.S. senator Louisiana, 2017, member Republican Party, Louisiana state treasurer 2000–2017; b. 1951
Inflation
This past week saw the release of the July inflation numbers. It was no surprise that they softened somewhat as the impact of “peace in our time” continued to dominate. Okay, maybe not “peace in our time” as the Strait of Hormuz remains closed, Iran continues to poke the U.S.’s eye, and Trump is desperate for an exit. Or maybe not.
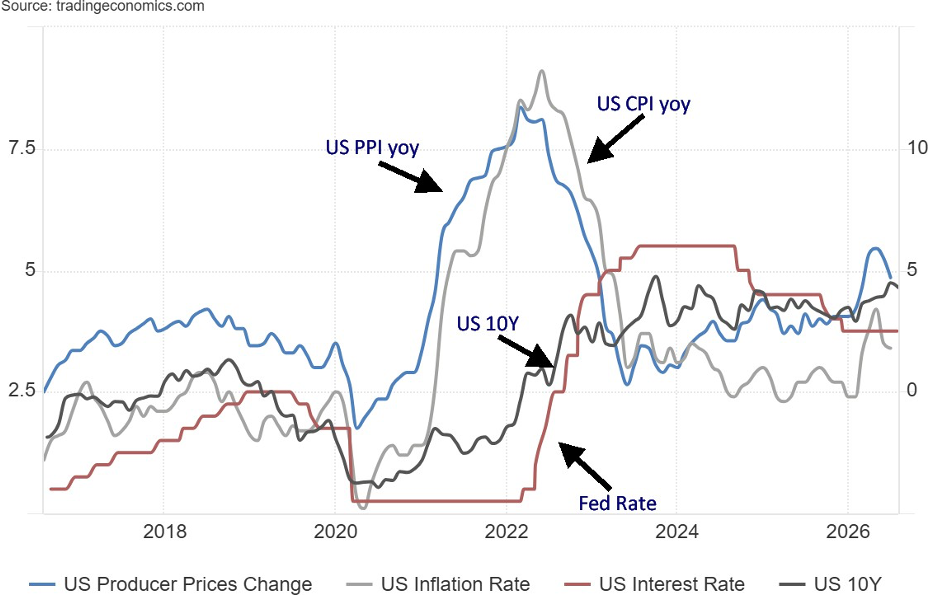
The July CPI (Consumer Price Index) was up 3.4%, a slowing from June’s 3.5%. It was, however, in line with expectations. The core inflation rate was 2.5%, down from June’s 2.6%. A softening all around. The July PPI (Producer Price Index) was 4.7%, the lowest since March 2026 – below June’s 5.5% and again largely as expected. The prime reason was an ongoing easing of oil prices as the U.S. continued to tout that a deal is at hand and the Strait of Hormuz will open. The reality is, no deal is at hand and the strait remains closed. Perception exceeds reality, it seems. Nonetheless, it worked: prices eased and inflation eased. Still, inflation remains well above the Fed’s target rate of 2%. For individual sectors, shelter inflation eased but food inflation was largely unchanged.
Inflation remains a problem in the U.S. If the Iran war starts up again, oil prices could spike further, putting more upward pressure on inflation. Higher oil prices run through the entire economy. Wages have struggled to keep up, except for the top 10% and especially for the 1%. But for others, not so much. The latest average wage growth to June 2026 grew 4.25% year over year. But during the period of inflation in 2022–2023, wages lagged inflation. Today, they are barely keeping their heads above the inflation rate. That’s on average, so not everyone benefits.
Stock markets roar, but most people are not in the stock market. The top 10% own some 88% of the stock market. About 60% own stock, primarily in a 401K (employer-sponsored retirement plan) or IRA (individual retirement account). The equivalent in Canada is the RRSP and TFSA. The U.S. inflation rate is also high compared to other G7 countries.
U.S. CPI, PPI, 10Y, Fed Rate 2016–2026
Source: www.tradingeconomics.com, www.bls.gov, www.federalreserve.gov
Inflation, or at least PPI, is above the Fed rate. The CPI remains below the Fed rate, allowing for a net positive return after inflation. The next table shows this comparison. Inflation has eased with the decline in oil prices over the past couple of months. However, it remains up sharply since the war with Iran got underway in late February 2026. Oil prices are still up some 45% from the pre-Iran war.
Fed Rate, CPI, PPI, U.S. 10-year Current Rates Compared
|
|
Reported rate August 2026 % |
Differential with Fed rate (basis points) |
|
Fed interest rate |
3.75% |
- |
|
CPI (July) |
3.40% |
(35) bp |
|
PPI (July) |
4.70% |
95 bp |
|
U.S. 10Y note yield |
4.65% |
90 bp |
Source: www.tradingeconomics.com, www.bls.gov, www.federalreserve.gov
The U.S. has the highest inflation rate in the G7. The U.S. 10-year bond yield is also higher than every G7 member except the U.K. The U.S. has the highest government debt of any G7 country. However, when comparing debt to GDP, Japan is the highest at 256.8%. All G7 countries are struggling with rising debt and rising debt to GDP. The Government of Canada has the most wiggle room when it comes to debt. When looking at various sources for Canada’s debt, it is always quoted as being made up of both federal debt plus provincial debt. Canada’s provinces are an important input, more so than the U.S. or other G7 countries because of their debt levels and their size and impact on the Canadian economy. Rising interest rates threaten these huge levels of debt, raising the potential for a sovereign debt crisis in a G7 nation.
U.S. Inflation, 10-year Bond Yield Compared with G7 Countries
|
G7 Country |
Inflation rate % |
Differential with U.S. rate % |
10-year rate % |
Differential with U.S. rate % |
Total government debt U.S.$ trillions |
Public debt to GDP % |
|
U.S. |
3.4% |
- |
4.67% |
- |
$39.9 |
123.2% |
|
Canada |
2.8% |
0.6% |
3.66% |
1.01% |
$3.0 ** |
126.7% ** |
|
Japan |
1.7% |
1.7% |
2.88% |
1.79% |
$11.4 |
256.8% |
|
U.K. |
2.6% |
0.8% |
5.02% |
0.35% |
$4.7 |
115.5% |
|
France |
2.1% |
1.3% |
4.02% |
0.65% |
$4.5 |
130.1% |
|
Germany |
2.8% |
0.6% |
3.19% |
1.48% |
$3.7 |
71.8% |
|
Italy |
2.9% |
0.5% |
3.99% |
0.68% |
$4.0 |
153.6% |
|
EU |
2.9% |
0.5% |
3.51% |
1.16% |
$17.8 |
87.8% |
Source: www.tradingeconomics.com, www.usdebtclock.org
- Red indicates that rates are lower than those in the U.S.
- ** Canada includes provincial debt for total government debt. Canada federal debt alone is US$1.5 trillion or 65.2% of GDP
Inflation is at least temporarily subdued, at least as long as the Iran/U.S. war remains on hold. Some Fed governors continue to call for a rate hike, putting Fed Chair Kevin Warsh in a bind, given the pressure from President Trump to lower rates. If the situation in the Middle East flares up again, sending oil prices soaring, then inflation pressures will only grow. Stagflation is also a possibility, given a weakening economy and continued high inflation rates.
Yen again
We have seen a growing number of articles recently outlining the problem of Japan’s rising inflation and its rising bond yields. Our Technical Scoop of August 10, 2026, outlined Japan’s situation in a series of eight charts that touched on the following: debt to GDP (highest in the G7), central bank balance sheets, the Japanese yen, inflation rates, central bank interest rates, 10-year bond yields, the Japanese stock market, and the population trap. We believe we are seeing a rise in the number of articles about Japan due to the growing recognition that Japan could pose a threat to the world economy.
This growing threat should not be underestimated. Japan has the highest debt to GDP of all G7 countries and even in the world, setting aside basket cases such as Sudan or Venezuela or even Ukraine, all of which are essentially bankrupt. Ukraine is kept on a lifeline from the EU (primarily), the IMF, and the U.S., even as Ukraine has defaulted on some debts. But a bankrupt Sudan does not pose a threat to the world economy. Japan, on the other hand, does.
For years, Japan kept interest rates artificially low as they struggled with their moribund economy, the result of the crash of 1990 that collapsed the Japanese stock market and its over-inflated property market. Since then, its corporations are kept on a lifeline from the Japanese government for fear that if they collapsed, Japan would collapse. Hence, the rise of “zombie” corporations.
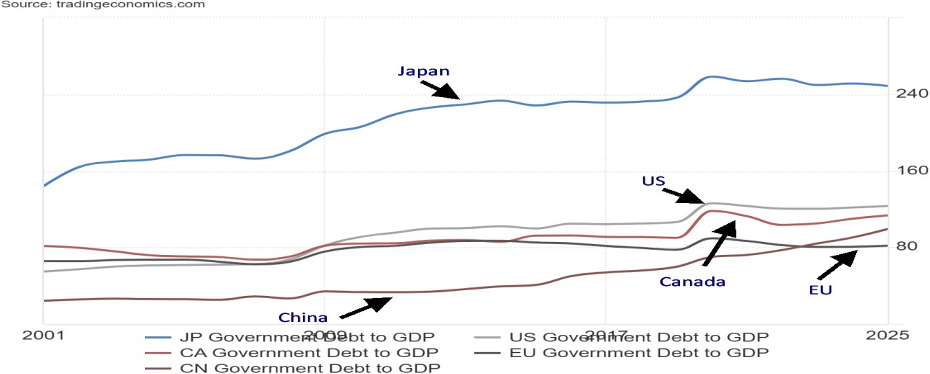
Japan has the third highest debt in the world, behind the U.S. and China. But when it comes to debt to GDP, Japan has no competitors. We note again Japan’s debt to GDP compared to others.
Debt to GDP Japan, US, Canada, EU and China 2001–2026
Source: www.tradingeconomics.com
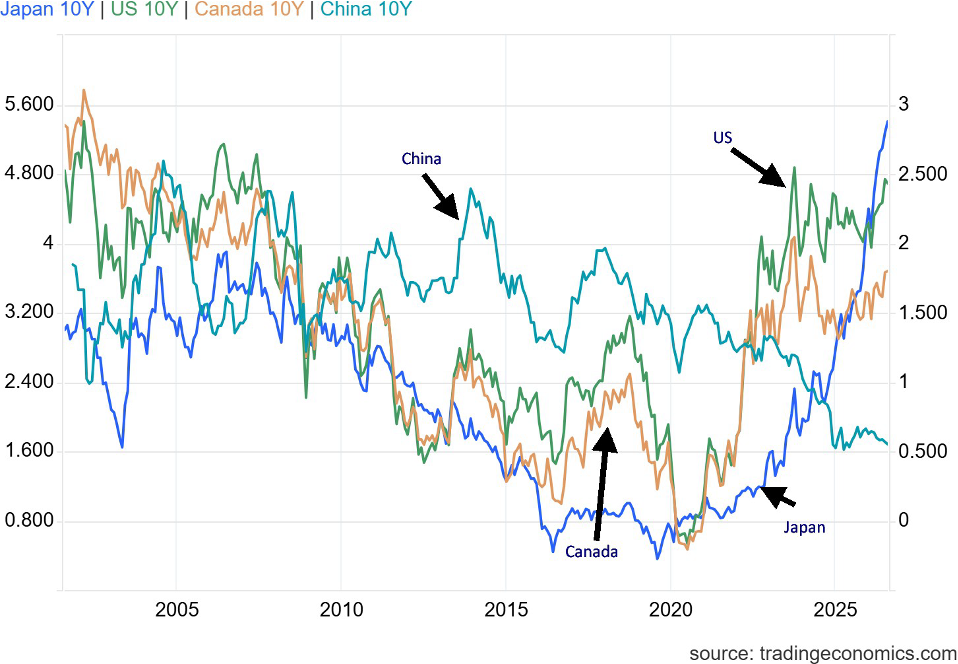
Rising debt, along with rising interest rates, is a two-edged sword. U.S. interest payments have already crossed $1 trillion annually, now exceeding what the U.S. pays for defense. Interest payments make up over 15% of the U.S.’s official budget. Japan’s interest payments, estimated at around $84–$86 billion, sound paltry compared to those of the U.S. But they make up a growing percentage of its budget, estimated at around 10.7%. It was estimated at only 7%–9% over the past decade. Every 1% rise in rates adds over ¥2 trillion to its debt-servicing costs. Add in rollover of debt plus growing need for social security because of a rapidly aging population along with a population that is declining and Japan is fast approaching a fiscal cliff.
10-Year Bond Yields, Japan, U.S., Canada, China 2001–2026
Source: www.tradingeconomics.com
Japan is the world’s largest foreign holder of U.S. debt. Currently, Japan holds $1.1 trillion of U.S. debt. That’s only 2.7% of the U.S.’s debt of $39.9 trillion. A year earlier, Japan also held $1.1 trillion of U.S. debt but then it was 3.1% of the U.S. debt. Japan’s share has been falling for years. China even more so as China was once the largest foreign holder of U.S. debt. The U.K. and others have picked up the slack along with the Federal Reserve. The Japanese yen has been falling. Back in 2011, US$1 bought roughly ¥75–¥80. Today, it buys US$1 = ¥159.
This is a problem as it makes Japanese imports very expensive. Japan imports nearly 100% of its oil, as an example. Most of that oil comes from only two countries: Saudi Arabia and the UAE. As oil prices rise (priced in US$) it costs Japan more, given a falling currency. The fear is that Japan will start selling off its U.S. treasuries to buy yen, putting further upward pressure on U.S. interest rates. As well, the long-profitable yen carry trade (borrow yen, sell for US$, then invest in U.S. treasuries or U.S. stock market at higher yields) will not only become unprofitable, but with a rising yen it costs even more because their U.S. dollars buy less yen.
Both the BOJ and the U.S. Treasury have intervened in the yen market in an effort to push it higher. The initial foray was successful, but as soon as they stopped, the yen fell again. Further intervention may be required. It is highly unusual for the U.S. Treasury to become involved. Normally, it is the Fed that gets involved, not the U.S. Treasury. Clearly, they are worried. And that in turn should make the world worry.
Chart of the week
Source: www.stockcharts.com
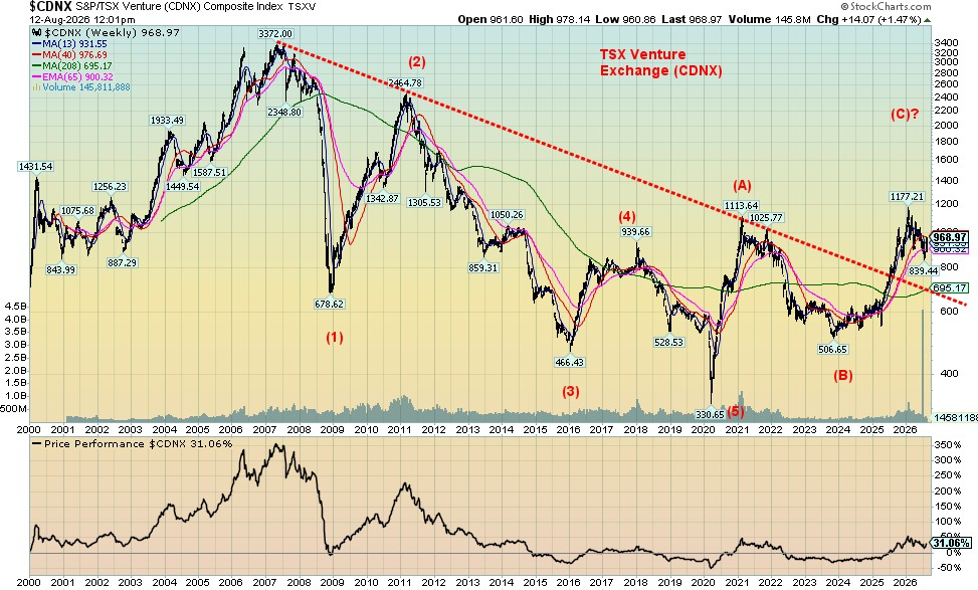
Since 2000, the TSX Venture Exchange (CDNX) has been a poor performer, returning only a paltry 31% or roughly 1.2% annually. By comparison, the TSX Composite has returned 379%, roughly 15% annually. Since 2008, the CDNX has been in a bear market with a strong bear market rally in 2009–2011 and a smaller one in 2016–2018. So far, the low has coincided with the COVID pandemic in 2020. The period 2020–2021 saw a good run-up as the CDNX gained 235%. However, the decline from 2008 to 2020 saw the CDNX lose 90%, a devastating loss.
The CDNX now seems to have come alive. With another pullback in 2021–2023 where the index lost almost 55%, we have now rebounded about 90%. Still, that leaves the CDNX down 71% from the 2008 high. Over 1,500 companies are listed on the CDNX, of which over half are mining stocks, predominantly gold mining. Some 40% of the world’s mining stocks are listed on the TSX and the CDNX. Unlike the TSX, there is not an index like the TSX 60. The TSX Exchange does provide a list of the TSX Venture 50 (www.tsx.com/venture50), a list of top stocks measured by share price change over the past year, trading volume value, and market capitalization change. It’s no surprise that most are mining stocks.
The CDNX has broken the long downtrend line from 2008, even as it is currently correcting the move from 2024 to 2026. The odds are good that the once this correction is over, we should embark on another up move. As we can see from the daily chart of the CDNX, we are threatening to break that downtrend line from the January 2026 high. The CDNX made a series of running gaps from the recent lows, suggesting we should break that downtrend line and target up to at least 1,060, probably higher. A move above 1,100 suggests new highs over the January 2026 high of 1,177.
Despite some excellent gains already recorded by many of the TSV50, a reminder that these stocks can gain even more during a strong up move. The daily chart shows that we appear poised to break out over the most recent correction and begin another move to the upside. The stocks on the CDNX are highly speculative, so investors should do their research accordingly.
Source: www.stockcharts.com
Markets and Trends
% Gains (Losses) Trends
|
|
Close Dec 31/25 |
Close Aug 14/26 |
Week |
YTD |
Daily (Short Term) |
Weekly (Intermediate) |
Monthly (Long Term) |
|
|
|
|
|
|
|
|
|
|
S&P 500 |
6,845.50 |
7,785.76 (new highs) * |
0.4% |
13.7% |
up |
up |
up |
|
Dow Jones Industrials |
48,063.29 |
53,732.41 |
(0.6)% |
11.8% |
up |
up |
up |
|
Dow Jones Transport |
17,357.19 |
21,792.39 |
1.3% |
25.5% |
neutral |
up |
up |
|
NASDAQ |
23,241.99 |
26,729.16 |
0.1% |
15.0% |
up |
up |
up |
|
S&P/TSX Composite |
31,712.76 |
36,730.27 (new highs) * |
1.0% |
15.8% |
up |
up |
up |
|
S&P/TSX Venture (CDNX) |
987.74 |
970.17 |
1.6% |
(1.8)% |
up |
neutral |
up |
|
S&P 600 (small) |
1,467.76 |
1,828.28 |
1.0% |
24.6% |
up |
up |
up |
|
ACWX MSCI World x US |
67.18 |
77.87 (new highs) * |
0.6% |
15.9% |
up |
up |
up |
|
Bitcoin |
87,576.98 |
62,886.89 |
(3.2)% |
(28.2)% |
down |
down |
neutral |
|
|
|
|
|
|
|
|
|
|
Gold Mining Stock Indices |
|
|
|
|
|
|
|
|
Gold Bugs Index (HUI) |
701.49 |
767.40 |
1.9% |
9.4% |
up |
neutral |
up |
|
TSX Gold Index (TGD) |
817.76 |
888.49 |
0.3% |
8.7% |
up |
neutral |
up |
|
|
|
|
|
|
|
|
|
|
Bonds% |
|
|
|
|
|
|
|
|
U.S. 10-Year Treasury Bond yield |
4.17% |
4.69% |
0.9% |
12.5% |
|
|
|
|
3.3Cdn. 10-Year Bond CGB yield |
3.44% |
3.68% |
1.1% |
7.0% |
|
|
|
|
Recession Watch Spreads |
|
|
|
|
|
|
|
|
U.S. 2-year 10-year Treasury spread |
0.69% |
0.51% |
15.9% |
(26.1)% |
|
|
|
|
Cdn 2-year 10-year CGB spread |
0.85% |
0.72% |
7.5% |
(15.3)% |
|
|
|
|
|
|
|
|
|
|
|
|
|
Currencies |
|
|
|
|
|
|
|
|
US$ Index |
98.26 |
99.65 |
0.1% |
1.4% |
down |
up (weak) |
down (weak) |
|
Canadian $ |
72.87 |
72.07 |
0.5% |
(1.1)% |
up |
down |
down |
|
Euro |
117.48 |
115.68 |
0.1% |
(1.5)% |
up |
down |
up |
|
Swiss Franc |
126.21 |
122.94 |
(0.7)% |
(2.6)% |
down |
up |
up |
|
British Pound |
134.78 |
135.35 |
0.3% |
0.4% |
up |
up |
up |
|
Japanese Yen |
63.83 |
62.75 |
(1.1)% |
(1.7)% |
up |
down (weak) |
down |
|
|
|
|
|
|
|
|
|
|
Precious Metals |
|
|
|
|
|
|
|
|
Gold |
4,311.97 |
4,373.52 |
0.8% |
1.4% |
up |
down (weak) |
up |
|
Silver |
71.16 |
64.70 |
1.9% |
(9.1)% |
up |
down (weak) |
up |
|
Platinum |
2,046.90 |
1,757.80 |
flat |
(14.2)% |
up |
down |
up |
|
|
|
|
|
|
|
|
|
|
Base Metals |
|
|
|
|
|
|
|
|
Palladium |
1,619.50 |
1,318.00 |
(4.6)% |
(18.6)% |
up |
down |
neutral |
|
Copper |
5.64 |
6.60 |
0.5% |
16.9% |
up |
up |
up |
|
|
|
|
|
|
|
|
|
|
Energy |
|
|
|
|
|
|
|
|
WTI Oil |
57.44 |
82.29 |
6.8% |
43.3% |
up |
neutral |
up (weak) |
|
Nat Gas |
3.71 |
2.72 |
1.9% |
(26.7)% |
down |
down |
down (weak) |
Source: www.stockcharts.com
* New All-Time Highs
Note: for an explanation of the trends, see the glossary at the end of this article. New highs/lows refer to new 52-week highs/lows and, in some cases, all-time highs.
Stocks
Source: www.stockcharts.com
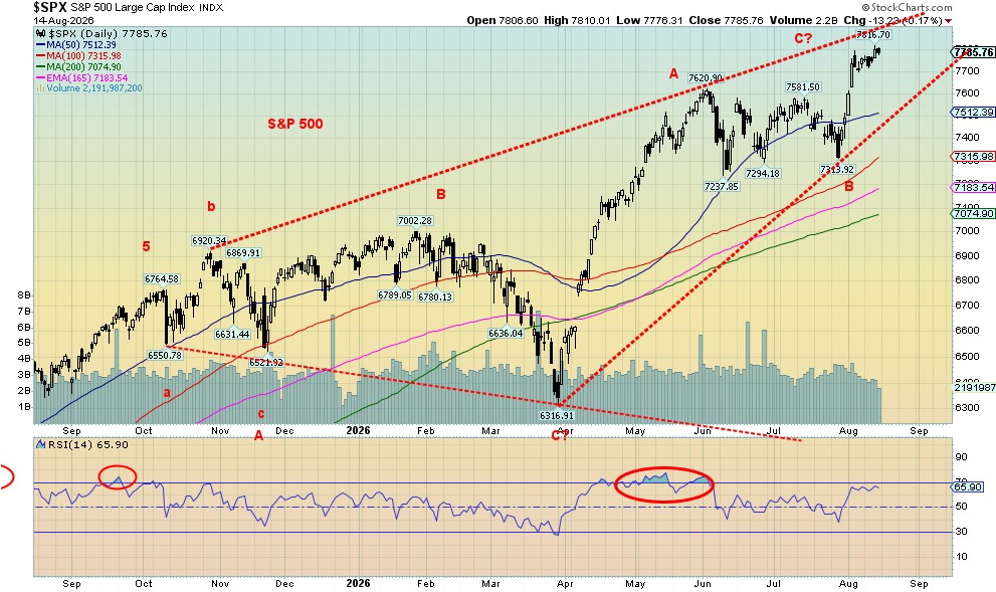
The records keep falling. Wall Street gets richer. The rest? Meh! We know momentum is fading, but until we bust points to the downside the trend remains up. The S&P 500 (SPX) made another record high, closing up 0.4% on the week. Then came the stumble. The Dow Jones Industrials (DJI) fell 0.6%, the Dow Jones Transportations (DJT) rose 1.3%, while the NASDAQ was up 0.1%, but none made new all-time highs. A divergence?
The S&P 400 (Mid) did make new all-time highs, up 1.1%, while the S&P 600 (Small) did not make new highs but gained 1.0%. The Mid is up 18.9% in 2026 while the Small is up 24.6% vs. the SPX up 13.7% but the DJI up only 11.8%. The S&P 500 Equal Weight Index did make new all-time highs, gaining 1.2%, and while the NY FANG Index made all-time highs it fell on the week by 0.4%. Bitcoin continues to meander of late, down 3.2% this past week. Maybe they didn’t like that recent hack that took some $140 million. The CNN Fear & Greed Index is registering greed.
In Canada, the TSX Composite continued its rise to new all-time highs, up 1.0%, while the TSX Venture Exchange (CDNX) gained 1.6%. In the EU, the London FTSE fell 1.4%, while the EuroNext was flat but made new all-time highs as did the German DAX, gaining 0.5%. The Paris CAC 40 was down 0.9%. In Asia, China’s Shanghai
Index (SSEC) fell 0.3%, the Tokyo Nikkei Dow (TKN) was up 4.7%, Hong Kong’s Hang Seng (HSI) fell 2.2%, and India’s Nifty Fifty fell 0.8%.
The MAG7 didn’t fare well this past week as five of the seven were down. MAGS fell 1.3%. Leading the way down was Amazon, off 4.3%. The big gainer on the week was Micron, up 10.7%, while the big loser was Broadcom, down 8.1%. To rub it in, Trump Media (DJT) fell 19%. Meanwhile, SpaceX continued its recent recovery, up 5.2% to $140, back over the IPO price of $135. The rebound has the look of a bear market rally. It won’t last.
Source: www.stockcharts.com
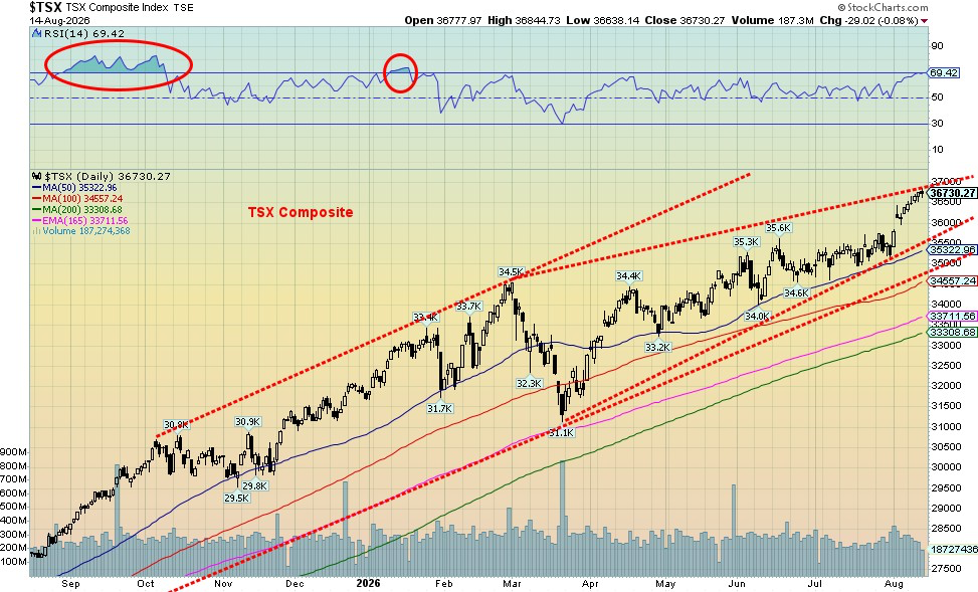
For Canada’s TSX, nine of the 14 sub-indices rose on the week led by Energy (TEN), up 6.2%. Losers were small with the biggest loser being Metals & Mining (TGM), down 1.5% despite Golds (TGD) gaining 0.3%. Both the TSX and the TSX 60 reached all-time highs, just.
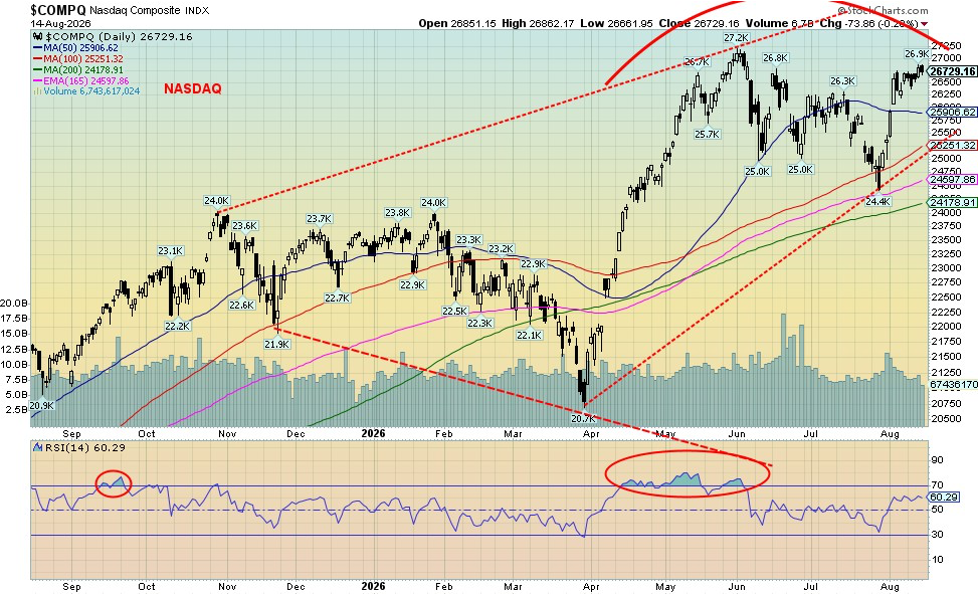
The S&P 500 is fast approaching the top of that channel, currently near 7,900. We could see that this week. But the fact that neither the DJI, DJT, nor the NASDAQ joined the SPX in making new highs this past week makes us wonder if that will shift to the downside this coming week. August/September remain the two weakest months of the year. October is noted more for its bottoms and crashes. The SPX breaks under 7,600 while the NASDAQ breaks under 25,000. For the still-rising TSX, the break comes to under 35,000. We are also at the top of a channel so we wonder if further gains will be limited.
The stock market is long in the tooth. Many have called for its demise, but it keeps chugging higher, even after a pullback. Eventually reality sets in. But the crack is, by that time the shorts will be bankrupt. Caveat emptor.
Source: www.stockcharts.com
Bonds
Source: www.tradingeconomics.com, www.home.treasury.gov, www.bankofcanada.ca
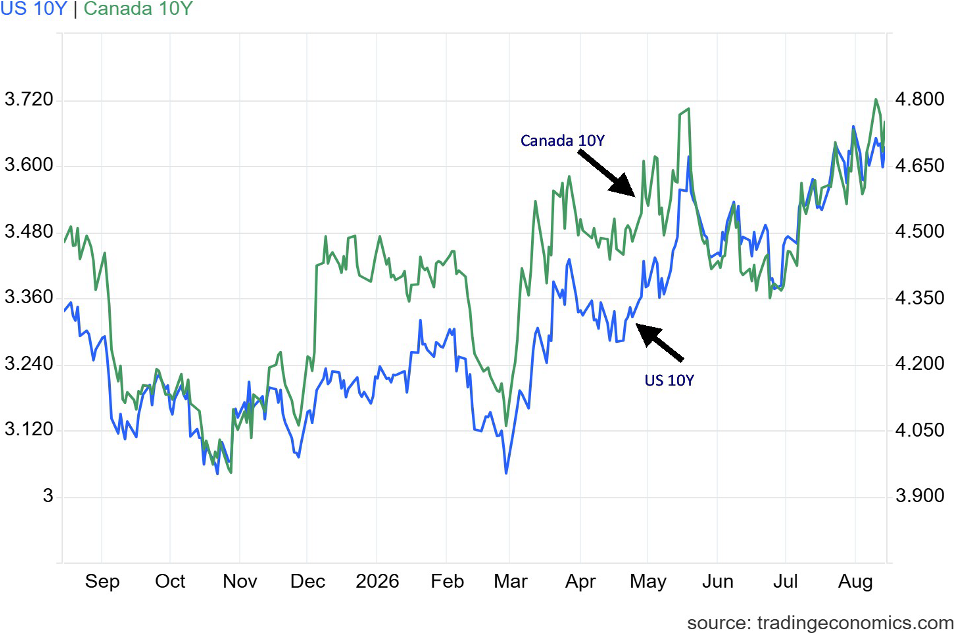
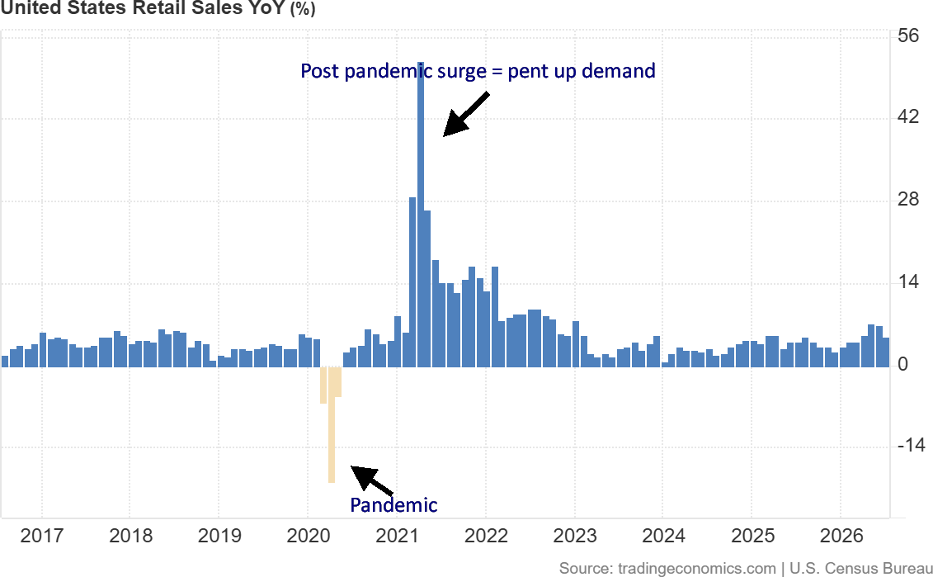
Despite easing inflation and weak retail sales, bond yields still rose this past week. The U.S. 10-year Treasury note rose to 4.69% from 4.65% the previous week. The closely watched 2-year Treasury note that more closely tracks the Fed was unchanged at 4.18% this past week. In Canada, the 10-year Government of Canada bond (CGB) rose to 3.68% from 3.64%. Rising rates are more closely following growing demand for money (i.e. AI data centers?) than the state of the economy. The 2–10 spreads rose again this week with the U.S. at 51 bp up from 44 bp and Canada at 72 bp up from 67 bp. A widening spread tells us that longer rates are rising faster than short rates. And also points to the potential for an official recession. We already have a two-tiered or K economy with the well-off (Wall Street/Bay Street) thriving as Main Street struggles.
The 30-year U.S. Treasury bond rose to 5.26%, the highest level seen since 2002. The U.S. can’t issue all its needs for funds at the short end of the curve. But locking in long rates is still popular and gives certainty for many issuers. Right now, the 10-year needs to fall back under 4.65%, but in reality, it needs to get under 4.35% to suggest lower yields. Otherwise, onward and upward?
Gold and silver
Source: www.stockcharts.com
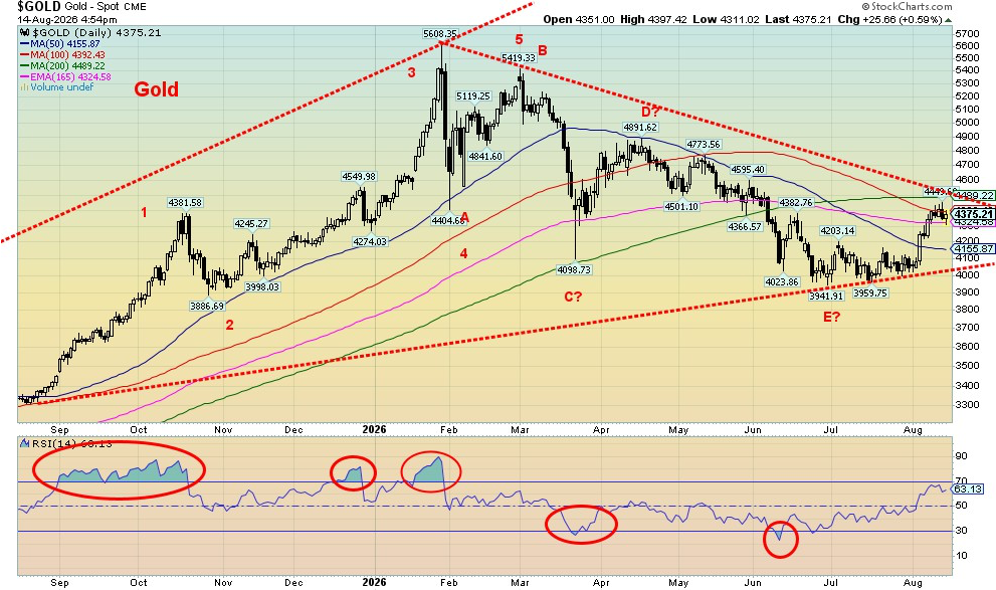
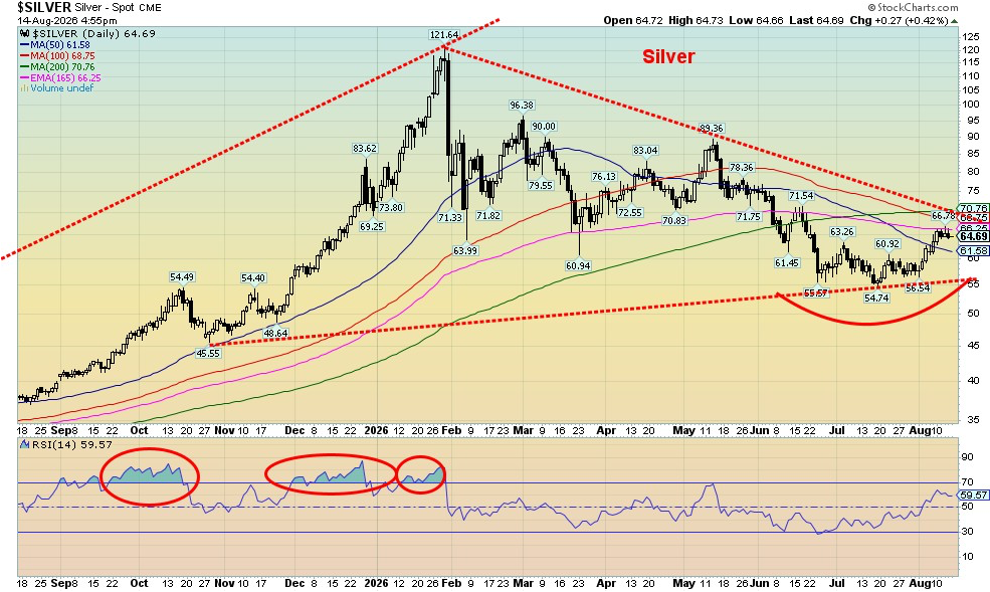
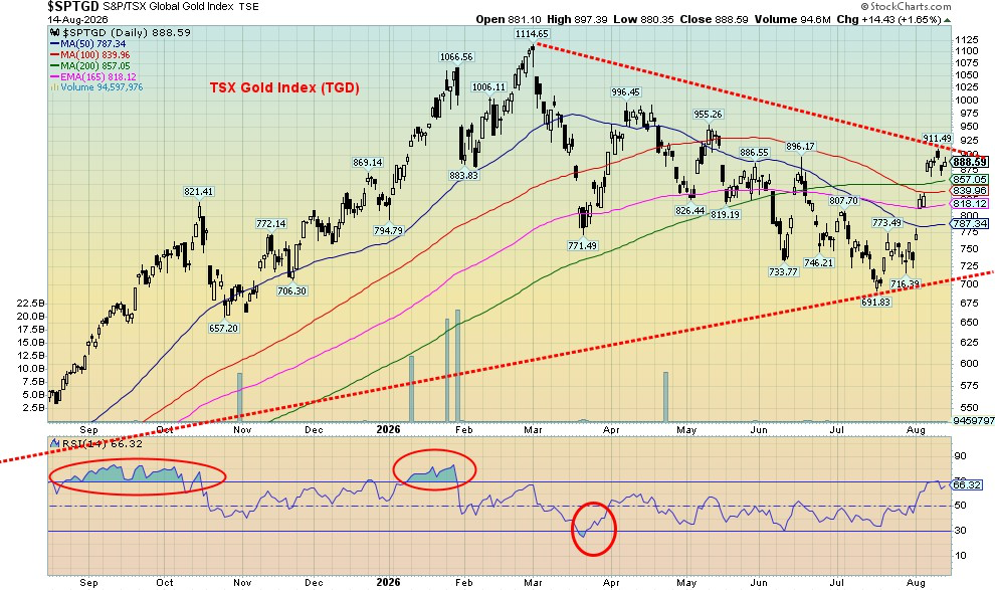
After a strong up week the previous week, gold prices consolidated this past week. Gold rose 0.8% this past week while silver was up 1.9%. Platinum was flat while palladium fell 4.6%. Copper continues to make all-time highs but closed off that high, up 0.5% on the week. The gold stocks continued their rally with the Gold Bugs Index (HUI) up 1.9% and the TSX Gold Index (TGD) gaining 0.3%. Nothing spectacular, but nonetheless there was follow-through to the upside. That’s a positive.
Debt, debt, debt. That’s a driver for gold. The U.S. debt is approaching $40 trillion. Given they are running annual deficits of roughly $2 trillion annually, it could only take another five years, and we’ll be at $50 trillion. Will global markets allow that to happen unheeded? Not likely. Central banks continue to raise gold reserves at the expense of adding U.S. debt. In June, central banks added 51 metric tonnes and in 2026 to date they’ve added 345 metric tonnes. But gold is under-owned by the public, making up only 3% of financial assets. Central banks are buying. The public doesn’t understand what is going on. They view it as a trade or a doomsday asset, not as a strategic core asset. India has the highest percentage of people owning gold. The North American public lags far behind. The largest minable reserves lie in Russia and Australia.
Technically, gold still awaits a breakout over $4,500 to suggest a move to the next level. A breakout over that level could suggest a target of over $6,000. Silver awaits a breakout over $70 and then targets could become as high as $136.
Source: www.stockcharts.com
The gold stocks appear to be leading. The Gold/HUI ratio has fallen from 6.8 in July to 5.7 last. The HUI is now up 9.4% in 2026, the TGD up 8.7%, while gold is up only 1.4%. Gold in Cdn$ is up 2.4% in 2026 as the Cdn$ has strengthened vis-à-vis the U.S. dollar. Silver is still down in 2026 by 9.1%. The big leader we’ve noted is copper, up 16.9% in 2026. Gold follows copper. The gold/silver ratio eased again this past week in favour of silver. The expectation is that silver and gold stocks lead gold (the metal).
We have entered a positive seasonal period for gold, and we appear to be rising on cue. This can last into late September or October before another pullback gets underway into December. Then follows the strongest period for gold into March. There are some crazy targets out there for gold. We tend to note them, but many appear to be pie in the sky. One step at a time. Let’s get over $4,500 first.
Source: www.stockcharts.com
Currencies were also subdued this past week. Weak retail sales hurt the US$ Index as it pulled back but still managed a 0.1% gain in the week. The Cdn$ rose 0.5% while the euro was up 0.1%. After a big bounce following BOJ and U.S. Treasury intervention, the Japanese yen fell 1.1% this past week. Is another intervention coming?
Oil and gas
Source: www.stockcharts.com
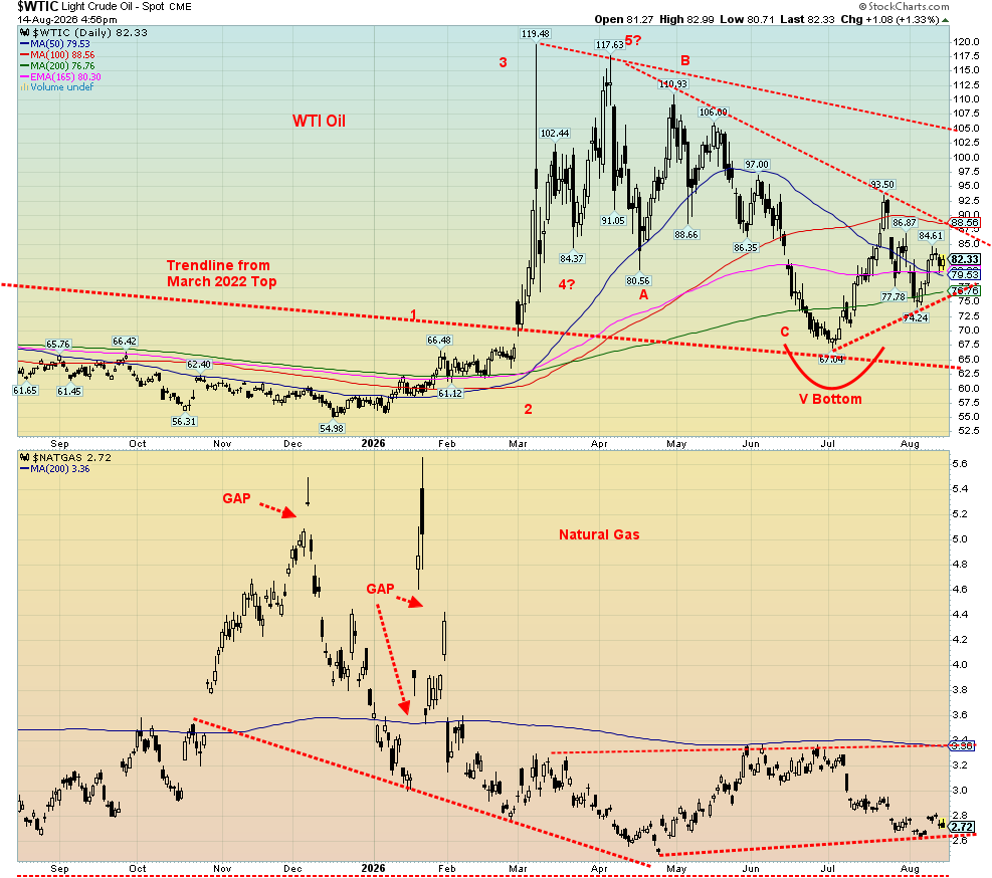
Up, down, up, down, up! Yes, that’s oil prices, thanks to the ongoing conflict between the U.S. and Iran. We’re nearly at an agreement. No, we’re not. We’re blocking the Strait of Hormuz. We’re bombing ships in the Strait of Hormuz.
The week before, oil prices fell. This past week oil prices rose. Next week? Who knows. One thing, however, remains clear. They are nowhere near a deal. Talks are stalled, on hold, whatever. And don’t dare try to sail through the strait as you will be bombed. Oh yes, and the U.S. wants to declare the Strait of Hormuz U.S. territory. Iran and international law have a different opinion.
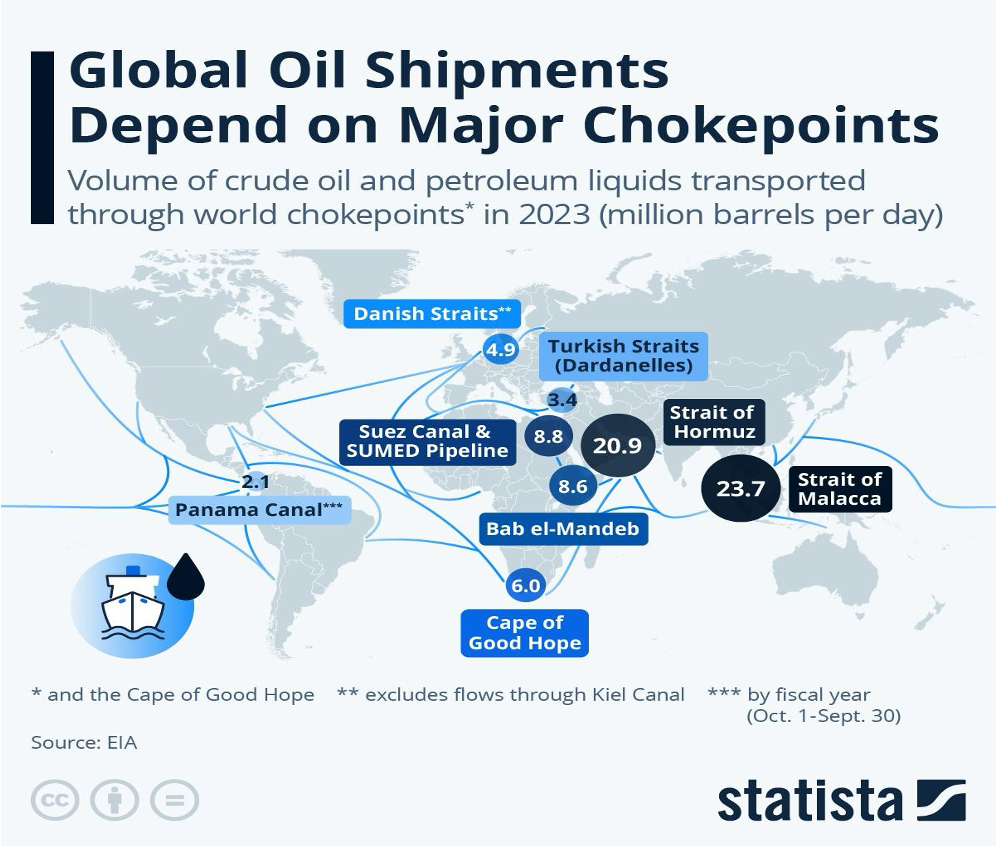
The Strait of Hormuz is not the only place where bombs are dropping. The Houthis of Yemen are now tying up the Saudis in the Red Sea and through the Strait of el-Mandeb. All we need is someone to block the Strait of Malacca and oil could really soar. Don’t rule it out. Here is a chart of the major chokepoints. The Strait of Hormuz is large, but the Strait of Malacca is even larger.
Source: www.statista.com
Through the Strait of Hormuz goes one quarter of the world’s oil supply and one-fifth of the world’s LNG trade. There are numerous other products going through the strait including fertilizers, industrial metals, and chemicals. The primary destination is Asia: China, Japan, South Korea, and India. Japan imports almost 100% of its energy needs.
Overlooked in all of this is the ongoing conflict between Ukraine and Russia. Sanctions, embargoes, and bombing of oil refineries all negatively impact what comes out of Russia, number two in the world in terms of oil production and number nine in terms of oil reserves. Russia also ranks number two in the world in natural gas production and first in reserves. Russian ships can traverse through the Black Sea, but then it’s another oil chokepoint through the Dardanelles (Turkey). Ukraine is already suffering there as their agriculture exports plummet, raising fears of a global food shortage. If Ukraine targets Russian oil refineries, Russia targets gas stations. There is also the Baltic Sea but then another chokepoint at the Danish Straits. Rounding out the chokepoints are the Suez Canal, the Cape of Good Hope (a long and expensive trip) and the almost inconsequential Panama Canal.
This past week, WTI oil rose 6.8%, Brent crude was up 7.8%, natural gas (NG) at the Henry Hub was up 1.9%, and NG at the EU Dutch Hub rose 11.8%. Stocks got excited as the ARCA Oil & Gas Index (XOI) reached all-time highs, up 9.7% while the TSX Energy Index (TEN) rose 6.2%. Technically, oil continues to appear to be busting higher but needs to break over $90 to move to the next level. We need to hold above $78. NG is still basing and needs to break out over $3.40.
The U.S. had a 17 million barrels’ boost to its strategic oil reserves, and the IEA is predicting another decline in demand. But they had little impact on prices as blockades dominate. If the attacks in the Strait of Hormuz continue along with the U.S. blockade, then Brent prices could soon be at $100 and climbing. But the one that catches our attention the most now is the Russia/Ukraine war and its potentially negative impact on oil prices. Everyone is too busy watching the U.S./Iran war.
There is little on the horizon suggesting this will end anytime soon. The war, despite its ceasefires, is now into its sixth month. We have a way to go to equal the long-running Afghanistan war that lasted 20 years (30 years if one counts the Soviet invasion that occurred before the U.S. invasion). It reminds us of the Thirty Years’ War (1618–1648) between the Holy Roman Empire Protestants and Catholics, which involved several countries including France and Spain.
Copyright David Chapman 2026
GLOSSARY
Trends
Daily – Short-term trend (For swing traders)
Weekly – Intermediate-term trend (For long-term trend followers)
Monthly – Long-term secular trend (For long-term trend followers)
Up – The trend is up.
Down – The trend is down
Neutral – Indicators are mostly neutral. A trend change might be in the offing.
Weak – The trend is still up or down but it is weakening. It is also a sign that the trend might change.
Topping – Indicators are suggesting that while the trend remains up there are considerable signs that suggest that the market is topping.
Bottoming – Indicators are suggesting that while the trend is down there are considerable signs that suggest that the market is bottoming.
Disclaimer David Chapman is not a registered advisory service and is not an exempt market dealer (EMD) nor a licensed financial advisor. He does not and cannot give individualised market advice. David Chapman has worked in the financial industry for over 40 years including large financial corporations, banks, and investment dealers. The information in this newsletter is intended only for informational and educational purposes. It should not be construed as an offer, a solicitation of an offer or sale of any security. Every effort is made to provide accurate and completeinformation. However, we cannot guarantee that there will be no errors. We make no claims, promises or guarantees about the accuracy, completeness, or adequacy of the contents of this commentary and expressly disclaim liability for errors and omissions in the contents of this commentary. David Chapman will always use his best efforts to ensure the accuracy and timeliness of all information. The reader assumes all risk when trading in securities and David Chapman advises consulting a licensed professional financial advisor or portfolio manager such as Enriched Investing Incorporated before proceeding with any trade or idea presented in this newsletter. David Chapman may own shares in companies mentioned in this newsletter.Before making an investment, prospective investors should review each security’s offering documents which summarize the objectives, fees, expenses and associated risks. Although Artificial Intelligence (AI) may be deployed from time to time, AI output is monitored and adjusted, if necessary, for accuracy. David Chapman shares his ideas and opinions for informational and educational purposes only and expects the reader to perform due diligence before considering a position in any security. That includes consulting with your own licensed professional financial advisor such as Enriched Investing Incorporated. Performance is not guaranteed, values change frequently, and past performance may not be repeated.
About the author


Website: https://www.enrichedinvesting.com
Disclaimer: David Chapman is not a registered advisory service and is not an exempt market dealer (EMD) nor a licensed financial advisor. We do not and cannot give individualised market advice. David Chapman has worked in the financial industry for over 40 years including large financial corporations, banks, and investment dealers. The information in this newsletter is intended only for informational and educational purposes. It should not be considered a solicitation of an offer or sale of any security. The reader assumes all risk when trading in securities and David Chapman advises consulting a licensed professional financial advisor before proceeding with any trade or idea presented in this newsletter. David Chapman may own shares in companies mentioned in this newsletter. We share our ideas and opinions for informational and educational purposes only and expect the reader to perform due diligence before considering a position in any security. That includes consulting with your own licensed professional financial advisor.