
5 Key Lessons from Warren Buffett
—American business magnate, investor, philanthropist, CEO of Berkshire Hathaway; b. 1930
- Don’t let world events affect your investing decisions
- Don’t feel bad when stocks go down
- Don’t think you have to be an expert to profit from stocks
- Don’t go for the quick profit
- Don’t put your money into Bitcoins (cryptos) for the long run
And we add a sixth also from Buffett
“Risk comes from not knowing what you are doing.”
“Chief among these headwinds is the rise of inequality that since 1970 has steadily directed an ever-larger share of the fruits of the American growth machine to the top of the income distribution.”
—Robert J. Gordon, American economist, The Stanley G. Harris Professor of Social Sciences at Northwestern University, from The Rise and Fall of American Growth: The U.S. Standard of Living Since the Civil War; b. 1940
“A nation which does not remember what it was yesterday does not know where it is today.”
—Robert E. Lee, Confederate general served the Confederate States of America during the U.S. Civil War 1861–1865; 1807–1870
No matter how one cuts it, the markets are off to their worst start since 1970. At that time the economy had been in a recession for some six months. Ironically, the markets did make their bottom around Memorial Day 1970. But that bear had actually started in 1968 and by the time it was over the S&P 500 had fallen some 36%. The current market topped on the first trading day of 2022 and hasn’t looked up since. If this is a typical bear market, then we are currently only about half-way through in terms of length and about half-way through in terms of the decline. But if this is a bear market like 2007–2009, then we are only about a third of the way along in terms of time and also in terms of the total decline.
The big question is, are we in a recession? Note that Q1 GDP fell an annualized 1.6%. The Federal Reserve Bank of Atlanta puts out a GDP model called GDPnow. It is anticipating a Q2 decline in GDP of 2.1%. That’s two consecutive quarters of declines, which fits the definition of a recession. The Atlanta Fed estimates usually work out quite well. On July 28, 2022 the Q2 first estimate will be released. We could already be in a recession since the beginning of the year. That it hasn’t registered in declining employment is not unusual as unemployment is a lagging indicator.
However, some argue that the Q1 decline and the anticipated Q2 decline is bogus because of the record trade deficits. With a rising U.S. dollar, imports have soared and with that the trade deficits have grown.
2022 Half-Year Scorecard: January–June 2022
|
Components |
% Gain/Loss |
Stocks have had their worst first half in more than 50 years. There has been little joy anywhere unless you were in energy stocks. Overall, commodities fared well but then the CRB Index is dominated by energy, representing 39.1% of the index. The CRB Index is up 25.7% in the first half of 2022. Precious metals are the smallest component, representing only 7.0% of the index. Natural gas (NG) has led the way up 58.6% to June 30, 2022. However, EU NG has soared an incredible 105% and is still rising as energy prices are starting to go vertical. Of the major stock indices, only China’s Shanghai Index (SSEC) finished the first half in the black. The TSX Venture Exchange (CDNX), down 34.3%, led the downward charge followed by the NASDAQ, down 28.9%. Bitcoin and the cryptos were major losers with Bitcoin down 58.0%. If it is any consolation, the S&P 500 still has a way to go to equal the loss seen in 2008 of 37.0%. But, as a reminder, the year is only half over. Of the precious metals, only palladium posted gains, up 1.4%. However, gold outperformed the major indices, down 1.5%, while the two major gold indices saw the Gold Bugs Index (HUI) lose 12.3% and the TSX Gold Index (TGD) off 10.3%. Compare that to the S&P 500 down 19.7% in the first half. Currencies were led by the US$ Index, up 9.8%, while the Japanese yen was a big loser, down 14.4%. Even bonds are down with the U.S. 10-year treasury note down 9.2% and the Canadian 10-year Government of Canada bond (CGB) off 10.9% (price before coupon – prices move inversely to yields). While not shown, of the TSX sub-indices Energy (TEN) was the major winner, up 39.8% while Health Care (THC) was the big loser, down 49.0%. Energy’s heavy weight in the TSX Composite helped to hold the TSX’s first half loss to 11.1%. |
|
Big Winners - Energy |
|
|
|
Natural Gas |
58.6% |
|
|
WTI Oil |
44.2% |
|
|
TSX Energy Index (TEN) |
39.8% |
|
|
ARCA Oil & Gas Index (XOI) |
29.1% |
|
|
|
|
|
|
Indices |
|
|
|
CRB Index |
25.7% |
|
|
Shanghai SSEC |
1.1% |
|
|
London FTSE |
2.9% |
|
|
TSX Gold Index (TGD) |
10.3% |
|
|
TSX Composite |
11.1% |
|
|
Gold Bugs Index (HUI) |
12.3% |
|
|
DJI |
14.4% |
|
|
Paris CAC 40 |
17.1% |
|
|
German DAX |
19.3% |
|
|
DJT |
19.4% |
|
|
S&P 500 |
19.7% |
|
|
MSCI World |
20.0% |
|
|
Wilshire 5000 |
21.6% |
|
|
NASDAQ |
28.9% |
|
|
NY FANG Index |
32.9% |
|
|
CDNX |
34.3% |
|
|
Bitcoin Index |
58.0% |
|
|
|
|
|
|
Commodities |
|
|
|
Palladium |
1.4% |
|
|
Gold |
1.5% |
|
|
Platinum |
9.8% |
|
|
Silver |
15.8% |
|
|
Copper |
19.4% |
|
|
|
|
|
|
Currencies |
|
|
|
US$ Index |
9.8% |
|
|
Cdn$ |
1.8% |
|
|
Swiss Franc |
5.1% |
|
|
Euro |
8.3% |
|
|
Pound Sterling |
10.7% |
|
|
Japanese Yen |
14.4% |
|
|
|
|
|
|
Bonds |
|
|
|
US 10-Year (UST) |
9.2% |
|
|
Cdn 10-Year (CGB) |
10.9% |
Source: www.stockcharts.com
The authority with the definition of recession usually lies with the National Bureau of Economic Research (NBER), a private organization. NBER bases its decision on calling a recession on a number of indicators. Those include employment (up on average 488 thousand jobs/month in 2022) while other indicators such as industrial production, business service activity, and more remain positive. So, while numerous economists are calling for a recession and are indicating we could already be in one, the call that we are in a recession lies with the NBER. They have not yet called a recession. The belief is that an official recession won’t be here until before 2023. However, regardless of NBER’s definition of a recession, the stock market, which is a leading indicator, appears to be predicting a recession. Stock market declines before a recession are normal. The stock market may have been falling for a few months before a recession was officially recognized. As noted earlier, the market was already falling since 1968 before a recession was recognized. The stock market is an early predictor.
Source: www.stockcharts.com
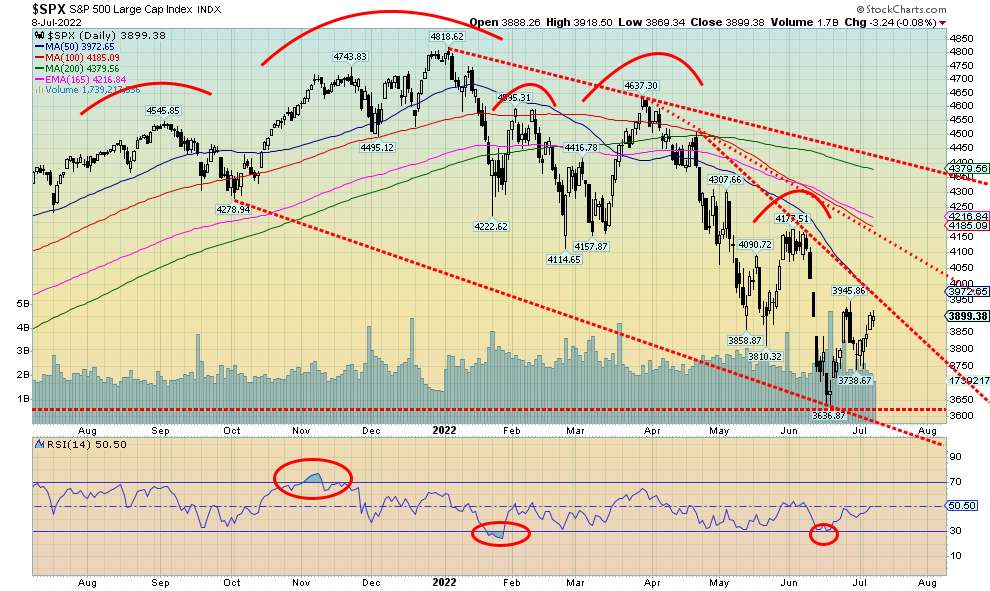
Our chart of the S&P 500 shows that the index could be forming a huge descending wedge triangle. If that is correct, then a firm break above 3,950 on a close basis could propel the index up to that key downtrend line and the 200-DMA, currently near 4,375. That’s an additional 12% from current levels. It would also be a 20% gain from the June low. A rally of that magnitude would be in line with previous bear market rallies seen in 2001–2002 and 2007–2009. We also like the fact that the recent pullback did not result in new lows. However, to confirm that, we must take out that recent high 3,945.
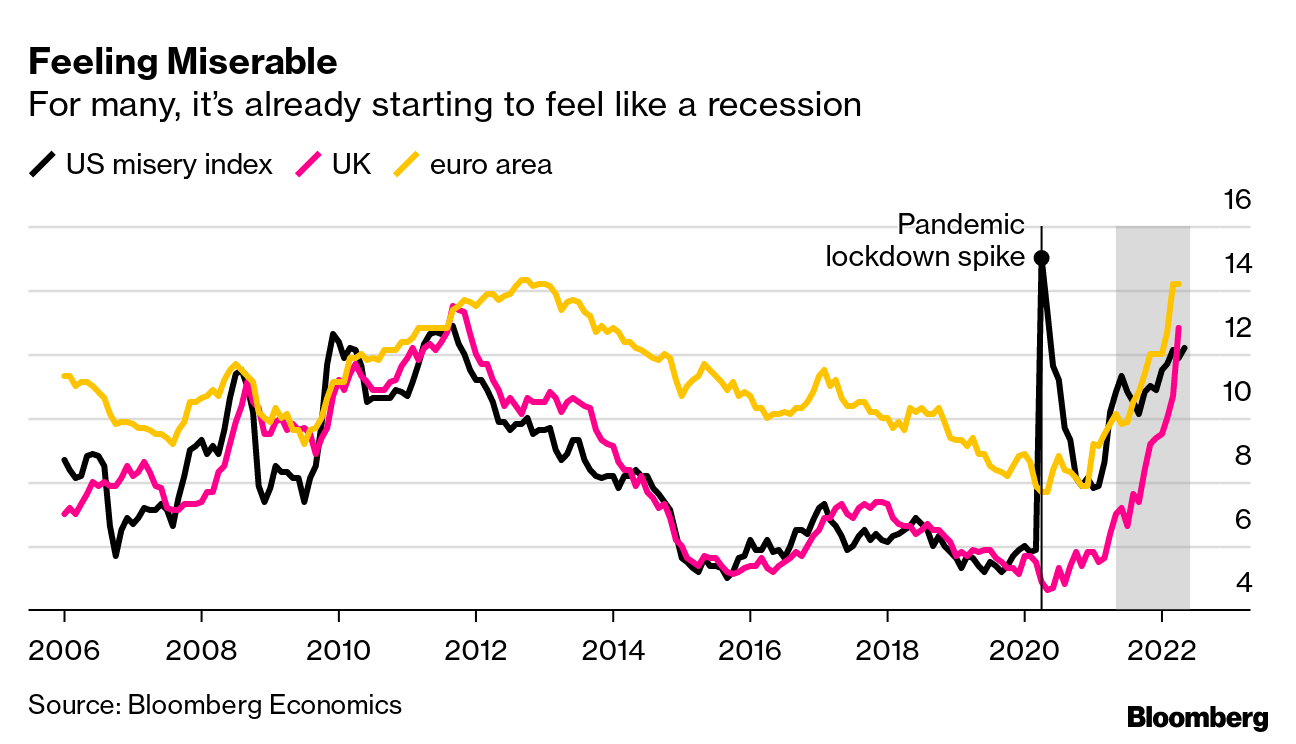
Many believe we are already in a recession. The yield curve is narrowing, pointing to one. But that’s a leading indicator, usually bottoming up to six months before an actual recession. Consumer sentiment, as measured by the Michigan Consumer Sentiment Index, is as low as it was during the early 1980s recession, and we are not even in an official recession. The Misery Index has been on the rise in the U.S., the UK, and the EU. It is at levels last seen briefly in the March 2020 pandemic spike and, more importantly, at levels last seen during the Great Recession through to the EU debt crisis in 2008–2012. And an official recession hasn’t even been announced. The Fed has already indicated that threats of a recession are not going to stop them from their probable July rate hike of 75 bp and another 50 bp in September. But add in the high inflation, high energy prices, and chaos at airports, and the Misery Index is rising.
Source: www.bloomberg.com/economics
Despite the sharp gains for energy in the first half of the year, oil, natural gas, and the energy stocks all hit the skids when July opened. One of the prime drivers of sharply higher oil prices in the first half of the year was a combination of supply issues but, more importantly, sanctions on Russia. Back in December 2021 WTI oil traded as low as $62.43. By the time Russia invaded Ukraine on February 24, 2022 WTI oil had climbed to $92.80, thanks to the threat of invasion and already growing sanctions. But it’s not just oil that soared—agricultural products also soared because upwards of 30% of the world’s wheat supply was threatened. That is what Russia and Ukraine produce. Much of it is now either blocked from shipping or sanctions have negatively impacted shipping. As well, drought and the war have resulted in a lot less being planted.
However, sanctions threaten to backfire as higher oil prices have helped spark the highest inflation since the 1970s. A number of Middle Eastern and African countries are facing food shortages and food riots. Worse, they are also facing rising drought and famine conditions that could threaten tens of millions. Those regions are major recipients of Russian and Ukrainian wheat and other agricultural products. The spark for the sharp drop in oil prices the first week of July was fear of recession but, more importantly, the advancement of a new strategy meant to hurt Russia in the form of a price-cap on Russian oil. This is being led by the U.S. and the G7. The desire is to cut off Russia’s capability to profit from high oil prices. Oil prices crashed $9 on July 5, 2022.
It is also hoped that this strategy might help the world avoid a global recession. But the strategy could backfire big-time. Russia might retaliate by instead pulling supply off the market. Why would they do that? To hurt the West. Some have calculated that if Russia withdrew just three million barrels a day, oil prices could spike to $190. Remove five million bpd and oil goes to $380.
Seems that the G7 would like to set the cap for Russian oil at roughly half of today’s prices. Russia has already warned G7 nation Japan that if this happened Russia would cut off all oil and gas to Japan. As well, Russia would seize control of the Sakalin-2 LNG project, which is jointly owned by Russia and Japan. Japanese companies Mitsui and Mitsubishi could stand to lose their share of 12.5% and 10% respectively. Combine that with a threat that Russia could deliberately pull supply off the market and, instead of falling oil prices, we could be faced with sharply higher oil prices.
Source: www.stockcharts.com
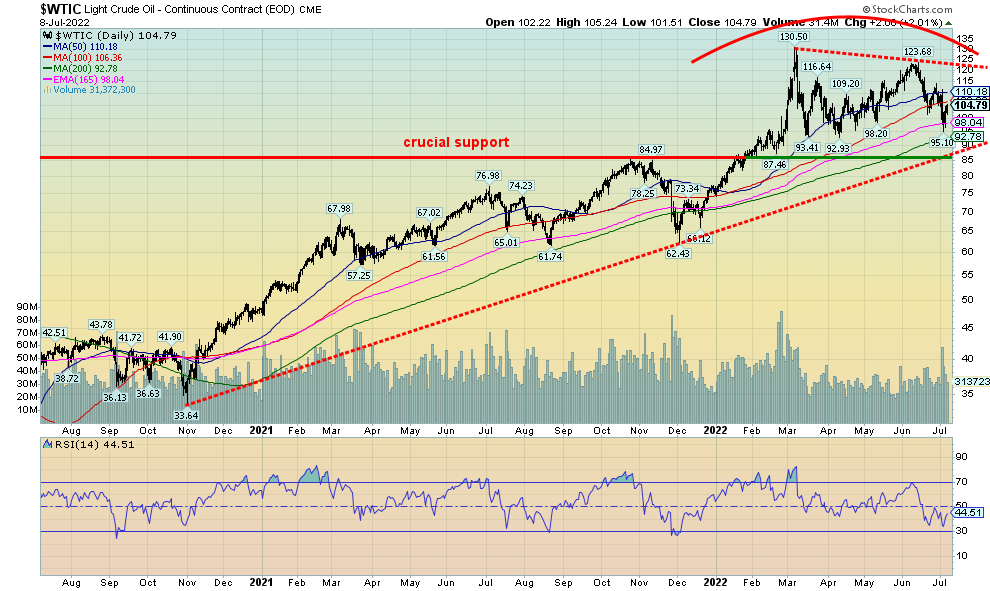
Oil prices rebounded at the week’s end, thanks to the perception of a robust jobs report for June and proclamations that a recession is not “inevitable.” If WTI oil can regain back above $115, then the odds favour another possible assault on the high at $130. Oil has considerable support down to around $95, but below that a more substantial decline could get underway. Oil stocks, as measured by the ARCA Oil & Gas Index (XOI) and the TSX Energy Index (TEN), fell hard this past week, down 3.6% and 4.9% respectively. They have also broken trend line support. So, it is possible they may go through further corrective action and not follow oil higher with much vigour. Natural gas (NG) prices did rebound this past week, up 5.2%. In the EU they just keep going higher.
The U.S. dollar has soared as a result of higher interest rates in the U.S., reluctance on the part of Japan to hike interest rates, and the EU doing so only grudgingly. Add in the war in Ukraine plus sanctions on Russia and the U.S. dollar has become the default currency of choice as funds have fled from the EU, Japan, and China to the U.S. dollar. Paper money as a store of value? Gold and silver are a store of value. Stocks and cryptos are speculation. Paper money is a devaluing asset, even if the U.S. dollar is temporally rising.
A rising U.S. dollar is causing problems. We haven’t got an exact number, but an estimate is there is at least $24 trillion of U.S. dollar-denominated debt issued by foreign countries and corporations out there. Since their earnings are in the home currency, the U.S. debt they owe just got larger. Major borrowers are in China, Saudi Arabia, Indonesia, and Israel but numerous emerging market countries have borrowed in U.S. dollars. One, Sri Lanka, has now defaulted. Sri Lanka is also facing hyperinflation as a result of a loss of confidence in the government. Riots have become normal.
A high U.S. dollar is also hurting commodities as not only has oil fallen but gold, silver, platinum, and copper have also taken a hit. This is a natural fallout of a rising U.S. dollar as all commodities are ultimately priced in U.S. dollars. The euro is falling fast and could soon be at par to the U.S. dollar. A drop below par would not be a surprise. Meanwhile China and Russia continue their quest to create alternative payment systems to SWIFT and ensure a shift away from the U.S. dollar to challenge U.S. dollar global hegemony. Already China is dealing with a number of nations exclusively in yuan while Russia has insisted on payment for its oil and gas in rubles. Unlike other countries we can think of that challenged U.S. dollar supremacy (Iraq, Libya, Syria, Iran) the U.S. cannot easily invade China and Russia to effect regime change. However, it is a stated aim of the U.S. to weaken Russia by assisting Ukraine in its war with Russia by supplying them arms and providing other strategic services without risking a clash between U.S. and Russian troops.
Chart of the US$ Index
Source: www.stockcharts.com
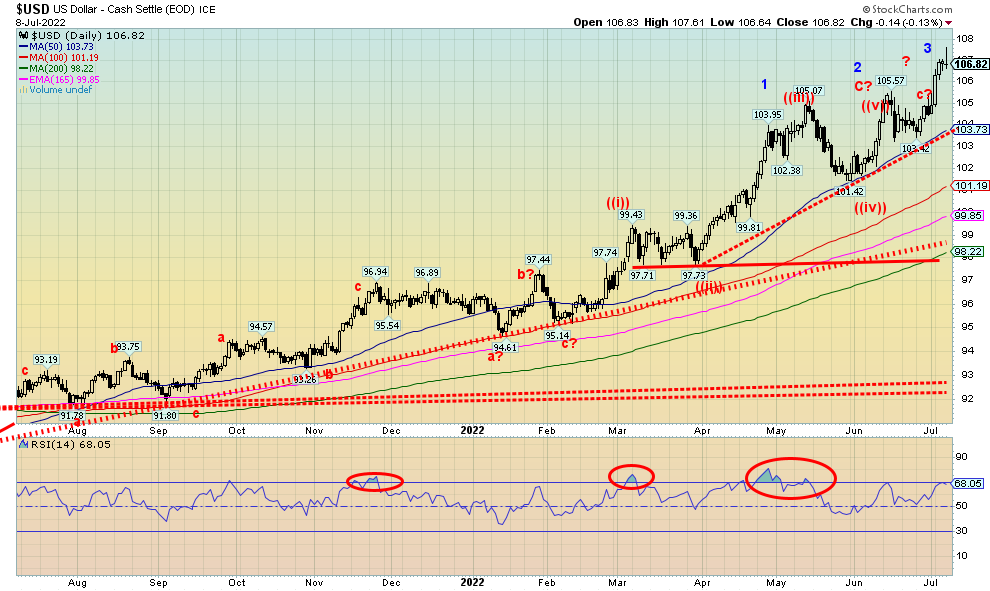
Friday’s action in the US$ Index saw it once again spike to new highs for this move. However, by market close the US$ Index had slid back marginally lower on the day. This could be the sign of a top; however, further downside action would need to be seen this coming week. One thing we like about the chart is what we see as “three thrusts to a top.” We’ve seen this pattern in the past and the result was usually a downside move that followed. Obviously, a break of the uptrend line currently near 103.75 is needed to confirm any breakdown. New highs would not necessarily invalidate the pattern but it would be better that we do not see new highs. However, a move back above 108 would most likely start to invalidate the pattern.
With gold and silver falling largely because of the sharp rise in the US$ Index plus fear of higher interest rates, this gives some credence to our thoughts that we have entered into the potential period for the 7.83-year cycle low and the 23.5-year cycle low. Some have even mused that a capitulation event could happen to take us there. That could translate into a collapse similar to what we saw in April 2013. The timing might be within the time frame of the 31-month cycle low that was last seen, we believe, in March 2021 at $1,673.
Timing of the pending cycle low, based on the March 2021 low, suggests a potential low from April to October 2022, according to cycles analyst Ray Merriman (www.mmacycles.com). We are now in that period. However, there was a secondary double bottom low in August 2021 at $1,675 that also fell within the time frame for that particular 31-month cycle low. The last 7.83-year cycle was seen in December 2015. Since then we had an important 31-month cycle low in August 2018 then the double bottom low of March and August 2021. The March 2020 low we suspect was a half cycle low of the 7.83-year cycle. If we measure from the August 2021 low, our next low could be expected in September 2022–March 2023. There is some overlap there with the anticipated low from the March 2021 low. But first we need a relief rally after having gold fall 16.2% from the March 2022 high of $2,078. Both silver and the gold stocks, as measured by the TSX Gold Index (TGD), have fallen over 30% from their March 2022 high. The relief rally (badly needed) should therefore be sold.
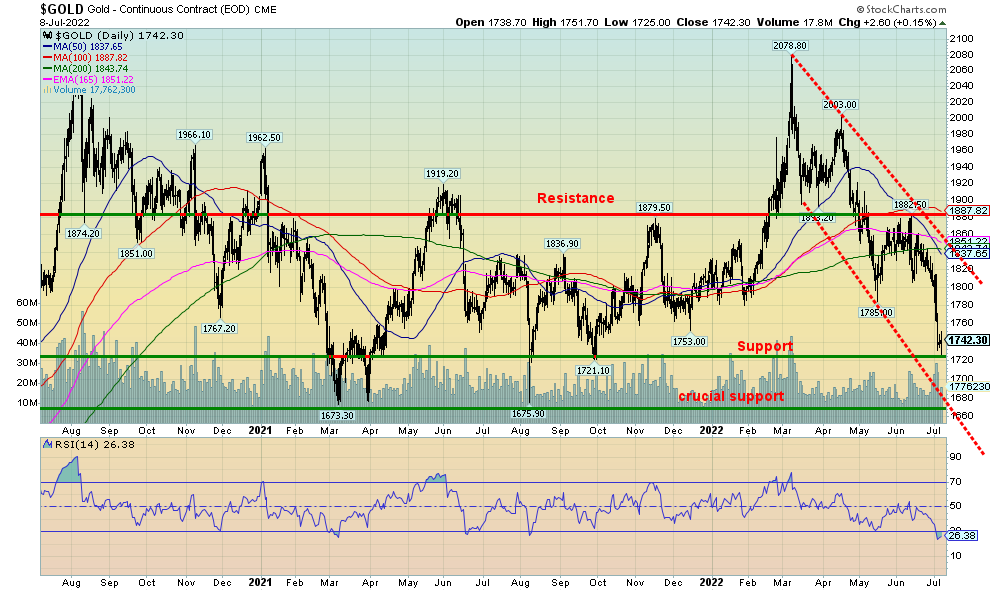
Source: www.stockcharts.com
Our chart of gold above is not particularly joyful for the gold bugs. However, we do see what appears to be a clear five-wave decline from that March top at $2,078. Could gold climb and break out above clear resistance at around $1,835 to $1,850? That would be helpful and we could then at least see a rebound up to around $1,900. But beyond that? There is support in the $1,720 zone, but what we do not want to see is a breakdown below that March 2021/August 2021 low near $1,675. If that goes, gold could in theory fall to $1,500. Now that would be a capitulation event. Silver could project down to around $12 if silver were to firmly break below $18/$19. Silver has been making new lows for this, a clear divergence with gold that is not making new lows. Sentiment is abysmal for the precious metals and the Gold Miners Bullish Percent Index (BPGDM) is at 13.8 just above where it was in March 2020. Gold stocks, as measured by the Gold Bugs Index (HUI) and the TSX Gold Index (TGD), have also hit fresh 52-week lows. Both are down roughly 30% from their March 2022 high, although on the year they are clearly outperforming the broader indices.
Inflation, high interest rates, war, sanctions, supply disruptions, and more continue to plague the globe. There appears to be little doubt that a recession is coming. The question is, how steep will it get and how long will it
last? The early prognosis is not positive. But there is even more trouble on the horizon. At the risk of venturing into politics, we can’t help but notice the ratcheting up of the U.S. culture wars that most recently saw the end
of Roe vs. Wade and yet another deadly mass shooting. According to statistics from the Gun Violence Archive (www.gunviolencearchive.org), shootings take place at least twice every week thus far in 2022.
What is now being discussed in numerous places, not only in the U.S. but elsewhere too, is the potential for civil war in the U.S. This is not to say that one will happen. It is unknown what would happen, for example, if former President Trump were charged with crimes resulting from the January 6, 2021 attack on the U.S. Capitol. The U.S. fought one civil war in 1861–1865, but the roots and events leading up to that war had already been going on for decades before the actual outbreak of hostilities.
Today it is no different. Many trace it back to the period of President Richard Nixon and the Watergate scandal that brought down a sitting president. But the real dividing lines were seen during the 1960s with the rise of anti-war demonstrations opposing the Vietnam War and the Civil Rights movement of the 1960s that resulted in numerous riots, including the burning of Detroit. Add in the rise of women’s movements that helped lead to Roe vs. Wade and also the rise of gay rights and other minority rights. Many of these groups were targeted by the state. But it was more than just the state vs. the protestors—many groups were opposed to them and clashes between, for example, pro-war and anti-war demonstrators were frequent. The era also saw the assassination of four major political figures in the space of only five years: John F. Kennedy, Malcolm X, Martin Luther King, and Robert Kennedy. The odds of four major political figures (plus a few others as well) being assassinated in a such a short period of time in the so-called world’s beacon of democracy are rather astronomical. Since then, the culture of war has only intensified with the U.S. Supreme Court tossing out decades of law, seemingly to pit one side against the other.
A recent new book titled The Next Civil War: Dispatches from the American Future (2022) by Stephen Marche has been making numerous rounds and captured considerable interest. We quote an excerpt below from the opening page of the introduction:
“The unimaginable has become everyday in America. Buffoonish mobs desecrating the U.S. Capitol building, tear gas and tanks on the streets of Washington D.C., running battles between protestors and militias, armed rebels attempting to kidnap sitting governors, uncertainty about the peaceful transfer of power – reading about them in another country, you would think a civil war had already begun. The United States is descending into the kind of sectarian violence usually found in poor countries with histories of violence, not the world’s most enduring democracy and largest economy. The fall has been sudden. A decade ago, American stability and supremacy were a given. The memory of September 11 led to regular mass demonstrations of national unity. The United States was synonymous with the glory of democracy. No longer. Solidarity has dissolved. The American system has become a case study of paralysis. Political Violence is on the rise.”
No sooner do we read that than we pick up a story as to how the U.S. Supreme Court could hand the 2024 election not to the winner of the popular vote and the electoral college but to the opposition. What’s key is how the Supreme Court will rule on a North Carolina case concerning gerrymandering. If the Supreme Court rules in favour of the state, it could impact presidential elections by turning the decision of where the electoral
college votes go over to the state legislatures and Congress. Normally those electoral college votes go to the presidential candidate that receives the highest number of votes in the state. But if an opposition state
legislature was able to decide where those electoral college votes go, they could instead assign those
electoral college votes to the loser who received fewer popular votes and is that legislature’s favoured candidate. That could then turn the loser into the winner. If that had applied to the 2020 election, a number of red state legislatures could have turned the election over to former president Trump, thus resulting in his re-election despite losing the popular vote in the state and across the country. The collapse and descent to civil war is something that starts slowly, builds for years, and then suddenly it is upon us, yet few would have seen it coming.
How did stock markets perform during the U.S. Civil War? Well, surprisingly quite well. The U.S. stock markets at the time bottomed in October 1857 and started a rise that didn’t make its final top until July 1869. Yes, there was a great deal of choppiness throughout the Civil War, but ultimately it climbed higher. War is profitable. When the Spanish-American War broke out, the stock market started a rally that didn’t peak until 1899. During World War I, the stock market bottomed in December 1914 and 1915 is still the best year ever for the U.S. stock market. While the outbreak of hostilities in World War II resulted in a stock market fall exacerbated by the outbreak of hostilities in the Pacific theatre vs. Japan, the bottom came in April 1942 when there were signs the tide was shifting in favour of the U.S. and the Allies. The market rallied strong into 1946.
Coincidently, gold and commodities spiked during the U.S. Civil War while interest rates initially spiked, then fell. During the Civil War, the U.S. government suspended payments in gold and silver, moving to a fiat currency system. But this is 2022, not 1861, and civil war today would look very different than it did back then. It would not be fought between armies but instead on the streets of the cities and countryside between warring groups.
“It was the best of times, it was the worst of times, it was the age of wisdom, it was the age of foolishness, it was the epoch of belief, it was the epoch of incredulity, it was the season of light, it was the season of darkness, it was the spring of hope, it was the winter of despair.”
—Charles Dickens, English writer and social critic, from A Tale of Two Cities (1859); 1812–1870
US Job Numbers
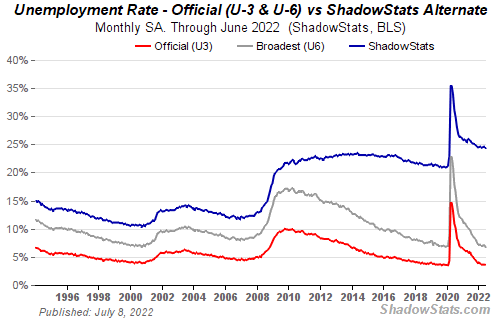
Source: www.shadowstats.com
Recession? What recession? They were looking for some moderation in job growth. Instead, they got more than expected as nonfarm payrolls surged 372,000 in June when they were only expecting 265,000. But before we get too excited, we note that the previous two months were revised downward by 74,000. The private sector added 381,000 jobs so that tells us the government sector shed jobs. But, in the bizarre way that the U.S. reports its numbers with a household survey and an establishment survey, we note that the household survey reported a drop of 315,000 jobs but that was offset by the fact the labour force contracted by 353,000. The household survey is conducted by the Census Bureau as a part of its population survey, whereas the establishment survey is conducted by private nonfarm business providing information on employment, hours worked, and employee earnings. The nonfarm payrolls are reported by the establishment survey but the unemployment rate by the household survey. So, the result is the two reports appear to be going in different directions. One shows a slowing while the other shows good job growth as usual. Markets, being choosy and wanting the best to rally the stock markets, chose the establishment survey’s numbers.
The unemployment rate (U3) remained unchanged at 3.6% while the U6 unemployment rate (U3 plus short-term discouraged workers, marginally attached workers, and those working part-time but wanting full-time work) fell to 6.7% from 7.1%. The Shadow Stats (www.shadowstats.com) unemployment number also slid to 24.3% from 24.6%. The Shadow Stats number is U6 plus long term unemployed over one year and those defined out of the workforce in a 1994 revision. The drop in the unemployment rate was largely because the labour force participation rate fell to 62.2% from 62.3%. Maybe more importantly, the labour force participation rate for the key 25–54-year-olds fell to 82.3% from 82.6%. Hours worked was steady at 35.4, but was expected to rise to 35.6. Wages are up 5.1% y-o-y but we note that remains below the rate of inflation which is 8% plus.
Overall, the U.S. has created jobs at a rate of 457,000/month in 2022 vs. 562,000/month in 2021. The authorities were hoping to see moderation of job growth, but, instead, it accelerated. However, as we note, it was a mixed report with two different tales of the tape. It is unlikely to deter the Fed from hiking 75 bp in July as is widely expected. Although we are now hearing some talk of only a 50 bp hike. The strong report belies thoughts of a recession. But we can’t help but note that the 2-year–10-year spread has now turned negative by 3 bp. Note that the 3-month–10-year spread is still a wide 113 bp. We’d like to see that one negative to suggest a coming recession. Bond yields ticked higher following the job numbers.
U.S. 10-year treasury note, Canada 10-year Government of Canada bond (CGB)
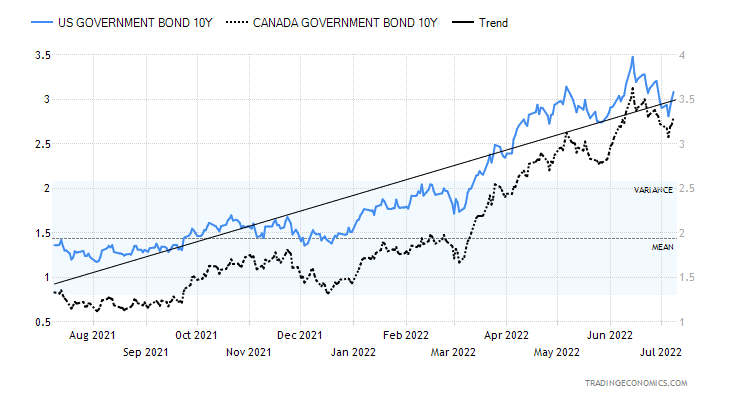
Source: www.tradingeconomics.com, www.home.treasury.gov, www.bankofcanada.ca
Overall, this was a questionable report, given some split between the two surveys. The U.S. remains short over a half-million jobs from where they were in February 2020. Yet the job numbers are considered a great success. Canada has long surpassed its February 2020 levels. The Fed is going to continue its rate hikes despite GDP reports that showed the U.S. economy contracting in Q1 and early indication that it is contracting in Q2. But we await the decision from the NBER. Shadow Stats unemployment remains unusually high as it has fallen the least of the three reported unemployment levels (Two official U3 and U6). The Shadow Stats unemployment is still above 24%.
Canada Job Numbers
Canada Employment Rate, Unemployment Rate
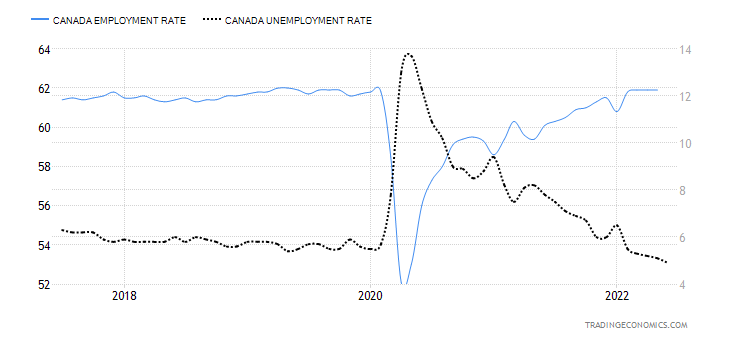
Source: www.tradingeconomics.com, www.statcan.gc.ca
Canada unexpectedly lost 43.2 thousand jobs in June when they had expected a rise of 23.5 thousand. It more than offset the 39.8 thousand rise in May. But the unemployment rate unexpectedly fell to 4.9% from 5.1% in May, all the result of fewer people searching for work. There was an unexpected decline of 100,000 workers voluntarily exiting the labour force. That too was a record. It was a record low for the unemployment rate. The market had expected the rate to remain unchanged at 5.1%. The employment rate of 61.9% was unchanged from May. The big drop came as a result of people age 55 and over where their employment fell by 51.0 thousand. Self-employed workers fell by 59.0 thousand while service-producing industries were down 76.0 thousand. But the goods-producing sector gained 33.0 thousand. Helping push the unemployment rate lower was a drop in the labour force participation rate to 64.9% from 65.3%. The R8 unemployment rate, which is the highest reported by Stats Canada, fell to 6.4% from 7.0%. The R8 rate includes discouraged workers and waiting groups of involuntary part-timers. Hourly wages y-o-y rose 5.6%, which is below the rate of inflation of 7.7%. With wages lagging the inflation rate, it is no surprise that employees have been pushing for a catch-up and that is resulting in more labour stoppages.
Overall, the report was a bit bizarre with jobs falling but fewer people looking and the participation rate declining, helping push the unemployment rate to a record low. If Canada’s unemployment rate was calculated the same way as the U.S. it would stand at 3.7% vs. the U.S.’s 3.6%. That would also be a record low. Rather than say this was a bad report because jobs fell, we’ll call it an okay report as there was both good and bad in it. What it did reflect is that the labour market remains tight. Wage growth continues but still lags inflation.
Next week the Bank of Canada (BofC) sets its interest rate and the wide expectation is it will go up by 75 bp.
The rest of this page is blank
Markets & Trends
|
|
|
|
% Gains (Losses) Trends |
|
||||
|
|
Close Dec 31/21 |
Close Jul 8/22 |
Week |
YTD |
Daily (Short Term) |
Weekly (Intermediate) |
Monthly (Long Term) |
|
|
Stock Market Indices |
|
|
|
|
|
|
|
|
|
S&P 500 |
4,766.18 |
3,899.38 |
1.9% |
(18.2)% |
neutral |
down |
neutral |
|
|
Dow Jones Industrials |
36,333.30 |
31,338.15 |
0.8% |
(13.8)% |
neutral |
down |
neutral |
|
|
Dow Jones Transports |
16,478.26 |
13,397.30 |
0.8% |
(18.7)% |
down (weak) |
down |
up (weak) |
|
|
NASDAQ |
15,644.97 |
11,635.31 |
4.6% |
(25.6)% |
neutral |
down |
neutral |
|
|
S&P/TSX Composite |
21,222.84 |
19,022.86 (new lows) |
0.9% |
(10.4)% |
down |
down |
up |
|
|
S&P/TSX Venture (CDNX) |
939.18 |
615.38 (new lows) |
(0.3)% |
(34.5)% |
down |
down |
down (weak) |
|
|
S&P 600 |
1,401.71 |
1,143.84 |
0.5% |
(18.4)% |
down (weak) |
down |
neutral |
|
|
MSCI World Index |
2,354.17 |
1,879.25 (new lows) |
(0.2)% |
(20.2)% |
down |
down |
down (weak) |
|
|
NYSE Bitcoin Index |
47,907.71 |
20,833.01 |
3.7% |
(56.5)% |
down |
down |
neutral |
|
|
|
|
|
|
|
|
|
|
|
|
Gold Mining Stock Indices |
|
|
|
|
|
|
|
|
|
Gold Bugs Index (HUI) |
258.87 |
216.78 (new lows) |
(4.5)% |
(16.3)% |
down |
down |
down |
|
|
TSX Gold Index (TGD) |
292.16 |
259.93 (new lows) |
(0.8)% |
(11.0)% |
down |
down |
down (weak) |
|
|
|
|
|
|
|
|
|
|
|
|
Fixed Income Yields/Spreads |
|
|
|
|
|
|
|
|
|
U.S. 10-Year Treasury Bond yield |
1.52% |
3.08% |
6.2% |
102.6% |
|
|
|
|
|
Cdn. 10-Year Bond CGB yield |
1.43% |
3.30% |
2.2% |
130.8% |
|
|
|
|
|
Recession Watch Spreads |
|
|
|
|
|
|
|
|
|
U.S. 2-year 10-year Treasury spread |
0.79% |
(0.03)% |
(160.0)% |
(103.8)% |
|
|
|
|
|
Cdn 2-year 10-year CGB spread |
0.48% |
0.03% |
(78.6)% |
(93.8)% |
|
|
|
|
|
|
|
|
|
|
|
|
|
|
|
Currencies |
|
|
|
|
|
|
|
|
|
US$ Index |
95.59 |
106.82 (new highs) |
1.8% |
11.8% |
up |
up |
up |
|
|
Canadian $ |
.7905 |
0.7718 (new lows) |
(0.6)% |
(2.4)% |
down |
down |
neutral |
|
|
Euro |
113.74 |
101.78 (new lows) |
(2.4)% |
(10.5)% |
neutral |
down |
down |
|
|
Swiss Franc |
109.77 |
102.41 |
(1.8)% |
(6.7)% |
down (weak) |
down |
down |
|
|
British Pound |
135.45 |
120.3 (new lows) |
(0.6)% |
(11.2)% |
down |
down |
down |
|
|
Japanese Yen |
86.85 |
73.48 |
(0.6)% |
(17.4)% |
down |
down |
down |
|
|
|
|
|
|
|
|
|
|
|
|
|
|
|
|
|
|
|
|
|
|
Precious Metals |
|
|
|
|
|
|
|
|
|
Gold |
1,828.60 |
1,742.30 |
(3.3)% |
(4.7)% |
down |
down |
neutral |
|
|
Silver |
23.35 |
19.24 (new lows) |
(2.2)% |
(17.6)% |
down |
down |
down (weak) |
|
|
Platinum |
966.20 |
882.80 (new lows) |
1.3% |
(8.6)% |
down |
down |
down |
|
|
|
|
|
|
|
|
|
|
|
|
Base Metals |
|
|
|
|
|
|
|
|
|
Palladium |
1,912.10 |
2,156.60 |
11.3% |
12.8% |
up |
neutral |
neutral |
|
|
Copper |
4.46 |
3.52 (new lows) |
(2.2)% |
(21.2)% |
down |
down |
neutral |
|
|
|
|
|
|
|
|
|
|
|
|
Energy |
|
|
|
|
|
|
|
|
|
WTI Oil |
75.21 |
104.79 |
(3.4)% |
39.3% |
down |
up |
up |
|
|
Nat Gas |
3.73 |
6.03 |
5.2% |
61.7% |
down |
neutral |
up |
|
Source: www.stockcharts.com
Note: For an explanation of the trends, see the glossary at the end of this article.
New highs/lows refer to new 52-week highs/lows and, in some cases, all-time highs.
Copyright David Chapman, 2022
|
GLOSSARY Trends Daily – Short-term trend (For swing traders) Weekly – Intermediate-term trend (For long-term trend followers) Monthly – Long-term secular trend (For long-term trend followers) Up – The trend is up. Down – The trend is down Neutral – Indicators are mostly neutral. A trend change might be in the offing. Weak – The trend is still up or down but it is weakening. It is also a sign that the trend might change. Topping – Indicators are suggesting that while the trend remains up there are considerable signs that suggest that the market is topping. Bottoming – Indicators are suggesting that while the trend is down there are considerable signs that suggest that the market is bottoming.
|
Disclaimer
David Chapman is not a registered advisory service and is not an exempt market dealer (EMD) nor a licensed financial advisor. He does not and cannot give individualised market advice. David Chapman has worked in the financial industry for over 40 years including large financial corporations, banks, and investment dealers. The information in this newsletter is intended only for informational and educational purposes. It should not be construed as an offer, a solicitation of an offer or sale of any security. Every effort is made to provide accurate and complete information. However, we cannot guarantee that there will be no errors. We make no claims, promises or guarantees about the accuracy, completeness, or adequacy of the contents of this commentary and expressly disclaim liability for errors and omissions in the contents of this commentary. David Chapman will always use his best efforts to ensure the accuracy and timeliness of all information. The reader assumes all risk when trading in securities and David Chapman advises consulting a licensed professional financial advisor or portfolio manager such as Enriched Investing Incorporated before proceeding with any trade or idea presented in this newsletter. David Chapman may own shares in companies mentioned in this newsletter. Before making an investment, prospective investors should review each security’s offering documents which summarize the objectives, fees, expenses and associated risks. David Chapman shares his ideas and opinions for informational and educational purposes only and expects the reader to perform due diligence before considering a position in any security. That includes consulting with your own licensed professional financial advisor such as Enriched Investing Incorporated. Performance is not guaranteed, values change frequently, and past performance may not be repeated.
About the author


Website: https://www.enrichedinvesting.com
Disclaimer: David Chapman is not a registered advisory service and is not an exempt market dealer (EMD) nor a licensed financial advisor. We do not and cannot give individualised market advice. David Chapman has worked in the financial industry for over 40 years including large financial corporations, banks, and investment dealers. The information in this newsletter is intended only for informational and educational purposes. It should not be considered a solicitation of an offer or sale of any security. The reader assumes all risk when trading in securities and David Chapman advises consulting a licensed professional financial advisor before proceeding with any trade or idea presented in this newsletter. David Chapman may own shares in companies mentioned in this newsletter. We share our ideas and opinions for informational and educational purposes only and expect the reader to perform due diligence before considering a position in any security. That includes consulting with your own licensed professional financial advisor.