
“Between two evils, I always pick the one I never tried before.”
—Mae West, American stage and film actress, playwright, screenwriter, singer, and sex symbol; 1893–1980
“The stock market is a device for transferring money from the impatient to the patient.”
—Warren Buffett, American business magnate, investor, philanthropist, Chairman and CEO Berkshire Hathaway; b. 1930
“Men, it has been well said, think in herds; it will be seen that they go mad in herds, while they only recover their senses slowly, and one by one.”
—Charles MacKay, Scottish poet, journalist, author, anthologist, novelist, songwriter, author of Extraordinary Popular Delusions and the Madness of Crowds (1841); 1814–1889
Inflation has been on the rise. In response, central banks are using the tools they have in their monetary bucket to keep inflation under control. Raise interest rates and keep the currency under control. A preamble on monetary policy from the Bank of Canada (BofC) (www.bankofcanada.ca) is to preserve the value of money by keeping inflation low, stable, and predictable. Its monetary policy framework consists of two key components that work together: the inflation control-target and the flexible exchange rate. The inflation control target is 1–3 percent. The U.S. Federal Reserve Bank has a mandate to pursue the economic goals of maximum employment, price stability, and moderate long-term interest rates. These mandates may conflict with each other. The Fed’s inflation target is within the 2% range similar to Canada.
In response to rising inflation, central banks have raised interest rates. The Fed has gone from 0% to 3.25%. They are expected to hike the Fed rate by at least 50 bp and possibly 75 bp at the November 1–2 FOMC. The BofC just hiked the bank rate 50 bp to 3.75% at their October 26 interest rate decision. They started at 0.25%. The market had expected 75 bp but instead got only 50 bp. Is the BofC softening because of concern about the economy? The European Central Bank (ECB) also hiked rates this past week by 75 bp to the highest level since early 2009. The ECB is expected to conduct further rate hikes.
Despite all the rate hikes, interest rates are low if one views the current rates in an historical context. The same holds true in Canada. The Fed and the BofC have authority over the Fed rate or, in Canada’s case, the bank rate. The market dictates the yield on the 10-year U.S. treasury note and Canada’s 10-year Government of Canada bond (CGBs). The 10-year U.S. treasury note has gone from 0.52% in August 2020 to a high of 4.25% today. In the same month, the Canada 10-year CGB hit a low of 0.43%. So far, it has hit a high of 3.66%. Everyone prices their products off government bonds, so it is no surprise that interest rates have gone up for a host of products, especially mortgage rates. The U.S. 30-year mortgage recently hit 7.32%; Canada’s 5-year fixed hit 6.34%. These are the highest rates in years.
Inflation vs. the Fed Funds Rate and 10-Year Treasuries 1960–2022
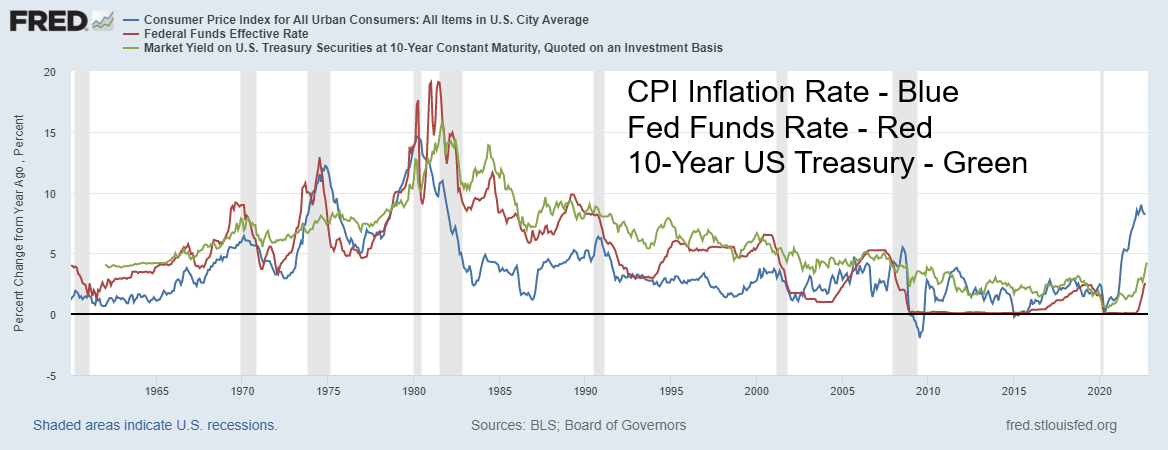
Source: www.stlouisfed.org
With the rise in interest rates, it is no surprise that we are now reading the scary headlines. The housing market will crash; people will be forced out of their homes; business will close their doors; millions will lose their jobs. Isn’t it time for the Fed/BofC to pause their rate hikes? Politicians are weighing in and not necessarily with sound ideas, but instead leaning heavily on scare tactics and misleading suggestions, demonstrating a lack of understanding on how a central bank works as well as questioning its independence, an essential feature in a functioning democracy.
As the U.K. learned with its recent debacles in bond and currency markets that almost brought down their financial system and the country’s pension funds, doing the wrong thing has consequences and the market makes you pay for the mistakes. Halloween came early to the U.K. To solve the problem, they flipped to their third prime minister in three months. The Bank of England (BOE) resorted to rubbing its tummy and patting its head at the same time or, in monetary parlance, hiking interest rates to deal with 10%-plus inflation while at the same time rescuing the financial system (and pension funds) from collapse with rounds of bond buying (QE) and supporting the sinking pound sterling. Welcome to Britaly, as The Economist quipped.
Scary headlines have even extended to the esteemed publications like The Economist (“A House-Price Horror Show” – The Economist, October 22nd–28th, 2022) and in the Toronto Star (“Economists warn rate hike risks a million jobs” – Toronto Star, Business, October 27, 2022). We can only guess they are in the Halloween spirit. Reality bites. A lot of people are going to be hurt and may even lose their house and their job. The question is, can the central banks control this sufficiently to bring it to a soft landing or will it be a huge thud of a hard landing? Be prepared for the latter; hope for the former.
Did the central banks bring all this upon themselves, fueled by unfettered fiscal growth by governments and monetary growth from the central banks? The central banks did not spark the war between Russia and Ukraine that led to a doubling of oil prices and a quadrupling of natural gas (NG) prices in the EU; they did not cause
the pandemic or bring on the lockdowns that resulted in significant supply disruptions in an interlinked, globalized world; nor did they spark the severe weather that has destroyed crops and caused major droughts, resulting in failing crops and sharply-rising food prices.
Central banks are monetary creatures. In response to the 2008 financial collapse that almost brought down the financial system and the pandemic of 2020–2021, they lowered interest rates to zero and in some cases (in the EU and Japan) sub-zero. They also embarked on massive injections of liquidity (QE) to save the financial system. Governments resorted to huge fiscal injections to support the system, adding fuel to the fire. The choice was do something vs. do nothing. Do nothing and the Western economies most likely faced financial and economic collapse, a possible economic depression and major social unrest. Do something and the result was bubbles. Classic case of too much money chasing too few goods, i.e., inflation of stock markets, housing markets, memes, NFTs, cryptocurrencies, bonds, etc.
The bubbles are party time. When the bubble bursts, as it appears it has, the party is over, and the hangover begins. Oh yes, bubbles: The Roaring Twenties (1924–1929), the dot.com bubble (1995–2000), the Japanese real estate bubble (1984–1989), the U.S. housing bubble (2002–2007). And, in an earlier period, three famous ones: Tulip Mania (1634–1637), the Mississippi Bubble 1719–1720), and the South Sea Bubble (1720). The latter three were the subject of Charles MacKay’s book Extraordinary Popular Delusions and the Madness of Crowds (1841). All ended in a crash and recessions and depressions with rising unemployment.
The period we have just come through may have been one of the most extraordinary bubbles in history. Everything went up. Debt, which is at the heart of every financial collapse in history, more than doubled after the financial crash of 2008. The question on some people’s minds is, could we have another Lehman Brothers moment, only bigger? Debt grew from around $140 trillion at the time of Lehman Brothers to over $300 trillion today.
Derivatives, something that has been around for centuries, also more than doubled and are today estimated at over $2 quadrillion. No, that doesn’t mean that if the derivative market collapsed $2 quadrillion could collapse as the actual risk or market value of the derivatives is around 1% of that total. The $2 quadrillion is just an estimate as many do not actually know what the outstanding amount is, since so much of it is off book. The gross market value, as opposed to face value, of derivatives was estimated at around $12.4 trillion at the end of 2021. The prime derivatives are futures, options, interest rate swaps, and forward agreements. But there are many esoteric derivatives such as Credit Default Swaps (CDS) and Liability Driven Investments (LDI). It was LDIs attached to debt at U.K. pension funds that almost brought down the U.K.’s pension fund system. Because of low interest rates and attempts by pension funds everywhere to try and bring up the yield, LDIs and other esoteric derivatives prevail everywhere. Could that system blow up?
The other risk is destabilization of currencies, something that has been going on since at least 2010. In the past year, all major currencies have been falling against the U.S. dollar. The U.S. dollar has been going up because, as one pundit quipped, “it’s the best of a bad lot.” Surprisingly, the one thing that has not been going up is gold. Gold used to underpin the financial system; that is, until 1971 when the gold standard ended for good. Gold is very under-owned, unless you are a central bank. Gold is held mostly in jewellery 47%, then investment 22%, central banks 17%, and industrial 14%. It is estimated that above-ground gold totals roughly 200
thousand metric tonnes, worth today roughly $10.7 trillion and about 1% of all global assets—debt, equity, and real estate.
Tulip Mania – 1634–1637
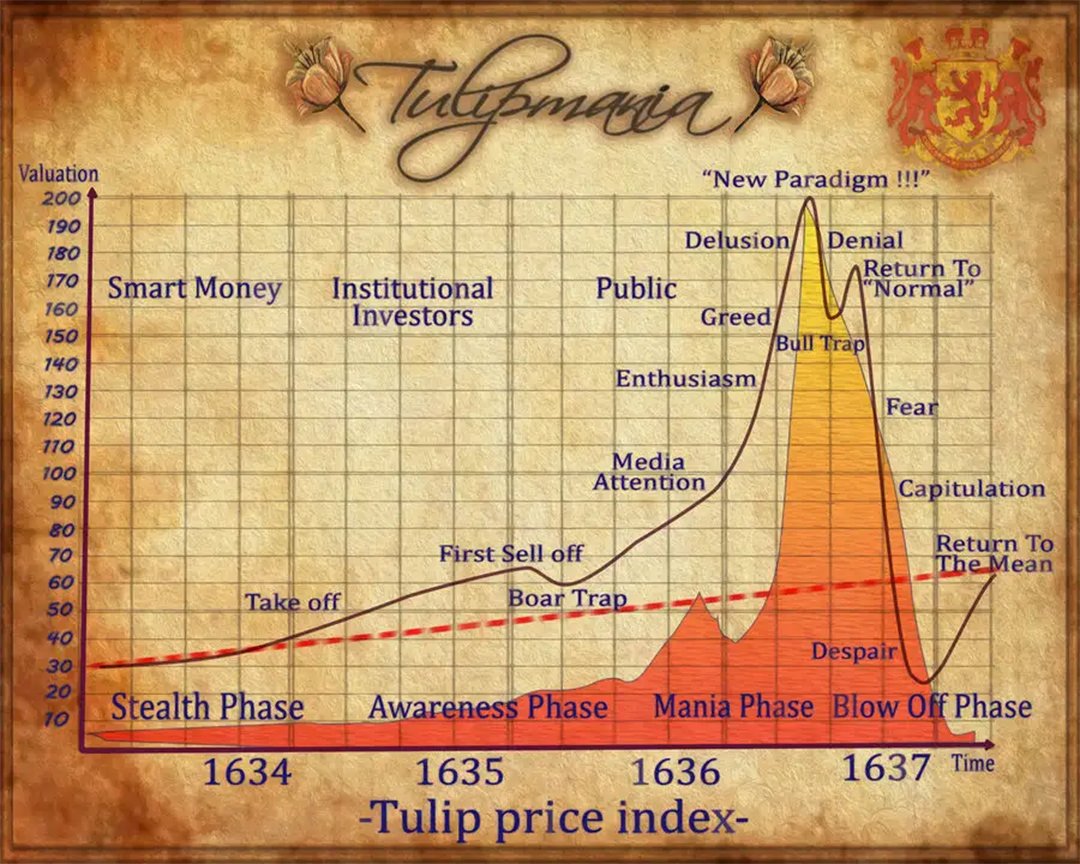
Source: www.talengestore.com
U.S. and Canada Housing Price Indices 1987–2022
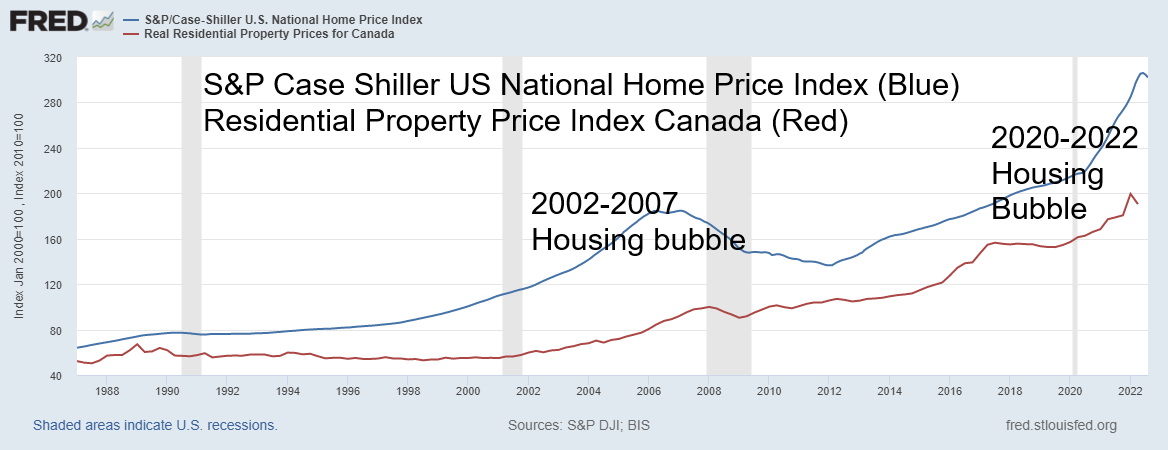
Source: www.stlouisfed.org
There is little doubt that the housing market rose into a bubble. Housing prices in Canada are up an estimated 52% since the pandemic. The problem now is, what happens next? A major collapse, as some are predicting, serves no one’s interest. The reality, however, is that prices got too far out of “whack” and a painful drop is in progress. Predictions by economists in Canada are for up to a 30% price drop. Prices are already down about 10% from a February 2022 peak. Canada’s household debt to disposable income hit 182% by Q2 2022, one of the highest levels in the world. But it is not as if Canada was the only one with a growing potential for a housing collapse. Others, besides the U.S., include Australia, New Zealand, Sweden, U.K., and many countries in the EU. China could be facing the biggest property collapse of them all. As one pundit quipped about the potential for collapse in the housing market, “it’s like sitting on top of a volcano.”
It’s no surprise that as a result housing starts as well as housing sales of new and existing homes have fallen in both Canada and the U.S. In the U.S., housing starts and sales, both new and existing, have been dropping for months. Sales and starts in the U.S. never reached the heights seen at the peak of the housing bubble in 2006. Canada’s sales and starts are higher than in the mid-2000s, but they have also seen a drop. In turn, a drop in the housing market could have a negative impact on jobs in real estate, construction, home appliances, and even in renovations.
Next week on November 4, both the U.S. and Canada job numbers are out. The expectation is that there will be an uptick in unemployment and a downtick in the number of jobs. Consensus forecasts for Canada are that there will be drop of 5,000 jobs and the unemployment rate will rise to 5.4% from 5.2%. In the U.S., nonfarm payrolls for October are expected at 200,000 vs. 263,000 in September and the unemployment rate to rise to 3.6% from 3.5%. So far, those numbers are an indication of a gentle decline rather than a sharp one. But a reminder that job numbers are a lagging economic indicator and the real impact of rising interest rates on jobs and the housing market may not be seen until 2023.
Canada Home Sales 2007–2022
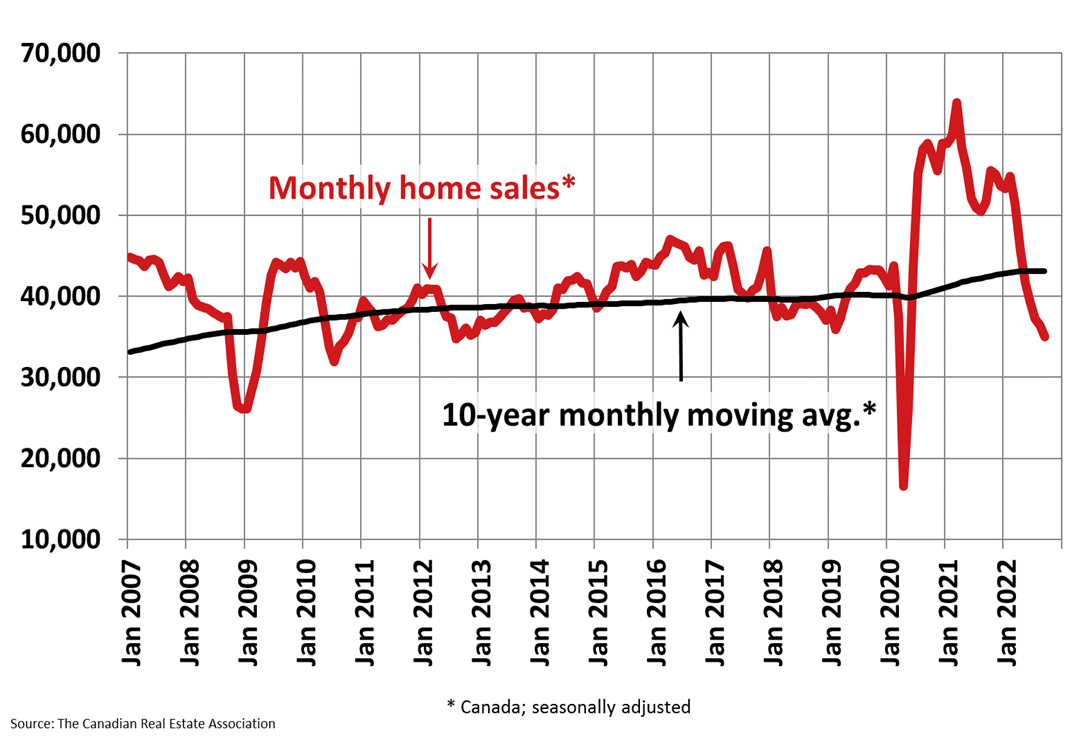
Source: www.crea.ca
Excesses beget excesses. Only in this case it is an excess of money and credit begetting a reckoning that could be excess in the opposite direction. Everything eventually reverts to the mean. When things are good, it is easy to focus on all the good things of a rising stock market, rising housing prices, and more. Everyone, well, most everyone, does well and some (a small proportion) do excessively well. The majority, however, never benefit much. Nobody is expecting a Lehman Brothers moment until it happens, and then panic sets in. Governments and central banks have been continually coming to the rescue since the first shakedowns got underway in the 1970s. All those who were around for the October crash of 1987 remember that the reaction of the central banks was to suddenly lower interest rates and pump liquidity into the financial system, followed by governments upping fiscal deposits to the financial system. That in turn helped set off the high-tech/dot.com bubble of the 1990s.
Since the world came off the gold standard in August 1971, the Western economies and the world by extension have been plagued with a series of financial crises, each for the most part worse than the previous one. The result is that debt has exploded. Has it reached the point of maximum sustainability? If another crisis develops, will the central banks and governments once again be able come riding to the rescue? The proverbial Fed put, as we call it.
Bubbles, Bubbles Everywhere – 1970–2022
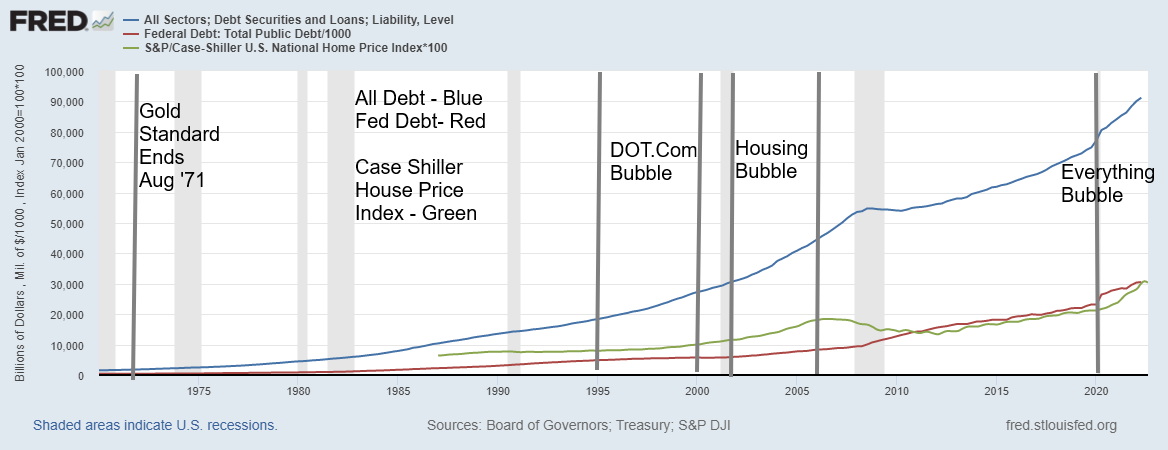
Source: www.stlouisfed.org
The chart above shows the massive growth in debt since the end of the gold standard in August 1971. We didn’t put money supply on the chart, but the rise is similar. U.S. federal debt has increased over 7,500%; all debt (government debt—federal, state, municipality, corporate, household) has increased over 5,300%. We only have the data for the Case-Shiller House Price Index from 1987 and it’s up 486%. Not shown, the S&P 500 was up over 3,800% while gold is also up over 3,800%. M2 money supply is up over 3,100%.
There has never been a bubble that didn’t burst. And with the bursting of the bubble there was a reckoning. But again, is the glass half full or half empty? An RBC report said that Canadians amassed $3.9 trillion in net wealth following the pandemic. Of that, an estimated $900 billion has been lost to Q2 – 23%. We still have room to fall further.
"It is a sobering fact that the prominence of central banks in this century has coincided with a general tendency towards more inflation, not less. [I]f the overriding objective is price stability, we did better with the nineteenth-century gold standard and passive central banks, with currency boards, or even with 'free banking.' The truly unique power of a central bank, after all, is the power to create money, and ultimately the power to create is the power to destroy."
- Paul Volker, American economist, 12th Chairman of the Federal Reserve 1979–1987, Chair of Economic Recovery Advisory Board 2009–2011; 1927–2019
Chart of the Week
Real GDP Growth % 1948–2022
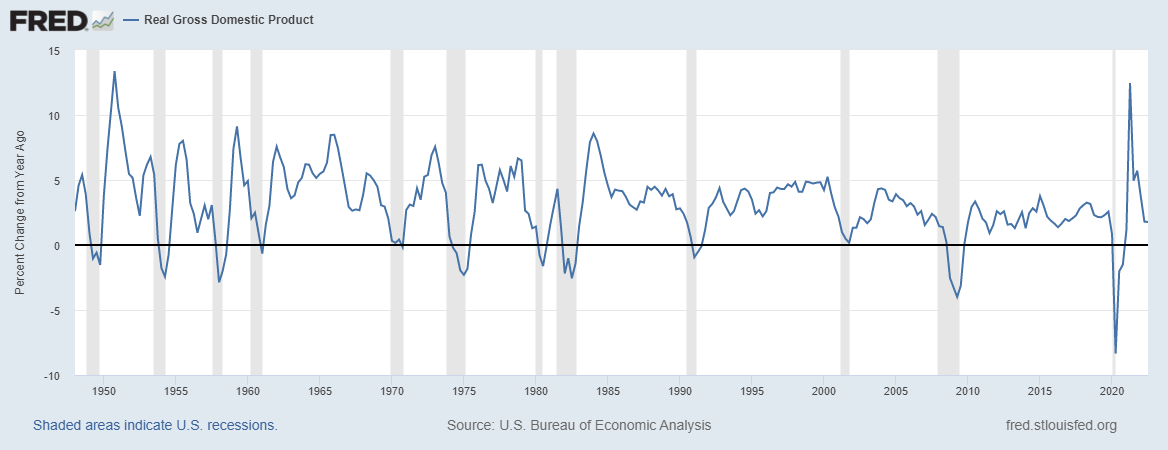
Source: www.stlouisfed.org
Q3 GDP was reported as a gain of 2.6% annualized. That followed contractions of 0.6% in Q2 and 1.6% in Q1. Year-over-year GDP grew 1.8%, the same as in the previous quarter. The market had expected a gain of 2.4%. Shadow Stats (www.shadowstats.com) reported that the SGS alternate GDP showed growth of only 0.5% vs. a contraction in Q2 of 2.6%.
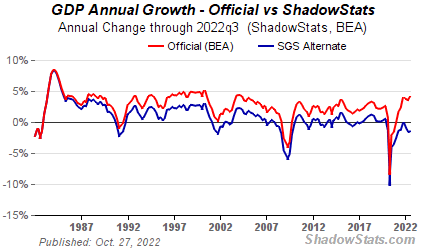
Source: www.shadowstats.com
Year-over-year, Shadow Stats is reporting a contraction of 1.5% to Q3 2022. Shadow Stats calculates its GDP based on earlier methods before methodological changes were made in the 1990s that resulted in a built-in upside bias to official reporting.
One of the prime reasons GDP grew was a narrowing of the trade gap. Imports sank 6.9% while exports were up 14.6%, thanks mostly to petroleum products. In some respects, that’s a surprise given the strength of the U.S. dollar. Nonetheless, it was no surprise to learn that residential investment was down as mortgage rates began to bite and that retail sales were slow but remained good thanks to a jump in the health care component. Decreases on the retail side were seen in motor vehicles, food, and beverages.
Given the rise in GDP the question begs, of course—where is the recession that everyone is predicting? The unemployment rate is still at 3.5% (U3). Inflation bottomed in May 2020 during the pandemic. If there is a two-year lag as some studies show between a low in inflation and a low in unemployment, then unemployment is most likely bottoming now.
Inflation vs. Unemployment 1948–2022
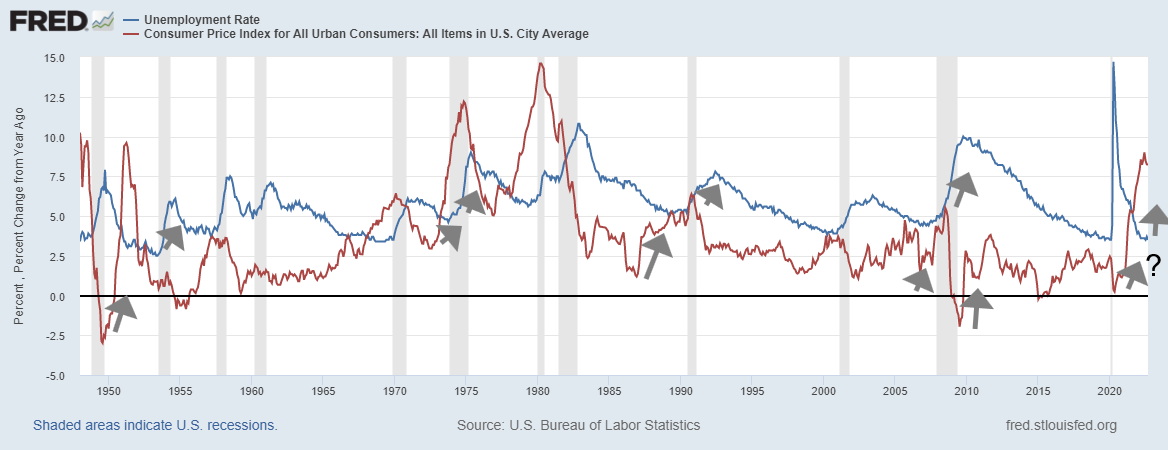
Source: www.stlouisfed.org
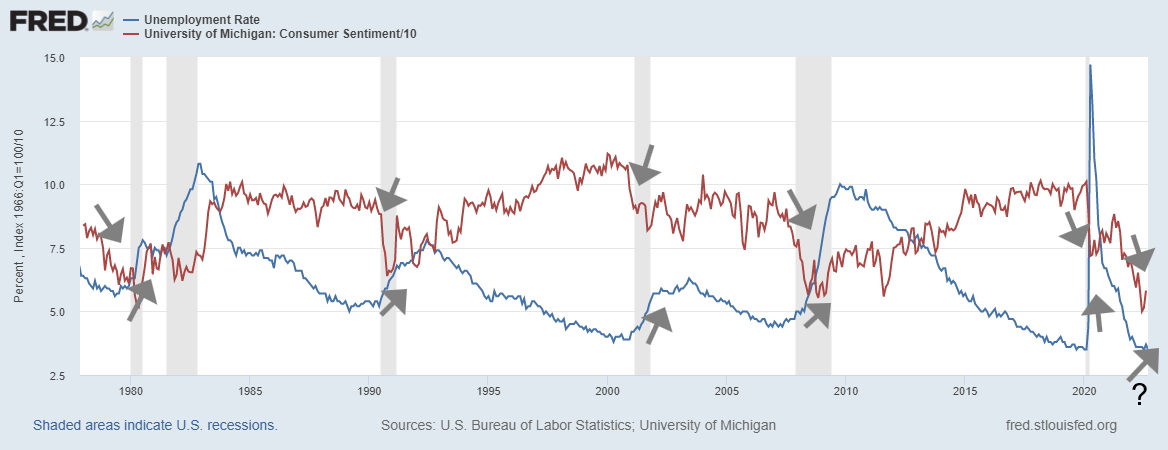
Another way of looking at it is consumer sentiment. The chart below shows the Michigan Consumer Sentiment Index vs. unemployment (U3). What we notice is that consumer sentiment tended to fall before unemployment started to rise. According to some studies, the lag is about 10 months. We are past that now as the Michigan Consumer Sentiment Index last topped in April 2021 and it has been on a downward swing ever since. Next week’s jobs report might give us some further clues.
On the surface, the GDP report looked good. But if you strip out that upward bias because of trade, then it’s not so good. Inflation and consumer sentiment are both pointing to trouble ahead. GDP and unemployment tend to lag.
Consumer Sentiment vs. Unemployment 1977–2022
Rest of page is blank
Markets & Trends
|
|
|
|
% Gains (Losses) Trends
|
|
||||
|
|
Close Dec 31/21 |
Close Oct 28/22 |
Week |
YTD |
Daily (Short Term) |
Weekly (Intermediate) |
Monthly (Long Term) |
|
|
Stock Market Indices |
|
|
|
|
|
|
|
|
|
`S&P 500 |
4,766.18 |
3,901.06 |
4.0% |
(18.2)% |
up |
down |
neutral |
|
|
Dow Jones Industrials |
36,333.30 |
32,861.80 |
5.7% |
(9.6)% |
up |
neutral |
neutral |
|
|
Dow Jones Transport |
16,478.26 |
13,574.98 |
7.0% |
(17.6)% |
up |
down |
neutral |
|
|
NASDAQ |
15,644.97 |
11,102.45 |
2.2% |
(29)% |
neutral |
down |
down (weak) |
|
|
S&P/TSX Composite |
21,222.84 |
19,471.19 |
3.2% |
(8.3)% |
up |
down |
neutral |
|
|
S&P/TSX Venture (CDNX) |
939.18 |
596.93 |
0.7% |
(36.4)% |
down (weak) |
down |
down |
|
|
S&P 600 |
1,401.71 |
1,196.85 |
6.2% |
(14.6)% |
up |
down (weak) |
neutral |
|
|
MSCI World Index |
2,354.17 |
1,802.06 |
3.9% |
(23.5)% |
up (weak) |
down |
down |
|
|
Bitcoin |
47,907.71 |
20,525.52 |
8.0% |
(57.2)% |
up |
down |
down |
|
|
|
|
|
|
|
|
|
|
|
|
Gold Mining Stock Indices |
|
|
|
|
|
|
|
|
|
Gold Bugs Index (HUI) |
258.87 |
198.97 |
1.4% |
(23.1)% |
up |
down |
down |
|
|
TSX Gold Index (TGD) |
292.16 |
242.41 |
1.5% |
(17.0)% |
up |
down |
down |
|
|
|
|
|
|
|
|
|
|
|
|
% |
|
|
|
|
|
|
|
|
|
U.S. 10-Year Treasury Bond yield |
1.52% |
4.02% |
(4.5)% |
164.5% |
|
|
|
|
|
Cdn. 10-Year Bond CGB yield |
1.43% |
3.24% |
(10.3)% |
123.6% |
|
|
|
|
|
Recession Watch Spreads |
|
|
|
|
|
|
|
|
|
U.S. 2-year 10-year Treasury spread |
0.79% |
(0.39)% |
(50.0)% |
(149.4)% |
|
|
|
|
|
Cdn 2-year 10-year CGB spread |
0.48% |
(0.61)% |
(7.0)% |
(227.1)% |
|
|
|
|
|
|
|
|
|
|
|
|
|
|
|
Currencies |
|
|
|
|
|
|
|
|
|
US$ Index |
95.59 |
110.61 |
(1.2)% |
15.7% |
down (weak) |
up |
up |
|
|
Canadian $ |
.7905 |
0.7352 |
0.4% |
(7.0)% |
neutral |
down |
down |
|
|
Euro |
113.74 |
99.62 |
1.0% |
(12.4)% |
up |
down |
down |
|
|
Swiss Franc |
109.77 |
100.36 |
0.1% |
(8.6)% |
down |
down |
down |
|
|
British Pound |
135.45 |
116.08 |
2.7% |
(14.3)% |
up |
down |
down |
|
|
Japanese Yen |
86.85 |
67.840 |
flat |
(21.9)% |
down |
down |
down |
|
|
|
|
|
|
|
|
|
|
|
|
|
|
|
|
|
|
|
|
|
|
Precious Metals |
|
|
|
|
|
|
|
|
|
Gold |
1,828.60 |
1,644.80 |
(0.7)% |
(10.1)% |
down |
down |
down (weak) |
|
|
Silver |
23.35 |
19.15 |
0.4% |
(18.0)% |
neutral |
down |
down |
|
|
Platinum |
966.20 |
949.10 |
1.6% |
(1.8)% |
up |
neutral |
down (weak) |
|
|
|
|
|
|
|
|
|
|
|
|
Base Metals |
|
|
|
|
|
|
|
|
|
Palladium |
1,912.10 |
1,897.20 |
(5.4)% |
(0.8)% |
down |
down |
neutral |
|
|
Copper |
4.46 |
3.43 |
(1.2)% |
(23.2)% |
neutral |
down |
neutral |
|
|
|
|
|
|
|
|
|
|
|
|
Energy |
|
|
|
|
|
|
|
|
|
WTI Oil |
75.21 |
87.90 |
3.4% |
16.9% |
up |
down |
up |
|
|
Nat Gas |
3.73 |
5.68 |
14.5% |
52.3% |
down |
down |
up |
|
Source: www.stockcharts.com
Note: For an explanation of the trends, see the glossary at the end of this article.
New highs/lows refer to new 52-week highs/lows and, in some cases, all-time highs.
Source: www.stockcharts.com
For the second week in a row, stock markets put in a good up week. The market is also up for six consecutive days, some of it spectacular like the 800-plus points seen for the Dow Jones Industrials (DJI) on Friday. It was so good that it is leading some to suggest that the bear is over. They are most likely wrong too. Yes, the S&P 500 did break above a downtrend line, suggesting to us that we most likely have more upside ahead. But it is not necessarily the end of the bear. Looming are the November 8 mid-terms where there appears to be some potential for violence. With one side claiming that the other side can only win by cheating and one side trying to put in place officials willing to overturn the results, there is some potential for violence out of the election, no matter who wins. As we have quipped, when one side of two claims that the election is fixed in favour of the other side, there is a serious question about the state of democracy in the U.S. The attempted assassination of the second in line for president of the U.S., Nancy Pelosi, may also be a negative sign going forward and a warning of violence to come.
On the week, the S&P 500 gained almost 4.0%, the Dow Jones Industrials (DJI) was up 5.7%, and the Dow Jones Transportations (DJT) jumped about 7.0%, even as the NASDAQ was dragged down by the FAANGs, gaining only 3.2%. Others were up as well as the S&P 400 (Mid) gained 5.3% and the S&P 600 (Small) was up 6.2%. In Canada, the TSX Composite gained 3.2% and the TSX Venture Exchange (CDNX) was up 0.7%. The MSCI World Index gained 3.9% and, in the EU, the London FTSE was up 1.1%, the Paris CAC 40 gained 3.9%, and the German DAX was up 4.0%. In Asia, China’s Shanghai Index (SSEC) fell a sharp 4.1%, bucking the uptrend elsewhere, but the Tokyo Nikkei Dow (TKN) was up 0.8%. The Shanghai Index appears to have reacted
negatively to the re-election of Xi Jinping once again as the supreme leader of China. If the Shanghai Index fared poorly, the Hong Kong Hang Seng Index did worse, falling 8.3% to fresh 52-week lows.
Markets rallied because of thoughts that the economy is doing better than expected as seen with the Q2 2.6% GDP gain and even thoughts that the Fed may ease up on its rate hikes. There is also some expectation of slowing inflation as the PCE price index came in at 6.2%, largely as expected. The core PCE rate, the preferred inflation rate of the Fed, came in at 0.5% for the month and 5.1% over the past year. All were largely as expected so that was good news for the market. While the Fed risks over-tightening, there was nothing in the numbers, including okay earnings, that could preclude the Fed not continuing its current tightening path.
There was also good news on personal income and spending and the Michigan Consumer Sentiment Index that helped spur the market. The market seemed to set aside the drop in pending home sales. Bonds also rallied and that helped as well. This week the Bank of Canada (BofC) surprised with only a 50 bp hike rather than the broadly expected 75 bp hike. This led some to believe that the Fed may moderate its rate hikes even if they don’t do it during this round at the Nov 1–2 FOMC. The ECB also hiked 75 bp as was expected but then the ECB has lagged other central banks. In the EU, inflation has been raging, thanks primarily to the war between Ukraine/Russia.
The markets rallied despite the dumping of technology shares (see NASDAQ next). Earnings, while down, have generally not been as bad as expected. Seems that happiness also came with a small raft of S&P 500 stocks making not only 52-week highs but all-time highs. Two DJI stocks, Merck and McDonalds, made all-time highs. Pharmaceuticals and burgers.
Sentiment has quickly become bullish once again. The latest fear and greed index is at 61 the lower end of greed. In late September the S&P 500 Bullish Percent Index was dragging along near the bottom. A month later it’s at 66. No, not yet in overbought territory but climbing fast. Other indicators such as the put/call ratio have improved but are not yet in super bull territory. 64% of the stocks in the S&P 500 are now trading over their 50-day MA, a positive development. AD lines are improving.
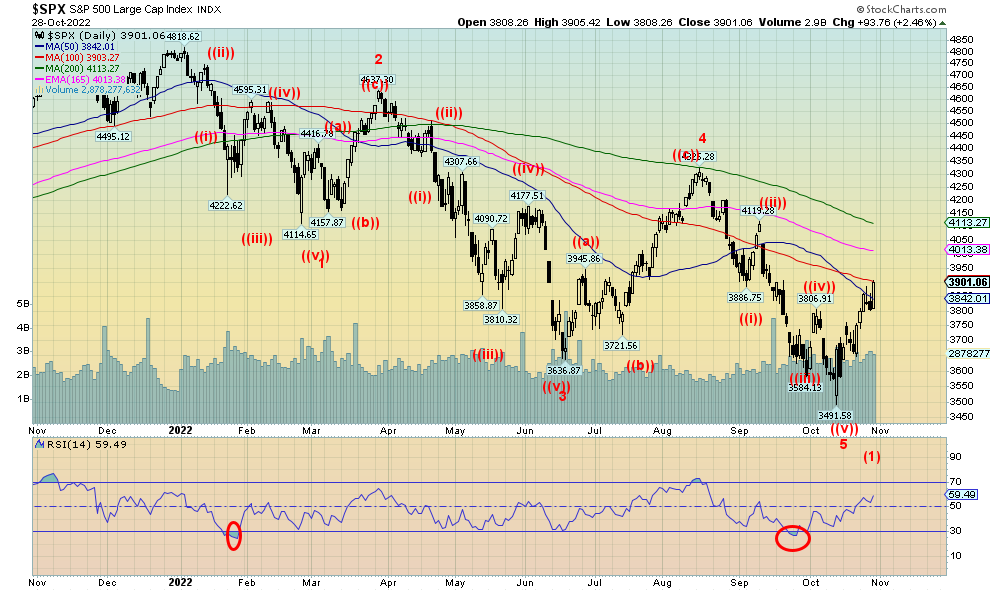
There is some chance that the S&P 500 low seen on October 13, 2022 may be the low of Intermediate wave 1 or wave A. We note the series of waves to the downside from the January high. If that’s correct, then this could be the start of intermediate wave 2 or B to the upside. While we have some expectations that we could reach as high as 4,100 and the 200-day MA, any significant rise above that level would suggest that we have more to run. Right now, we are at resistance near 3,900. A move above 3,950 would send us to the next level near 4,000. After that it is not much further to 4,100. If we can successfully manoeuvre through the next two weeks of the FOMC and the mid-terms, we could easily rally further into January. We are entering the period of the best six months: November to May. So seasonals may play a factor here. Given how bad the markets have been over the past nine months, a period of respite would be welcome.
Only a break back under 3,700 might change our minds, although under 3,800 would give us some pause for consideration. Under 3,600 new lows lie ahead.
Source: www.stockcharts.com
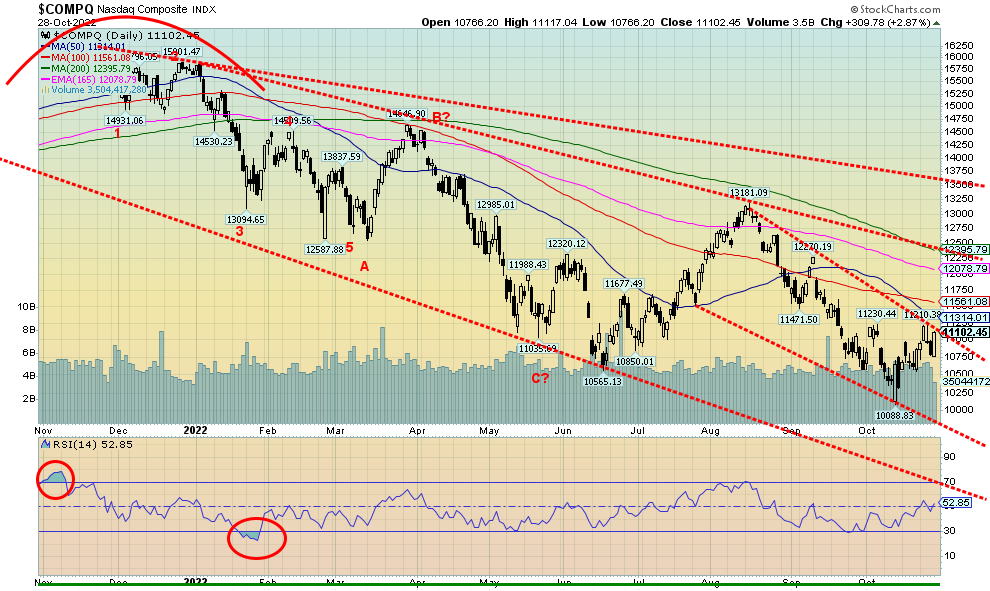
The NASDAQ was the weakest performer of the indices this past week, thanks to the weakness of the FAANGs. The NY FANG Index fell 4.1%, thanks primarily to Meta (Facebook). Meta was a big loser on the week, down 23.7%. Meta’s earnings fell short of expectations, as it faces advertising cutbacks and is even losing customers. FB just isn’t what it used to be. As if META weren’t bad enough, Amazon took a hit as well, down 13.3%, and the Chinese stocks continued to suffer as Baidu fell 13.9% and Alibaba was down 11.7%. Helping at least a bit was Nvidia that gained 11.0%. Twitter was up 7.6% after Elon Musk completed his purchase, then immediately fired a host of executives. Has Twitter topped? Most likely. It is, according to some, worth less than half of what it is currently trading at. Many believe Musk grossly overpaid. Musk’s net worth may be about to take a hit. Noteworthy was that it was also a week of new lows for a few the FAANG stocks. Making fresh 52-week lows were Meta, Amazon, Google, Baidu, and Alibaba. Twitter, of course, made 52-week highs. On Friday, with the markets rallying, the NASDAQ failed to make new highs for the current move along with the other indices. A potential divergence? Although, admittedly, that’s not enough for it to be convincing. The NASDAQ needs to regain back above 11,600 to convince us that it might have some legs to go higher. A break now under 10,750 would signal to us that the NASDAQ may have topped.
Source: www.stockcharts.com
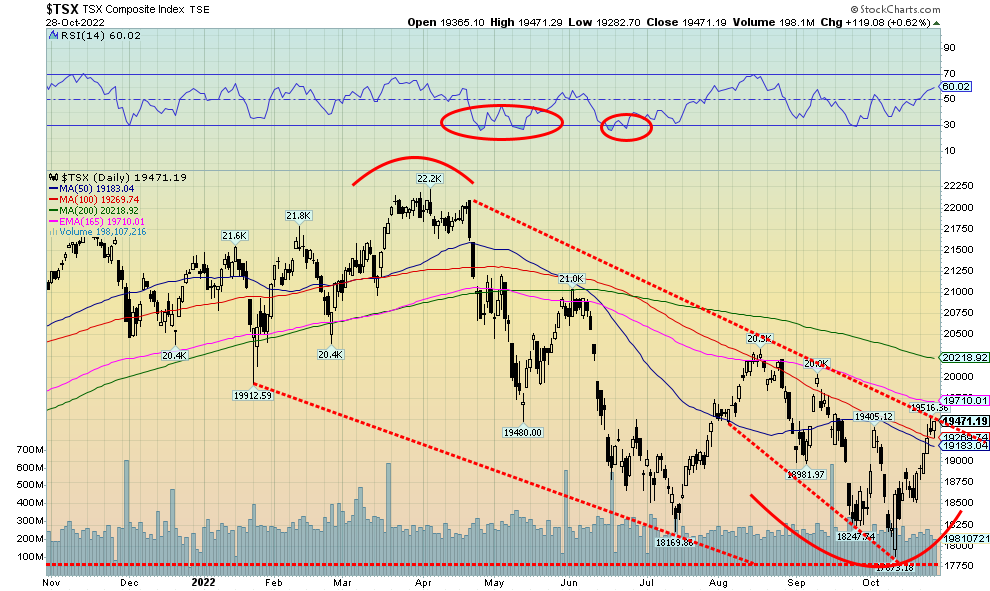
The TSX Composite joined the rally this past week, gaining 3.2%. The TSX Venture Exchange (CDNX) was up 0.7%. The TSX might have done better except it was dragged down by Materials and Metals. Material (TMT) fell 0.3% and Metals & Mining (TGM) dropped 1.8%. They were the only two losers of the 14 sub-indices. Leading the way to the upside was Information Technology (TKK), up 7.8%. There were a host of other big winners: Income Trusts (TCM) +5.1%, Consumer Discretionary (TCD) +4.4%, Health Care (THC) +4.5%, Industrials (TIN) +4.2%, Telecommunications (TTS) +4.4%, and Utilities (TUT) +4.6%. The TSX appears to be on the cusp of a further breakout. Above 19,710, the TSX should take a run at the 200-day MA near 20,220. The TSX might even see new highs above 20,500. On the other hand, the rise has been quick so a pullback here wouldn’t be a surprise, either. However, as we have noted with the U.S. indices, higher prices appear to be ahead. Trouble could start if we were drop back below 19,000. Below 18,500 a high would be in and we’d once again be focused on potential new lows.
10-year Treasury Bond/Canadian 10-year Government Bond (CGB)
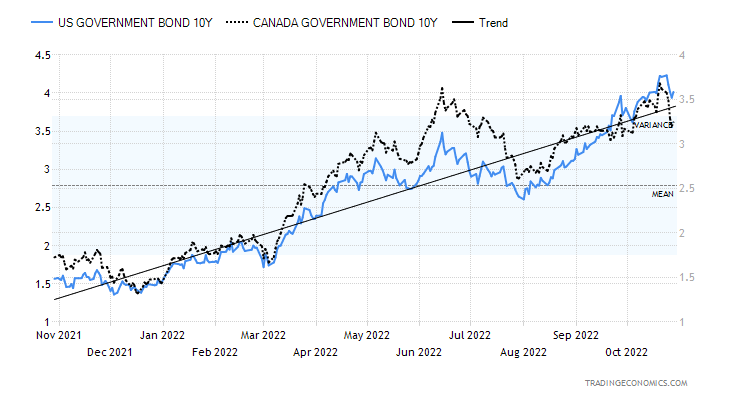
Source: www.tradingeconomics.com, www.home.treasury.gov, www.bankofcanada.ca
Bonds rally, bonds rally. Yes, bond yields fell this past week (prices rose as yields move inversely to prices). The U.S. 10-year treasury note dropped to 4.02% (down 4.5%) after topping at 4.25% while the Canadian 10-year Government of Canada bond (CGB) dropped to 3.24% from 3.61% (down 10.3%). Bond yields ticked back up on Friday after a series of better-than-expected economic numbers. The big economic number on the week was Q3 advance GDP which came in at 2.6% vs. an expectation of a gain of 2.4%. That follows the two previous quarters where GDP fell 1.6% and 0.6% respectively. Year-over-year GDP advanced 1.8%, still growing but slowing. Other numbers were better than expected. Weekly jobless claims came in at 217,000 vs. consensus of 220,000; Q3 PCE inflation was 4.2% below the previous quarters rise of 7.3%; personal income +0.4% vs. the expected +0.3%; personal spending +0.6% vs. expected +0.4%; the Michigan Consumer Sentiment Index was 59.9 vs. 58.6 last month and the expected 59.8. But some lower numbers were seen. Pending home sales fell 10.2% vs. an expected drop of 5%. But new home sales for September were 603,000 vs. the expected 585,000 and building permits rose 1.4%. On the negative side, the trade deficit for September was $92.2 billion below the expected $86 billion.
Bond prices appear to have completed a 5-wave down pattern (price) that got under way back in August 2020. If that is correct, then we appear to be due for a rebound rally. Keep in mind, however, that the completion of the 5-waves down pattern is just the first wave down of a larger pattern. This would be the second wave to the upside. Major support for yields is way down at 2.80%, but in between we see support at 3.60% and 3.30%.
November 1–2 is the FOMC, and the expectation is for a 75 bp hike. But could the Fed surprise like the BofC and hike only 50 bp? If they did, that would get the stock market, and gold, rallying. A 50 bp hike could reflect concern on the part of the Fed that the economy is slowing, and the risk is higher for a harder landing than they would like.
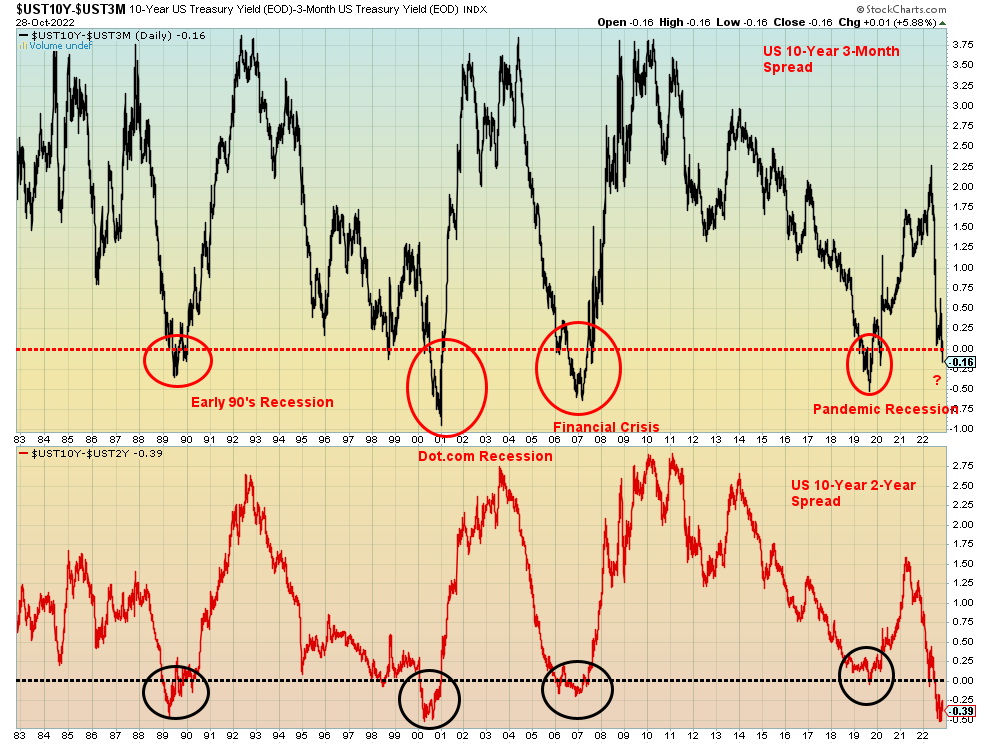
Source: www.stockcharts.com
They rarely go negative at the same time, but now the 10-year–3-month spread has turned negative, joining the 10-year–2-year negative spread. Taken together, we are most likely only about six months from a recession, maybe sooner.
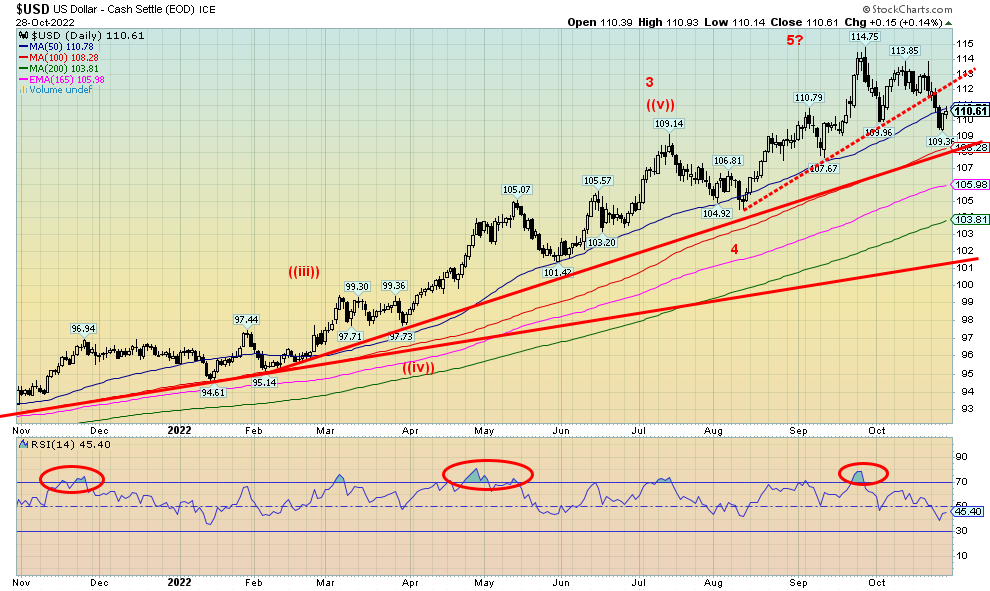
Source: www.stockcharts.com
The US$ Index may have topped. This past week we broke under an uptrend line at around 111 and then threatened to break under 110 before some better-than-expected economic numbers this past week pushed the US$ Index back up again. The low was at 109.36, just above the 100-day MA at 108.30. That is also where an uptrend line comes that should act at least as near-term support. That we made a lower high (113.95 vs. 114.75) and a lower low (109.36 vs. 109.96) suggests as well that a top is most likely in. A breakdown under 108 would confirm that. Below 108, support can be seen around 106 and 104. Major support is down at 101. On the week, the US$ Index fell 1.2%. That means the currencies were up as the euro gained 1.0%, the Swiss franc was up 0.1%, the pound sterling gained 2.7% (more confidence in Sunak than in Truss, it seems), while the Japanese yen was essentially flat. The Canadian dollar gained 0.4%, thanks to higher oil prices. The euro is looking the best it has in weeks and that should help going forward. Not that confidence is coming to the eurozone, but that things may not be as grim as originally thought. There is still some hope that the US$ Index could recover and see new highs, but a close below 109.25 would end that thought.
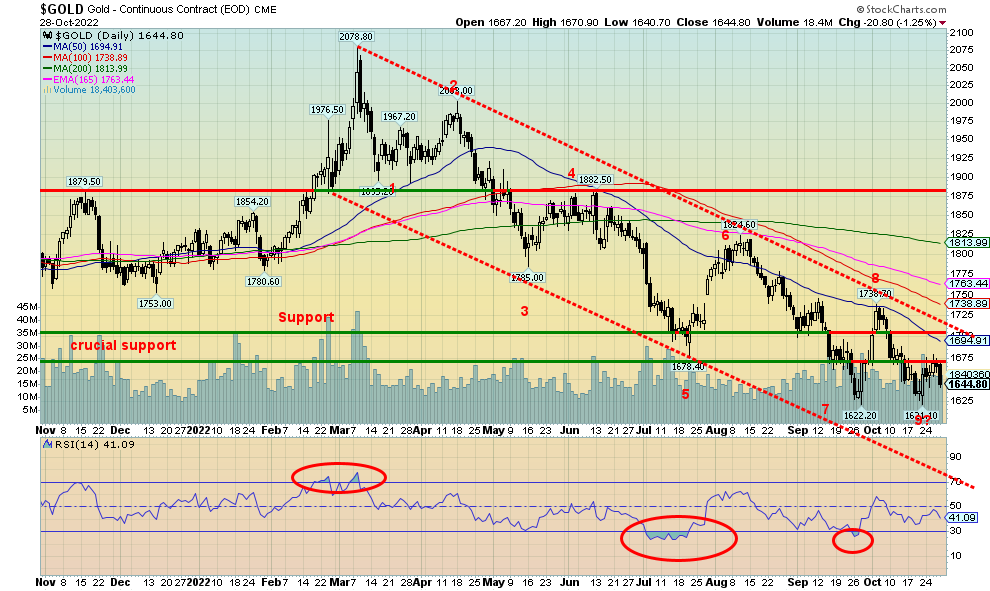
Source: www.stockcharts.com
Gold’s positive week was spoiled on Friday when stronger-than-expected economic numbers put the fear of higher interest rates back into the gold market. On the week, gold fell 0.7%, but silver held its gains, a possible divergence, up 0.4%. Platinum fared even better, up 1.6%. However, the industrial/near bullion metals fell. Palladium fell 5.4% and is now in negative territory for the first time this year, while copper dropped about 1.2%. With the better-than-expected economic numbers on Friday—i.e., better-than-expected personal income and spending, higher PCE inflation numbers, marginally improved consumer sentiment—bond yields ticked up slightly and the US$ Index bounced back but all that helped push gold lower. The FOMC is on Nov 1–2 and expectations are high for a 75 bp hike. Demand for gold as a physical investment remains strong as sales in India and China have perked up and premiums to spot are rising. A check of SilverGoldBull (www.silvergoldbull.ca) showed that a 1-oz gold Maple Leaf was offered at a 10% premium to spot. That is certainly better than the spreads seen on silver coins (see silver next).
Gold has made what might be termed an awkward-looking double bottom at $1,622 in September and $1,621 in October. Usually, the first low is the lower low. But what gold did do was to make lower lows both times while silver did not, a potential positive divergence. The breakout point is above the recent high at $1,738. We note the rebound this week took us to $1,679 but we failed to close over $1,675, a point we noted that would help us determine if a low is in. We still need to clear $1,675 and then above $1,725 to confirm that a low is in. Potential targets above $1,740 are up to $1,850. What’s key right now is that we hold preferably above $1,635, at least on a close basis. The 9-wave down pattern from the March high of $2,078 suggests to us that the
Downtrend could be over. We also note that the US$ Index has broken below recent key points as well, suggesting to us that we should see a lower US$ Index. That would also help gold. The 10-year and other bond/notes rallied this week as well, which would be positive for gold if the rally can continue.
Source: www.cotpricecharts.com
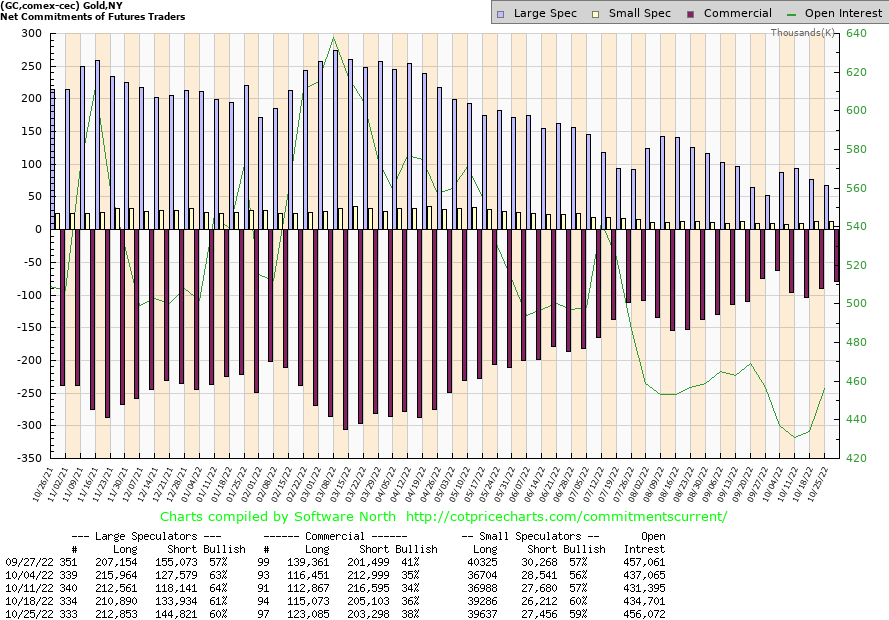
Once again, the gold commercial COT (bullion companies and banks) improved this time to 38% from 36%. Longs added about 8,000 contracts while shorts contracted about 2,000 contracts. The large speculators COT (hedge funds, managed futures, etc.) slipped to 60% from 61% as while their longs were up roughly 2,000 contracts shorts also rose, up about 11,000 contracts. We view this COT as bullish. Overall, open interest rose this past week by over 21,000 contracts, another positive development. The date on the COT is October 25, before the drop that was seen on Friday but included gains earlier in the week.
Source: www.stockcharts.com
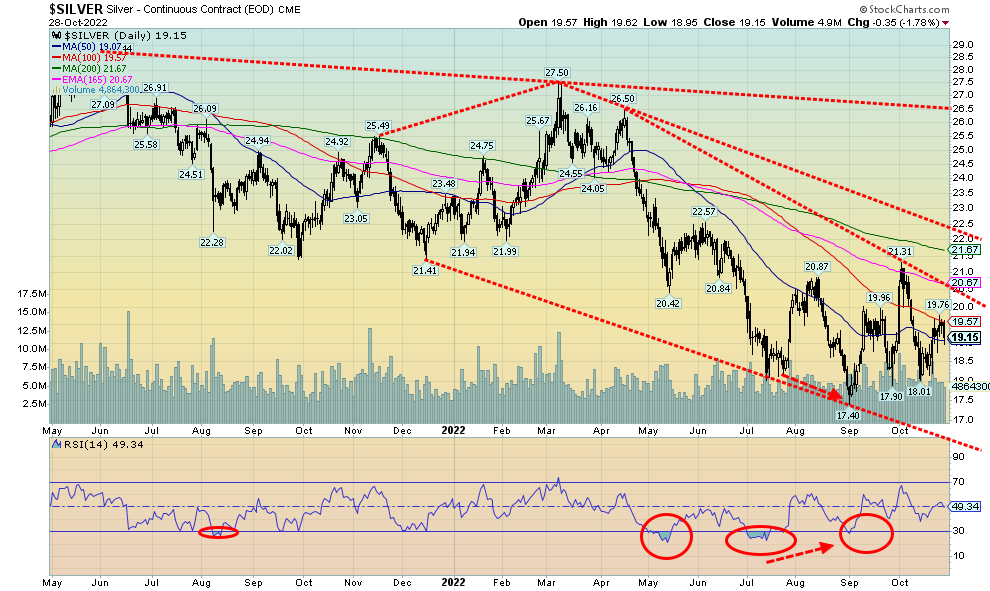
While the drop for PMs at the end of the week pushed gold into negative territory, silver held its gains to finish up 0.4%. Silver has an awkward-looking chart. Overall, we view the chart as bullish as silver builds what appears as a bottom pattern dating back to July. The breakout should be to the upside. On the bearish side the recent configuration looks a little like a top pattern, but with the September low ($17.90) below the October low ($18.01), the likelihood is it is not a top. Still, we’d be concerned if silver fell back below $18. To the upside, silver must take out $20.65 and then above $22.50 to tell us that a low is confirmed and we could get a more meaningful rally underway. Silver stocks at the COMEX are low, but as they note there are not a lot of requests for delivery. Demand for coins has been quite high and the premiums could be considered outrageous. At SilverGoldBull (www.silvergoldbull.ca), a 1-oz silver maple leaf for 2022 being released by the Canadian mint is offered at a huge 46% premium to spot. A glance through other issues confirms that, while one can get lower premiums overall, they are high particularly for silver compared to gold. High premiums and even shortages in some countries are being reported. Despite the seemingly weak price for silver, the shortages, the current COT, and other demands continue to suggest to us that it is when silver prices break out to the upside, not if. Those three successive higher lows ($17.40, $17.90, $18.01) are also encouraging. Now we need a higher high taking out the September high of $21.31. We also note that silver never made new lows on its recent moves lower, unlike gold which did. That’s a positive divergence. The next move for silver should be up.
Source: www.cotpricecharts.com
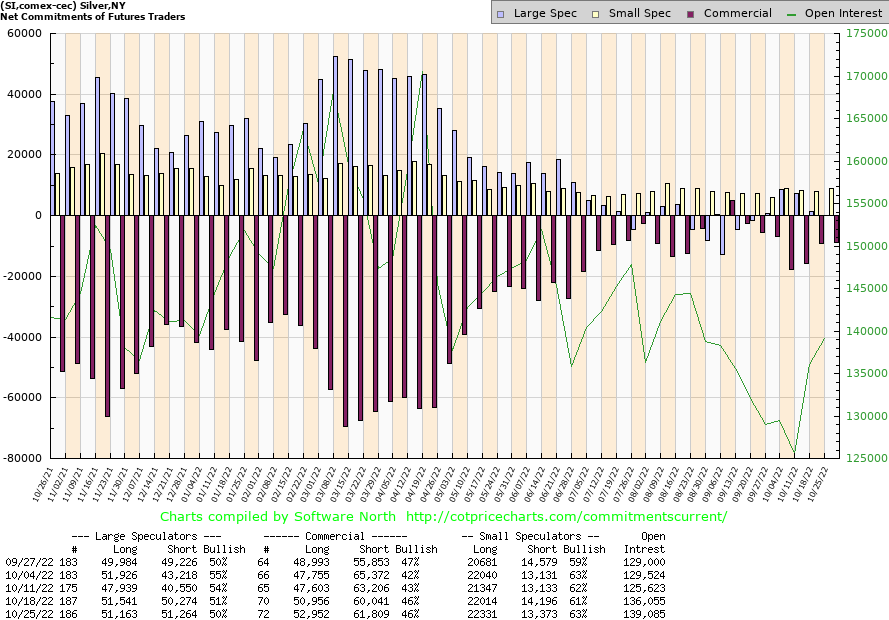
The commercial COT for silver was unchanged this past week at 46%. We continue to view that as bullish for silver going forward. Long open interest rose roughly 2,000 contracts while short open interest was also up about 1,800 contracts. The large speculators COT continues to act bearish as it slipped to 50% from 51%. Large speculators increased their short position by roughly 1,000 contracts while their long position only fell about 500 contracts. Silver continues to look bullish from the COT’s perspective.
Source: www.stockcharts.com
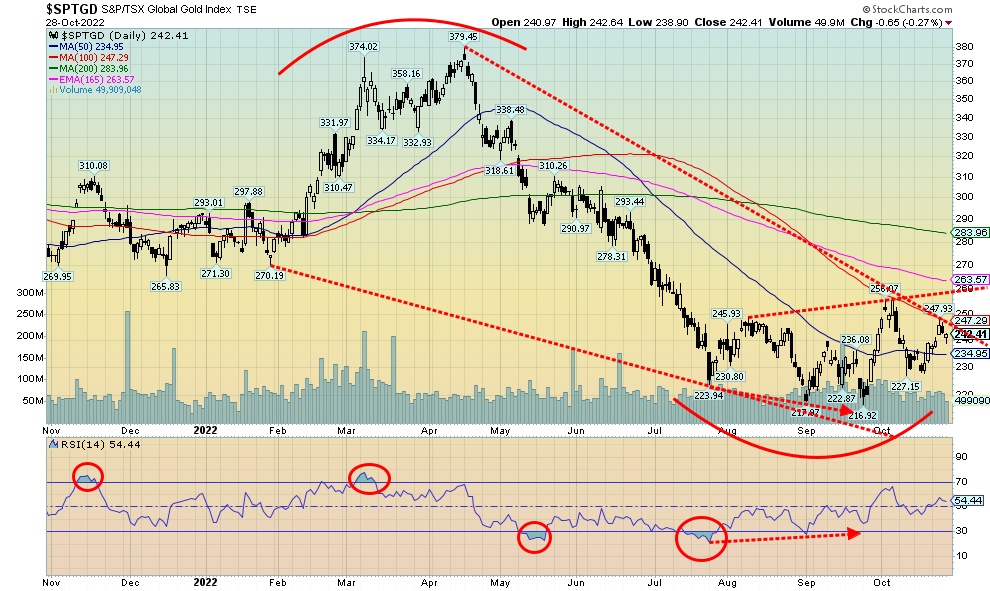
Despite a softening in prices in the latter part of the week, the gold stock indices managed to gain this past week. The TSX Gold Index (TGD) rose 1.5% while the Gold Bugs Index (HUI) was up 1.4%. Friday’s drop in gold prices initially pushed the gold stocks lower, but the end of the day strong buying in the broader market helped bring both the TGD and the HUI back towards unchanged. That could be a bullish sign going into the coming week. The TGD is still trying to break out of its downtrend line from the March top. Resistance is just above at the 100-day MA (247). Once above that level the next resistance level would be seen near 265, then up to 285 and the 200-day MA. There is a bit of a descending wedge look to the downtrend, so if the technicals are correct, once through 300 we could challenge the March 2022 top near 379. Only above 340 would we feel assured that we should see new highs. We appear to have a nice bottoming pattern in place so the breakout could be key. If we hold above the recent low of 227, the trend should shift more firmly to the upside. Sentiment is still quite low for the gold stocks, but it has been improving.
Source: www.stockcharts.com
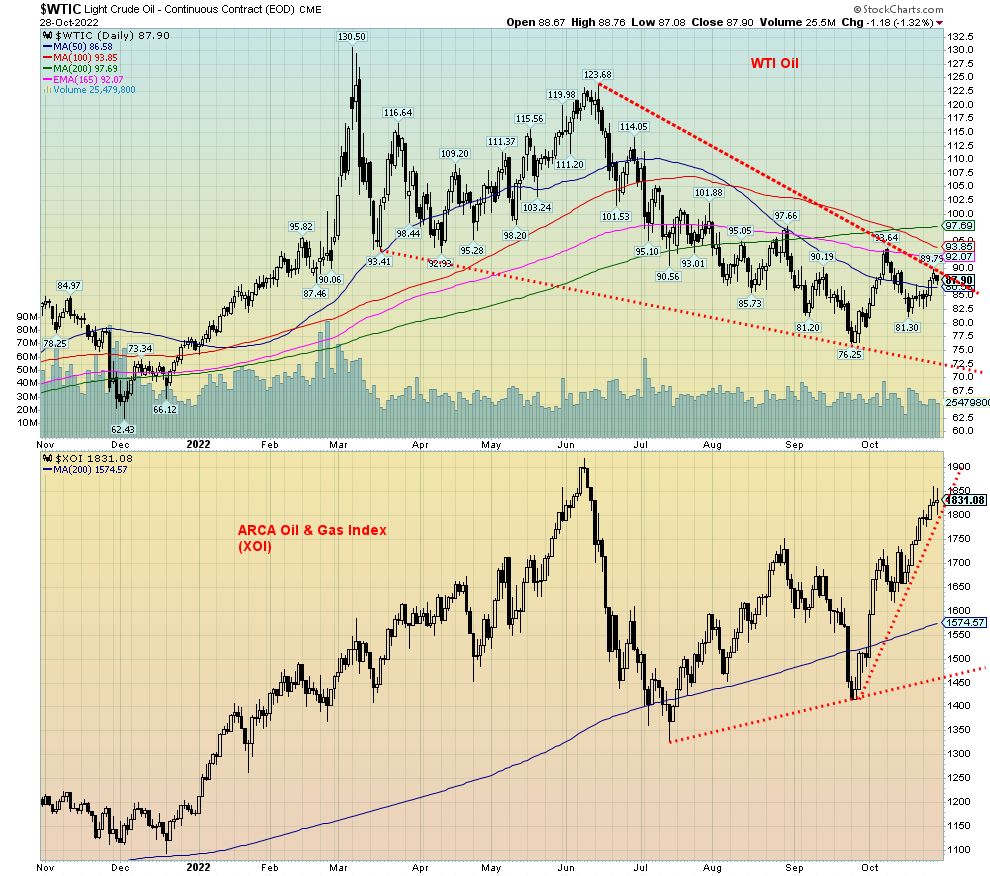
Oil prices bounced back again this week as WTI oil jumped almost $3 or 3.5%. Judging from the earnings reports coming out for the oil companies they also jumped, reporting earnings above expectations and resulting in increased dividends and share buybacks (which helps push the stock price higher). The ARCA Oil & Gas Index (XOI)—no surprise—rose 2.1% this past week while the TSX Energy Index (TEN) was up 2.7%. Natural gas (NG) jumped a sharp 14.5% as demand for LNG gas leaped in North America. NG in the EU at the Dutch Hub softened, falling 1.2%. NG in North America is up 52.3% in 2022 while in the EU it is up 59.6%.
A crisis continues to develop in the UK because of high NG prices. The chart below from Geopolitical Futures is emblematic of the crisis facing the UK. According to the article, some 2.3 million UK households are already behind on their electricity bills and 1.9 million behind on their gas bills. Prices are up 70% on the year. It is not just musical chairs for the Prime Minister and a sinking gilt and pound market—energy costs are going through the roof. Former PM Truss tried to cap energy prices, but the cost was astronomical, estimated at between $70 to $175 billion. The newest PM has decided that, instead of the program expiring in 2024, it will now expire in April 2023. Given all the households under water already, that could spark social unrest.
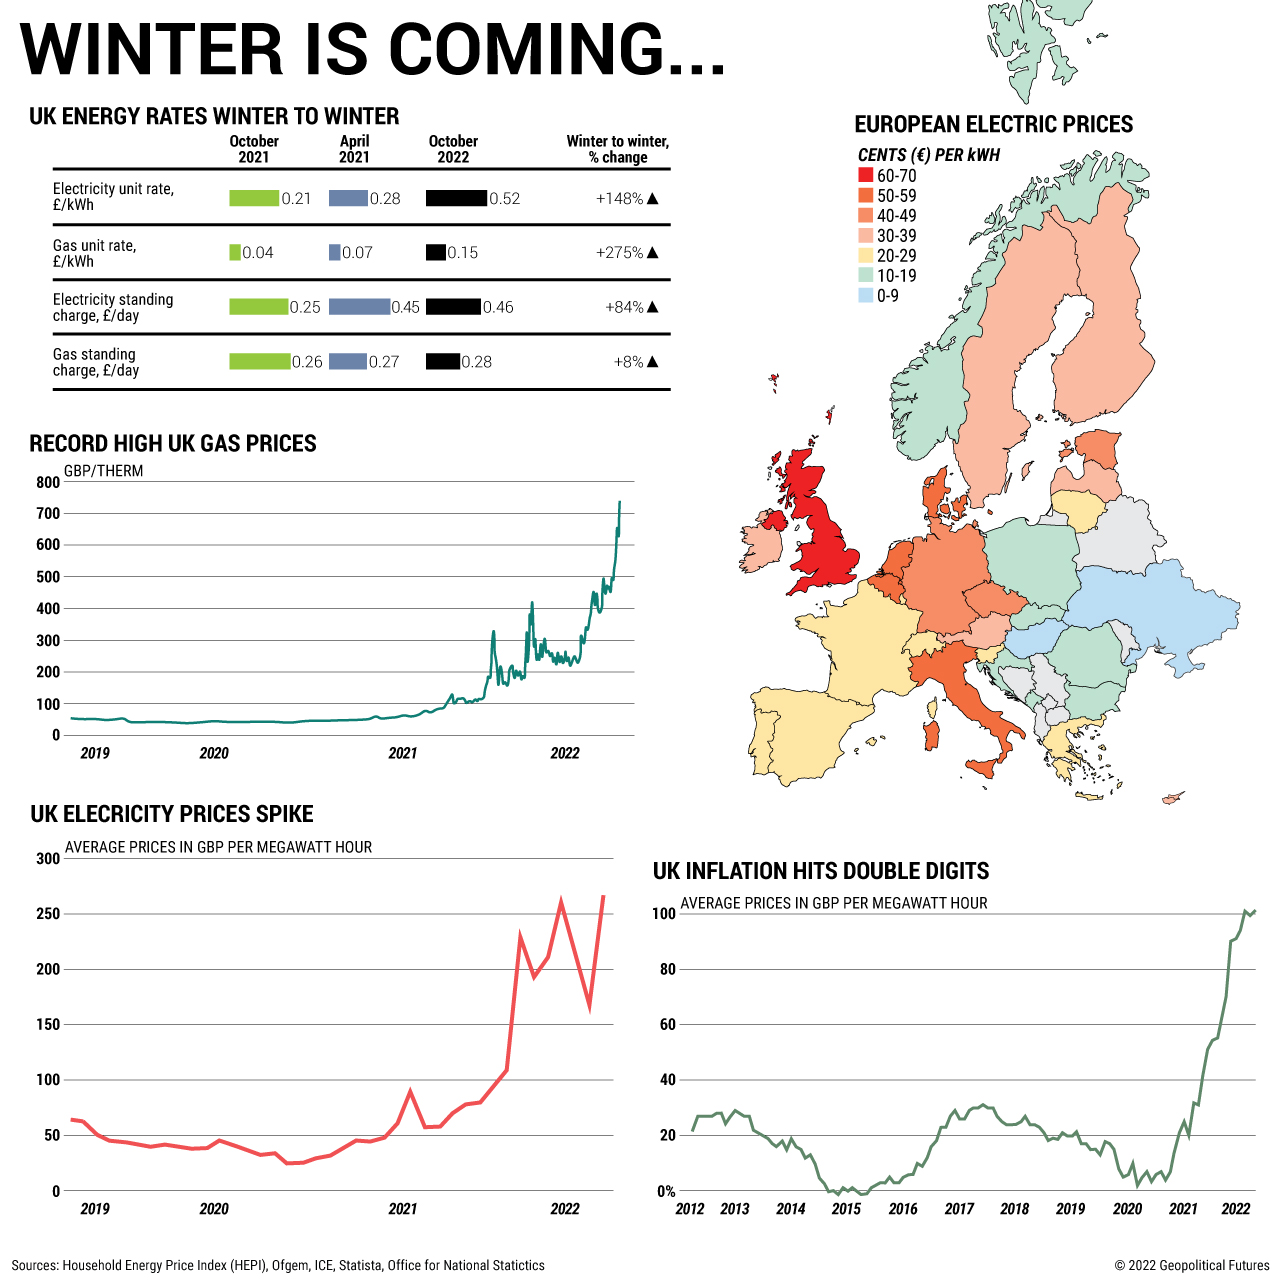
Source: www.geopoliticalfutures.com
The war continues in Ukraine and, given all the power outages from bombing the grid, it could be a cold winter there. As well, Russia’s inability to obtain important parts for maintenance of pipelines because of sanctions could spark a jump in bursting pipelines. That in turn could help push oil and gas prices higher again. Meanwhile, in the Middle East there remains risk due to the deteriorating relationship between the U.S. and Saudi Arabia. As well, there remains risk related to Iran from those who would like to attack Iran because of its sales of killer drones to Russia. None of this would be good for oil prices.
Gasoline stocks continue to deteriorate in the U.S., particularly for diesel. In turn, that could lead to higher prices once again this winter. Technically, oil prices are still trying to break out over $90. Once over $90, the next resistance zone would be $92. The major breakout would occur over $98. If WTI oil stays above $80, the trend is up and should go higher. While the XOI has passed the point that might suggest new highs lie just ahead, the TEN hasn’t quite passed that point just yet. Nonetheless, with our outlook that oil and NG prices are most likely headed higher as we enter the winter season when energy prices tend to surge, that feeds back into the energy stocks that are also expected to move higher going forward. It is promising to be a chilly winter. But a warm one if you own energy stocks.
Copyright David Chapman, 2022
|
GLOSSARY Trends Daily – Short-term trend (For swing traders) Weekly – Intermediate-term trend (For long-term trend followers) Monthly – Long-term secular trend (For long-term trend followers) Up – The trend is up. Down – The trend is down Neutral – Indicators are mostly neutral. A trend change might be in the offing. Weak – The trend is still up or down but it is weakening. It is also a sign that the trend might change. Topping – Indicators are suggesting that while the trend remains up there are considerable signs that suggest that the market is topping. Bottoming – Indicators are suggesting that while the trend is down there are considerable signs that suggest that the market is bottoming. |
David Chapman is not a registered advisory service and is not an exempt market dealer (EMD) nor a licensed financial advisor. He does not and cannot give individualised market advice. David Chapman has worked in the financial industry for over 40 years including large financial corporations, banks, and investment dealers. The information in this newsletter is intended only for informational and educational purposes. It should not be construed as an offer, a solicitation of an offer or sale of any security. Every effort is made to provide accurate and complete information. However, we cannot guarantee that there will be no errors. We make no claims, promises or guarantees about the accuracy, completeness, or adequacy of the contents of this commentary and expressly disclaim liability for errors and omissions in the contents of this commentary. David Chapman will always use his best efforts to ensure the accuracy and timeliness of all information. The reader assumes all risk when trading in securities and David Chapman advises consulting a licensed professional financial advisor or portfolio manager such as Enriched Investing Incorporated before proceeding with any trade or idea presented in this newsletter. David Chapman may own shares in companies mentioned in this newsletter. Before making an investment, prospective investors should review each security’s offering documents which summarize the objectives, fees, expenses and associated risks. David Chapman shares his ideas and opinions for informational and educational purposes only and expects the reader to perform due diligence before considering a position in any security. That includes consulting with your own licensed professional financial advisor such as Enriched Investing Incorporated. Performance is not guaranteed, values change frequently, and past performance may not be repeated.
About the author


Website: https://www.enrichedinvesting.com
Disclaimer: David Chapman is not a registered advisory service and is not an exempt market dealer (EMD) nor a licensed financial advisor. We do not and cannot give individualised market advice. David Chapman has worked in the financial industry for over 40 years including large financial corporations, banks, and investment dealers. The information in this newsletter is intended only for informational and educational purposes. It should not be considered a solicitation of an offer or sale of any security. The reader assumes all risk when trading in securities and David Chapman advises consulting a licensed professional financial advisor before proceeding with any trade or idea presented in this newsletter. David Chapman may own shares in companies mentioned in this newsletter. We share our ideas and opinions for informational and educational purposes only and expect the reader to perform due diligence before considering a position in any security. That includes consulting with your own licensed professional financial advisor.