
"Importantly, in the 1930s, in the Great Depression, the Federal Reserve, despite its mandate, was quite passive and, as a result, financial crisis became very severe, lasted essentially from 1929 to 1933."
- Ben Bernanke, American economist, 14th Chair of the Federal Reserve 2006-2014, distinguished fellow of the Brookings Institute; b. 1953
"After the war, Prohibition was passed, and with liquor no longer legally available the nation plunged headlong into the Great Depression."
- Dave Barry, American author, columnist of syndicated humour for the Miami Herald 1983-2005, author of numerous books on humour, parody, comic novels, children’s novels; b. 1947
“Bernanke has cultivated this idea that he is a brilliant scholar of The Great Depression, but that’s not true at all.”
- David Stockman, American politician, businessman, Republican representative 1977-1981, Director of Office of Management and Budget 1981-1985, columnist; b. 1946
As was widely expected inflation in July cooled from June. Commodity prices, particularly oil topped out for the most part in June and started coming down leading to forecasts that the CPI would drop in July. It did, going from 9.1% in June to 8.5% in July. That was better than the expected 8.7%. The core inflation (ex food and energy) rate didn’t change coming in once again at 5.9%. However, that was better than the expected 6.1%. PPI also fell to 9.8% y-o-y down from 11.3%. That didn’t change one thing as real GDP has continued to fall against the backdrop of rising inflation. Stagflation anyone?
U.S. CPI vs. Real GDP % Change from Year Ago 1948-2022
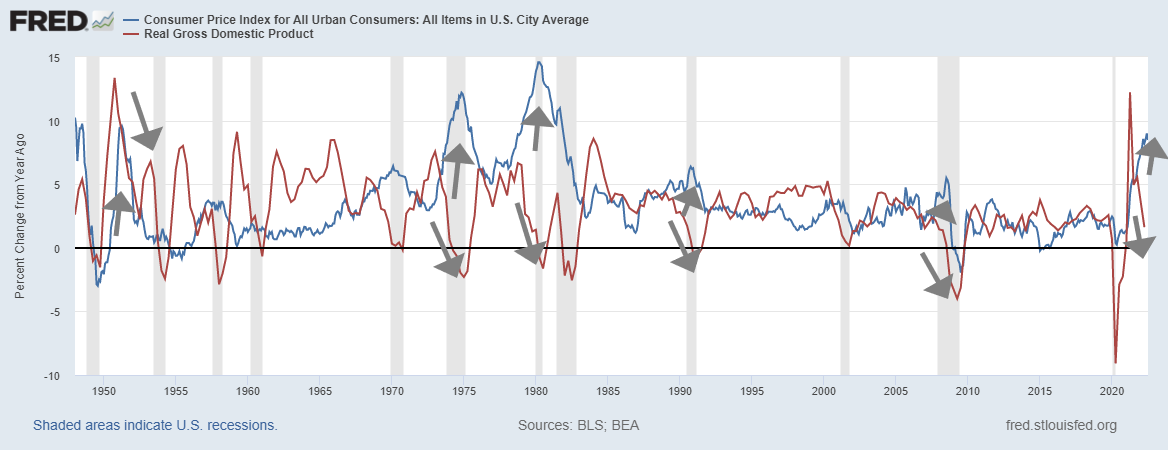
Source: www.stlouisfed.org
That real GDP is falling in the face of rising inflation is no surprise. After all, every period of rising inflation over the past 70 years has resulted in falling real GDP as the chart above shows. Technically the U.S. is already in a recession given two consecutive quarters of negative GDP. Officially however, you won’t hear the word recession uttered by anyone in a high position i.e., Joe Biden, Janet Yellen, Jerome Powell etc. because such talk is verboten until the authorities such as the Bureau of Economic Analysis (BEA) or the National Bureau of Economic Research (NBER) weigh in and say we are in an official recession. It is also not going to sway the Fed to suddenly start easing. Another 50 bp hike is targeted for September with a further 25 bp in each of November and December. Fed officials continue to weigh on the side of tightening to squeeze out inflation.
While it appears that inflation has temporarily topped it doesn’t mean it’s over immediately. Prices can dis-inflate slowly while staying high. Money supply growth has slowed. Note M2 below. M1 money supply has seen its growth slow even more. The Fed’s balance sheet growth has also slowed sharply. While it may be surprising the growth of Federal debt has also slowed. Disinflation could become the narrative as money and debt growth slow. If China’s COVID lockdowns were to stop or even be cut back then that could also help slow inflation pressures. Not surprisingly we’ve seen bond yields fall even as short-term yields rise thus leading to the negative spreads we are currently seeing. Negative spreads with up to a 10-month lag are usually seen as prerequisite for a recession.
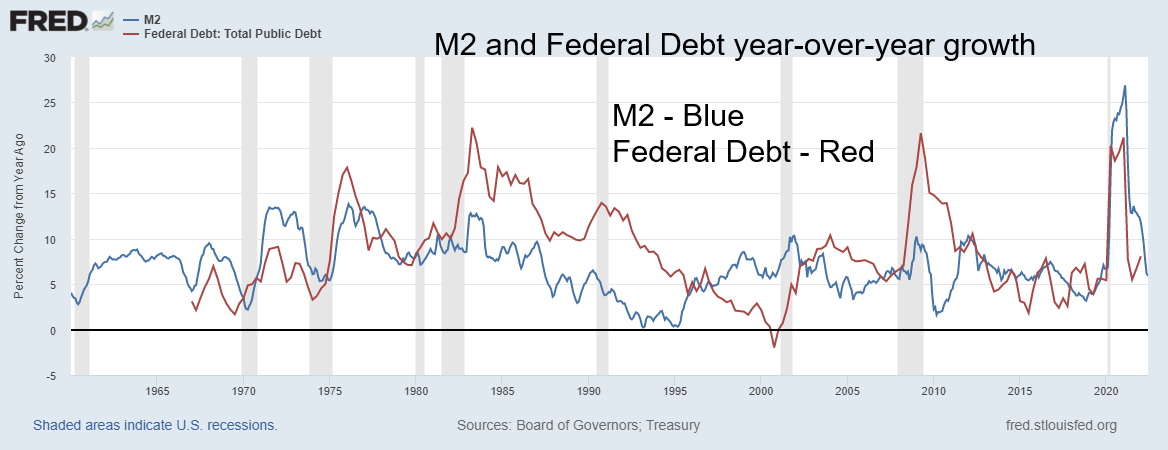
Source: www.stlouisfed.org
The markets loved the lower numbers as the Dow Jones Industrial (DJI) shot up 500 points, the US$ Index fell sharply and gold rose albeit not a lot. Couple the good news with the higher-than-expected nonfarm payrolls, the lowest unemployment rate (U3) since February 2020 and that the U.S. finally recouped all of the job losses from the short-lived but deep pandemic recession of 2020 and there were smiles all around. Risk taking abounds once again as tech and growth stocks surged while value stocks pulled back. So, should we all be cheering?
Well maybe not so fast. The war in Ukraine is still raging even as wheat shipments have finally started going through; China is conducting war games around Taiwan and has hinted that some kind of military operation will continue; Russia is curtailing energy sales to the EU and upward pressure continues on natural gas (NG)
prices; the pandemic has slowed but is still an ongoing concern; inflation is worldwide due to higher energy prices and energy shortages and significant supply disruptions; and, there remains the potential for a food crisis particularly in Africa where millions are at risk due to famine conditions.
This NG chart looks quite bullish. Is that a large reverse head and shoulders pattern forming? If correct a firm breakout above $9.50 could propel NG prices in North America to $13.50/$14.00. NG prices at the Dutch Hub already near record levels could be propelled even higher. The energy wars are not going away.
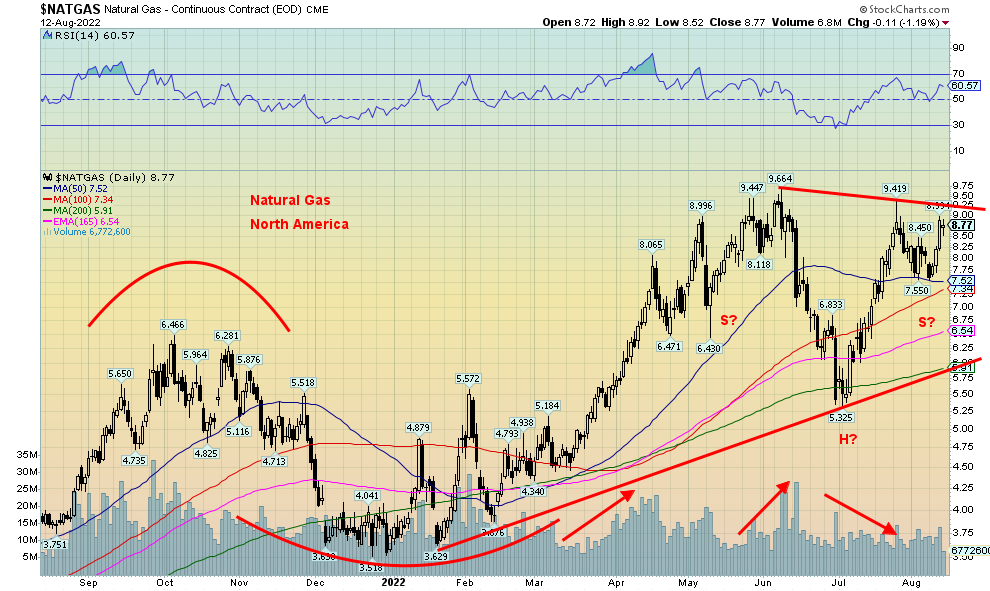
Source: www.stockcharts.com
Abnormally high temperatures are prevalent throughout parts of the U.S., across the EU, all through North Africa, the Mid-East, India, China and Australia. Serious drought conditions are prevalent in the Southwest U.S., parts of the EU (the Rhine River, a major transportation conduit, is drying up), Northern Africa, West Africa, Southern Africa, the Mid-East, Central Asia, India, Mongolia, Russia and Ukraine, and, parts of China. Water, or a lack of it, is becoming a serious concern in some place. But floods are also a problem in parts of the U.S. and China. Wildfires are also prevalent in Western Canada down into California and parts of Europe. We’ve also learned that the Arctic polar ice caps are melting at a rate faster than scientists expected.
We now need to add what could turn out to be potentially the most dangerous threat to global markets and the U.S. dollar going forward. Given the issuance of search warrants at former president Donald Trump’s home at Mar-a-Lago, Florida there is now a real possibility of civil unrest in the U.S. That could heighten further if
Trump was indicted over the January 6, 2021 insurrection. Couple that with the deep divide between so called “Red States” and “Blue States” state secession becomes a possibility. Both bond and stock markets would be shaken, the U.S. dollar could fall probably sharply, and, if that happens gold could soar. No, we are not advocating that any of this takes place but the fallout reaction has been swift threatening violence and assassinations in support of the former president.
Global shipping has been disrupted particularly out of Russia/Ukraine and in the South China Sea and around Taiwan. The Baltic Dry Index (BDI) an index of average prices paid for the transport of dry bulk materials across more than 20 routes, has been falling. The BDI is often viewed as a leading indicator of economic activity because changes in the index reflect supply and demand for important materials used in manufacturing. The BDI is currently falling and could be on the cusp of a breakdown from a topping pattern.
Baltic Dry Index 2002-2022 – On the Cusp of a Breakdown?
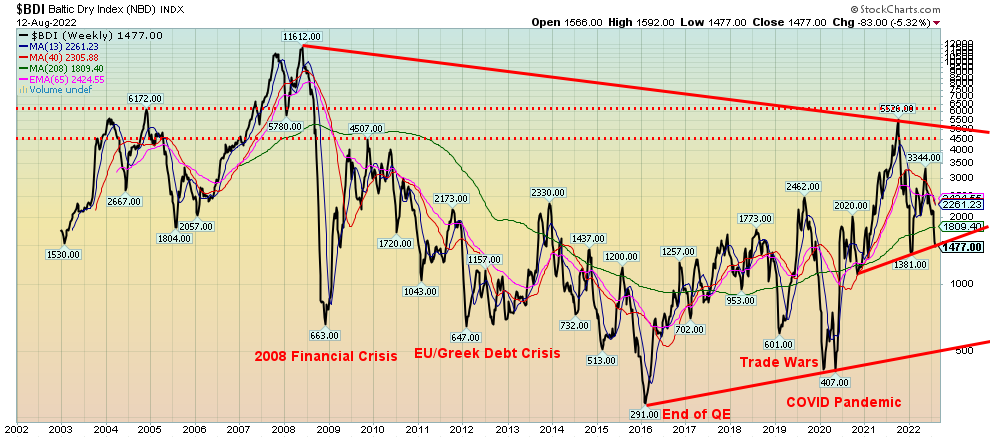
Source: www.stockcharts.com
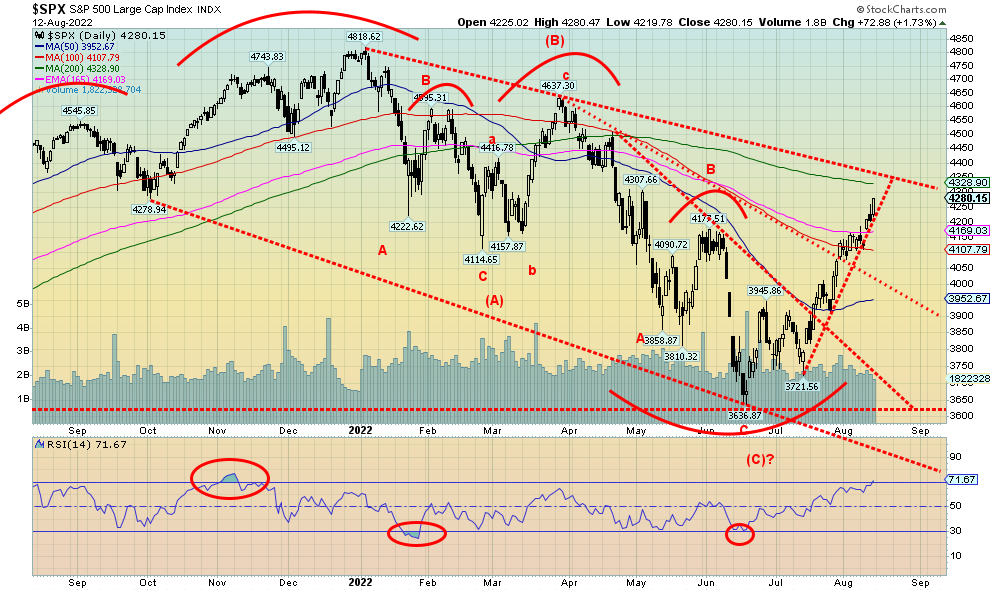
Markets have been in rally mode since bottoming in mid-June at the same time that commodity prices were topping. Since then, the S&P 500 has shot up almost 18%. The tech heavy NASDAQ is up over 23% potentially signaling that the bear market is over. The TSX has also rebounded up 11% but then the TSX did not fall as much as the U.S. indices. As our chart of the S&P 500 below shows, we are fast approaching the downward trend line from the January 2022 top. With the RSI now over 70 it is approaching overbought suggesting we could soon be headed for at least a temporary top. Caution is now advised. So far this bear market rally has
been normal but sentiment has rebounded sharply. Recent Investor’s Intelligence percent bears has rebounded sharply in favour of the bulls. Sentiment indicators such as the put/call ratio are once again soaring into overbought territory. Are the markets ahead of themselves?
Source: www.stockcharts.com
With inflation moderating and signs that the economy is slowing bond yields have been falling. A breakdown under 2.50% for the U.S. 10-year treasury note could signal a confirmation that bond yields have topped. But we are seeing other signs of slowing. The US$ Index could be in the early throes of a breakdown. The up trendline from lows in March have broken but the US$ Index has not yet cracked. The US$ Index is trading under the 50-day MA for the first time in months. Next up could be the rising 100-day MA currently at 103.30. While the 50-day MA has been broken we could still find support around here. The 200-day MA remains away currently near 100. There are signs now that the US$ Index may have topped.
If the US$ Index has topped that’s positive for gold and silver. Gold still has a lot of work to do in order to clear $1,880/$1,900. Above that level $2,000 comes into focus. Silver is also breaking out from its steep downtrend but has a lot more work to do. Over the past week the Gold/Silver ratio has been falling from lofty levels supporting silver leading the way. Silver has considerable resistance up to $23. We need to breakout over $24 to convince us that silver is on its way potentially towards $30.
Bond Yields are Falling
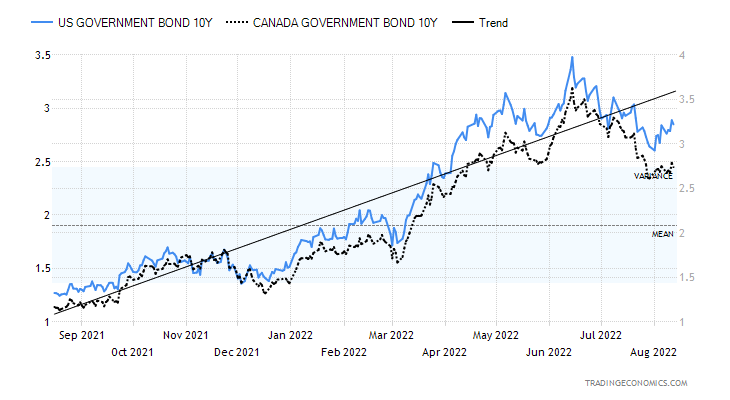
Source: www.tradingeconomics.com, www.home.treasury.gov, www.bankofcanada.ca
The US$ Index is breaking down?
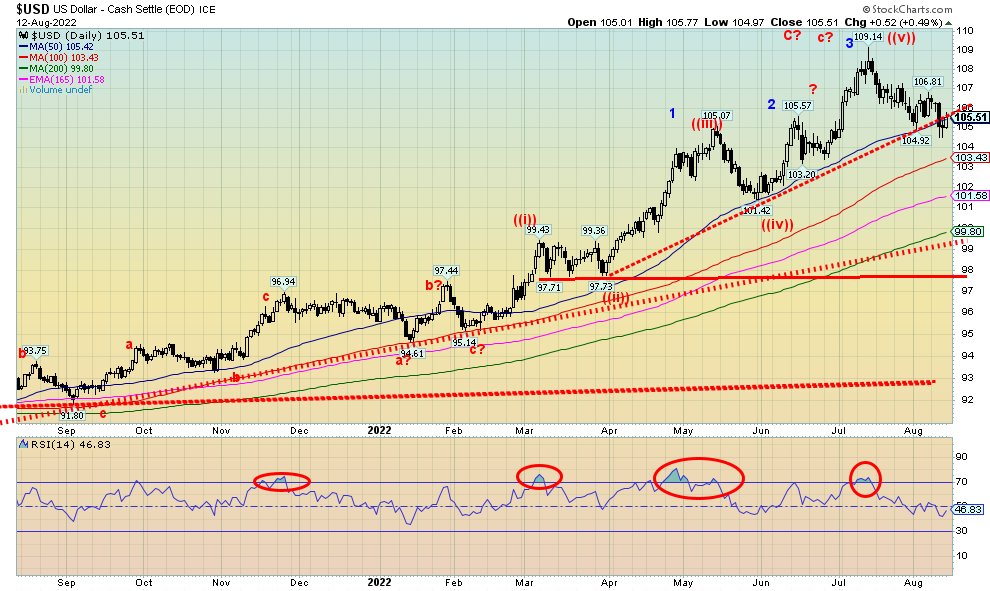
Source: www.stockcharts.com
Precious Metals – Gold and Silver are breaking out
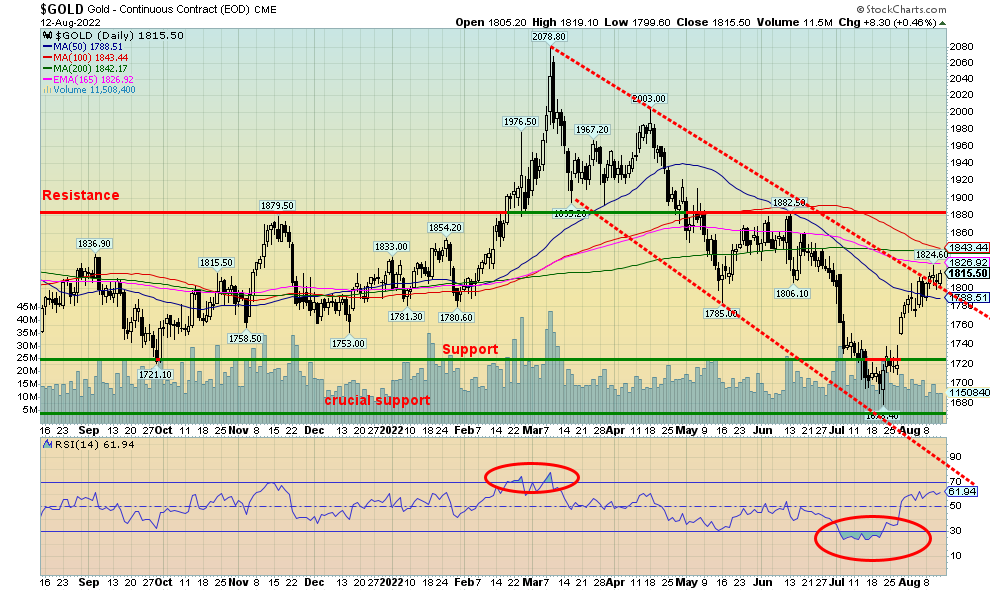
Source: www.stockcharts.com
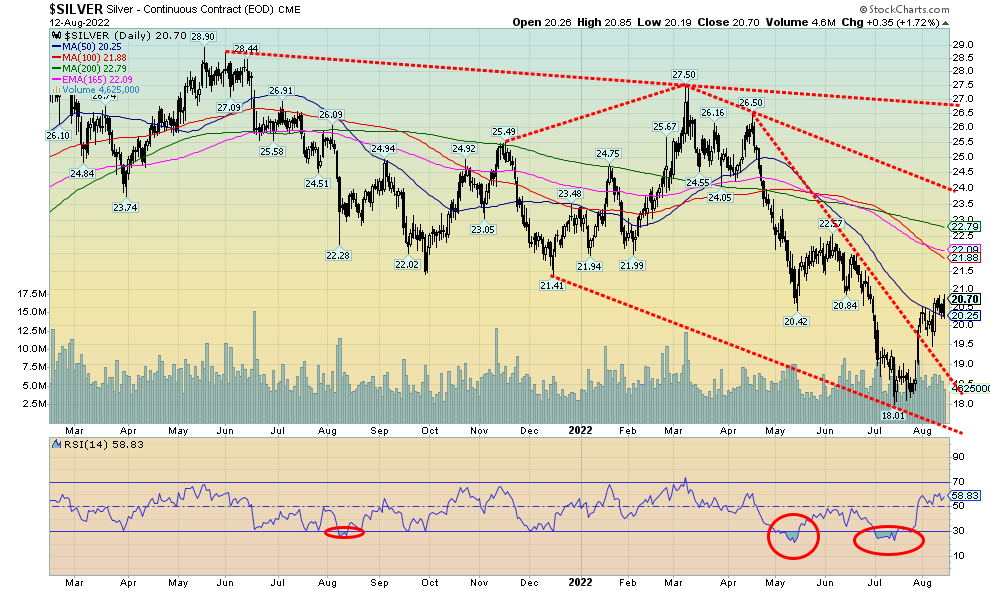
Source: www.stockcharts.com
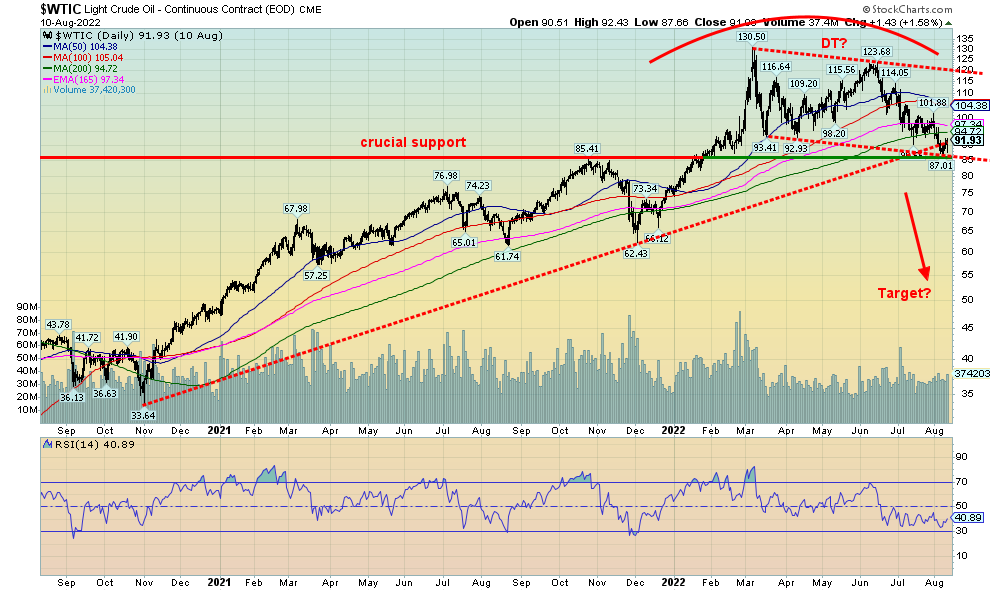
Commodity prices (oil) have been falling. But oil needs to breakdown under $85 to suggest further declines and potential targets much lower. Otherwise, oil could find support here and start to rise again. Downside follow through from what might be a double top has been feeble so far putting the double top scenario in doubt. All we may be witnessing instead is the formation of a gentle sloping bear channel.
Source: www.stockcharts.com
One area we haven’t noted is the housing market. Housing inflation is actually a big problem. Prices have shot up on the back of cheap low interest mortgage rates and a low supply of new housing. But now things are starting to go against the housing market. Rising interest rates have sent sales and prices tumbling. No, it has not yet turned into a route. We’ve seen 10% declines already here in Toronto in some places and in King Township north of Toronto it has been reported that housing prices have plunged 50%. That is steep and may be a sign of things to come especially considering that neither the Bank of Canada (BofC) or the Fed are finished with their interest rate hikes. Recent bank reports on the housing market are now suggesting at least a 25% decline in prices.
There is no easy panacea for bringing down the rate of inflation. Historically rising inflation has always resulted in sharply rising interest rates to try to quell inflation. Rising interest rates are the prerequisite to a recession. The Fed and the BofC are hoping for a soft landing. What they’ll probably get is a hard landing. Couple that with supply disruptions that are not going to go away, continuation of the war in Ukraine that could still spread, the conflict between the U.S. and China over Taiwan and the unknown potential of civil strife in the U.S. with regard to the former president. Add in other dangers such as Iran getting closer to having a nuclear bomb and Israel responding with an attack that could trigger a Mid-East war and the dangers keep rising. The ability of the monetary authorities to flood the system with liquidity and sharply lower interest rates once
again, is deeply constrained as that is what helped unleash some of the current problems in the first place. The real challenge is the supply side not necessarily the monetary side.
While commodity prices have fallen the real risk is that oil prices, while down, could spike again given an uptick in the Ukraine/Russia war or an attack on Iran. That oil prices have fallen has played a big role in inflation coming down this past month. But we are not what we would say out of the woods yet. There are signs of more danger down the road. Investors are advised to remain on the cautious side. And own some gold (real money).
Copyright David Chapman, 2022
Markets & Trends
|
|
|
|
% Gains (Losses) Trends |
|
||||
|
|
Close Dec 31/21 |
Close Aug 12/22 |
Week |
YTD |
Daily (Short Term) |
Weekly (Intermediate) |
Monthly (Long Term) |
|
|
Stock Market Indices |
|
|
|
|
|
|
|
|
|
`S&P 500 |
4,766.18 |
4,280.15 |
3.3% |
(10.2)% |
up |
neutral |
up |
|
|
Dow Jones Industrials |
36,333.30 |
33,761.05 |
2.9% |
(7.1)% |
up |
neutral |
up |
|
|
Dow Jones Transports |
16,478.26 |
15,146.7 |
3.7% |
(8.1)% |
up |
neutral |
up |
|
|
NASDAQ |
15,644.97 |
13,047.19 |
3.1% |
(16.6)% |
up |
neutral |
neutral |
|
|
S&P/TSX Composite |
21,222.84 |
20,179.81 |
2.9% |
(4.9)% |
up |
down |
up |
|
|
S&P/TSX Venture (CDNX) |
939.18 |
680.51 |
2.5% |
(27.5% |
up |
down |
down (weak) |
|
|
S&P 600 |
1,401.71 |
1,287.80 |
3.9% |
(8.1)% |
up |
neutral |
up |
|
|
MSCI World Index |
2,354.17 |
2,009.71 |
1.6% |
(14.6)% |
up |
down |
neutral |
|
|
NYSE Bitcoin Index |
47,907.71 |
23,838.59 |
2.6% |
(50.2)% |
up |
down |
neutral |
|
|
|
|
|
|
|
|
|
|
|
|
Gold Mining Stock Indices |
|
|
|
|
|
|
|
|
|
Gold Bugs Index (HUI) |
258.87 |
214.21 |
4.6% |
(17.3)% |
neutral |
down |
down |
|
|
TSX Gold Index (TGD) |
292.16 |
246.96 |
2.8% |
(15.5)% |
down |
down |
down |
|
|
|
|
|
|
|
|
|
|
|
|
Fixed Income Yields/Spreads |
|
|
|
|
|
|
|
|
|
U.S. 10-Year Treasury Bond yield |
1.52% |
2.85% |
0.7% |
87.5% |
|
|
|
|
|
Cdn. 10-Year Bond CGB yield |
1.43% |
2.74% |
flat |
91.6% |
|
|
|
|
|
Recession Watch Spreads |
|
|
|
|
|
|
|
|
|
U.S. 2-year 10-year Treasury spread |
0.79% |
(0.41)% |
flat |
(151.9)% |
|
|
|
|
|
Cdn 2-year 10-year CGB spread |
0.48% |
(0.50)% |
2.0% |
(204.2)% |
|
|
|
|
|
|
|
|
|
|
|
|
|
|
|
Currencies |
|
|
|
|
|
|
|
|
|
US$ Index |
95.59 |
105.51 |
(0.9)% |
10.4% |
down (weak) |
up |
up |
|
|
Canadian $ |
.7905 |
.7826 |
1.3% |
(1.0)% |
up |
down (weak) |
neutral |
|
|
Euro |
113.74 |
102.64 |
0.8% |
(9.8)% |
neutral |
down |
down |
|
|
Swiss Franc |
109.77 |
106.23 |
2.2% |
(3.2)% |
up |
neutral |
down (weak) |
|
|
British Pound |
135.45 |
121.42 |
0.8% |
(10.4)% |
neutral |
down |
down |
|
|
Japanese Yen |
86.85 |
74.94 |
1.2% |
(13.7)% |
up |
down |
down |
|
|
|
|
|
|
|
|
|
|
|
|
|
|
|
|
|
|
|
|
|
|
Precious Metals |
|
|
|
|
|
|
|
|
|
Gold |
1,828.60 |
1,815.50 |
1.4% |
(0.7)% |
up |
down (weak) |
neutral |
|
|
Silver |
23.35 |
20.70 |
4.3% |
(11.4)% |
up |
down |
down |
|
|
Platinum |
966.20 |
959.40 |
3.8% |
(0.7)% |
up |
down (weak) |
down |
|
|
|
|
|
|
|
|
|
|
|
|
Base Metals |
|
|
|
|
|
|
|
|
|
Palladium |
1,912.10 |
2,219.40 |
4.3% |
16.1% |
up |
up (weak) |
neutral |
|
|
Copper |
4.46 |
3.67 |
3.4% |
(17.8)% |
up (weak) |
down |
neutral |
|
|
|
|
|
|
|
|
|
|
|
|
Energy |
|
|
|
|
|
|
|
|
|
WTI Oil |
75.21 |
92.09 |
3.5% |
22.4% |
down |
neutral |
up |
|
|
Nat Gas |
3.73 |
8.77 |
8.8% |
135.1% |
up |
up |
up |
|
Source: www.stockcharts.com
Note: For an explanation of the trends, see the glossary at the end of this article.
New highs/lows refer to new 52-week highs/lows and, in some cases, all-time highs.
|
GLOSSARY Trends Daily – Short-term trend (For swing traders) Weekly – Intermediate-term trend (For long-term trend followers) Monthly – Long-term secular trend (For long-term trend followers) Up – The trend is up. Down – The trend is down Neutral – Indicators are mostly neutral. A trend change might be in the offing. Weak – The trend is still up or down but it is weakening. It is also a sign that the trend might change. Topping – Indicators are suggesting that while the trend remains up there are considerable signs that suggest that the market is topping. Bottoming – Indicators are suggesting that while the trend is down there are considerable signs that suggest that the market is bottoming. |
Disclaimer
David Chapman is not a registered advisory service and is not an exempt market dealer (EMD) nor a licensed financial advisor. He does not and cannot give individualised market advice. David Chapman has worked in the financial industry for over 40 years including large financial corporations, banks, and investment dealers. The information in this newsletter is intended only for informational and educational purposes. It should not be construed as an offer, a solicitation of an offer or sale of any security. Every effort is made to provide accurate and complete information. However, we cannot guarantee that there will be no errors. We make no claims, promises or guarantees about the accuracy, completeness, or adequacy of the contents of this commentary and expressly disclaim liability for errors and omissions in the contents of this commentary. David Chapman will always use his best efforts to ensure the accuracy and timeliness of all information. The reader assumes all risk when trading in securities and David Chapman advises consulting a licensed professional financial advisor or portfolio manager such as Enriched Investing Incorporated before proceeding with any trade or idea presented in this newsletter. David Chapman may own shares in companies mentioned in this newsletter. Before making an investment, prospective investors should review each security’s offering documents which summarize the objectives, fees, expenses and associated risks. David Chapman shares his ideas and opinions for informational and educational purposes only and expects the reader to perform due diligence before considering a position in any security. That includes consulting with your own licensed professional financial advisor such as Enriched Investing Incorporated. Performance is not guaranteed, values change frequently, and past performance may not be repeated.
About the author


Website: https://www.enrichedinvesting.com
Disclaimer: David Chapman is not a registered advisory service and is not an exempt market dealer (EMD) nor a licensed financial advisor. We do not and cannot give individualised market advice. David Chapman has worked in the financial industry for over 40 years including large financial corporations, banks, and investment dealers. The information in this newsletter is intended only for informational and educational purposes. It should not be considered a solicitation of an offer or sale of any security. The reader assumes all risk when trading in securities and David Chapman advises consulting a licensed professional financial advisor before proceeding with any trade or idea presented in this newsletter. David Chapman may own shares in companies mentioned in this newsletter. We share our ideas and opinions for informational and educational purposes only and expect the reader to perform due diligence before considering a position in any security. That includes consulting with your own licensed professional financial advisor.