
SP500
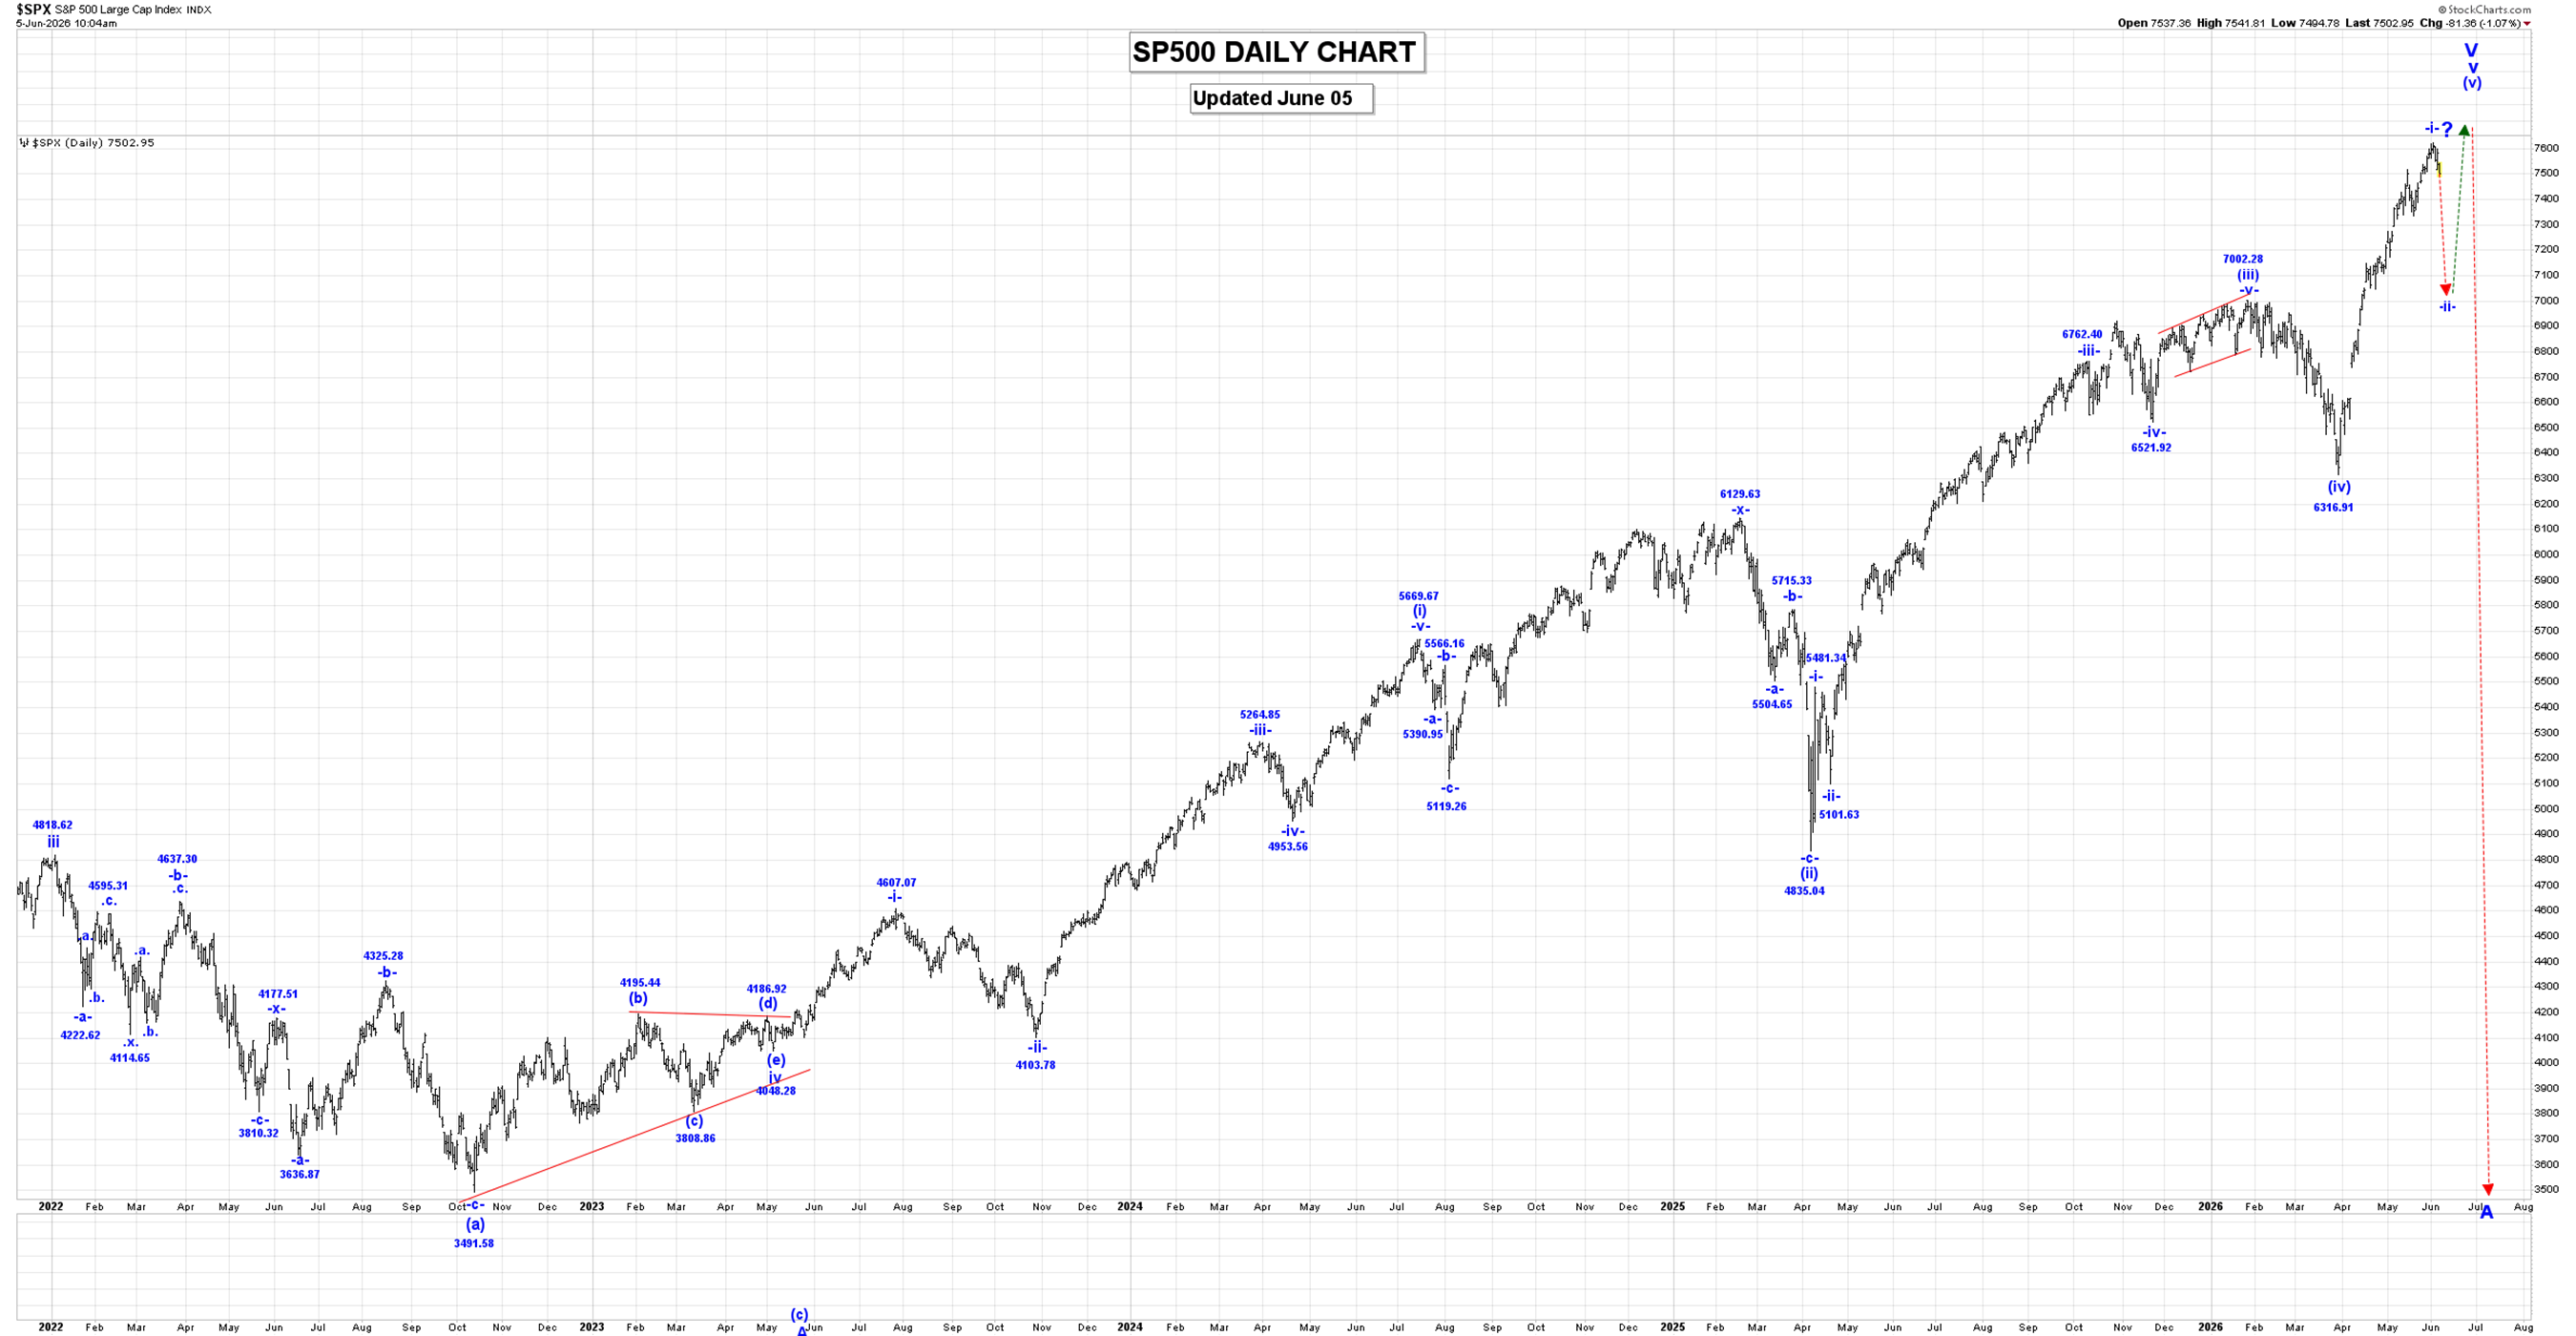
The Captain’s daily SP500 Chart.
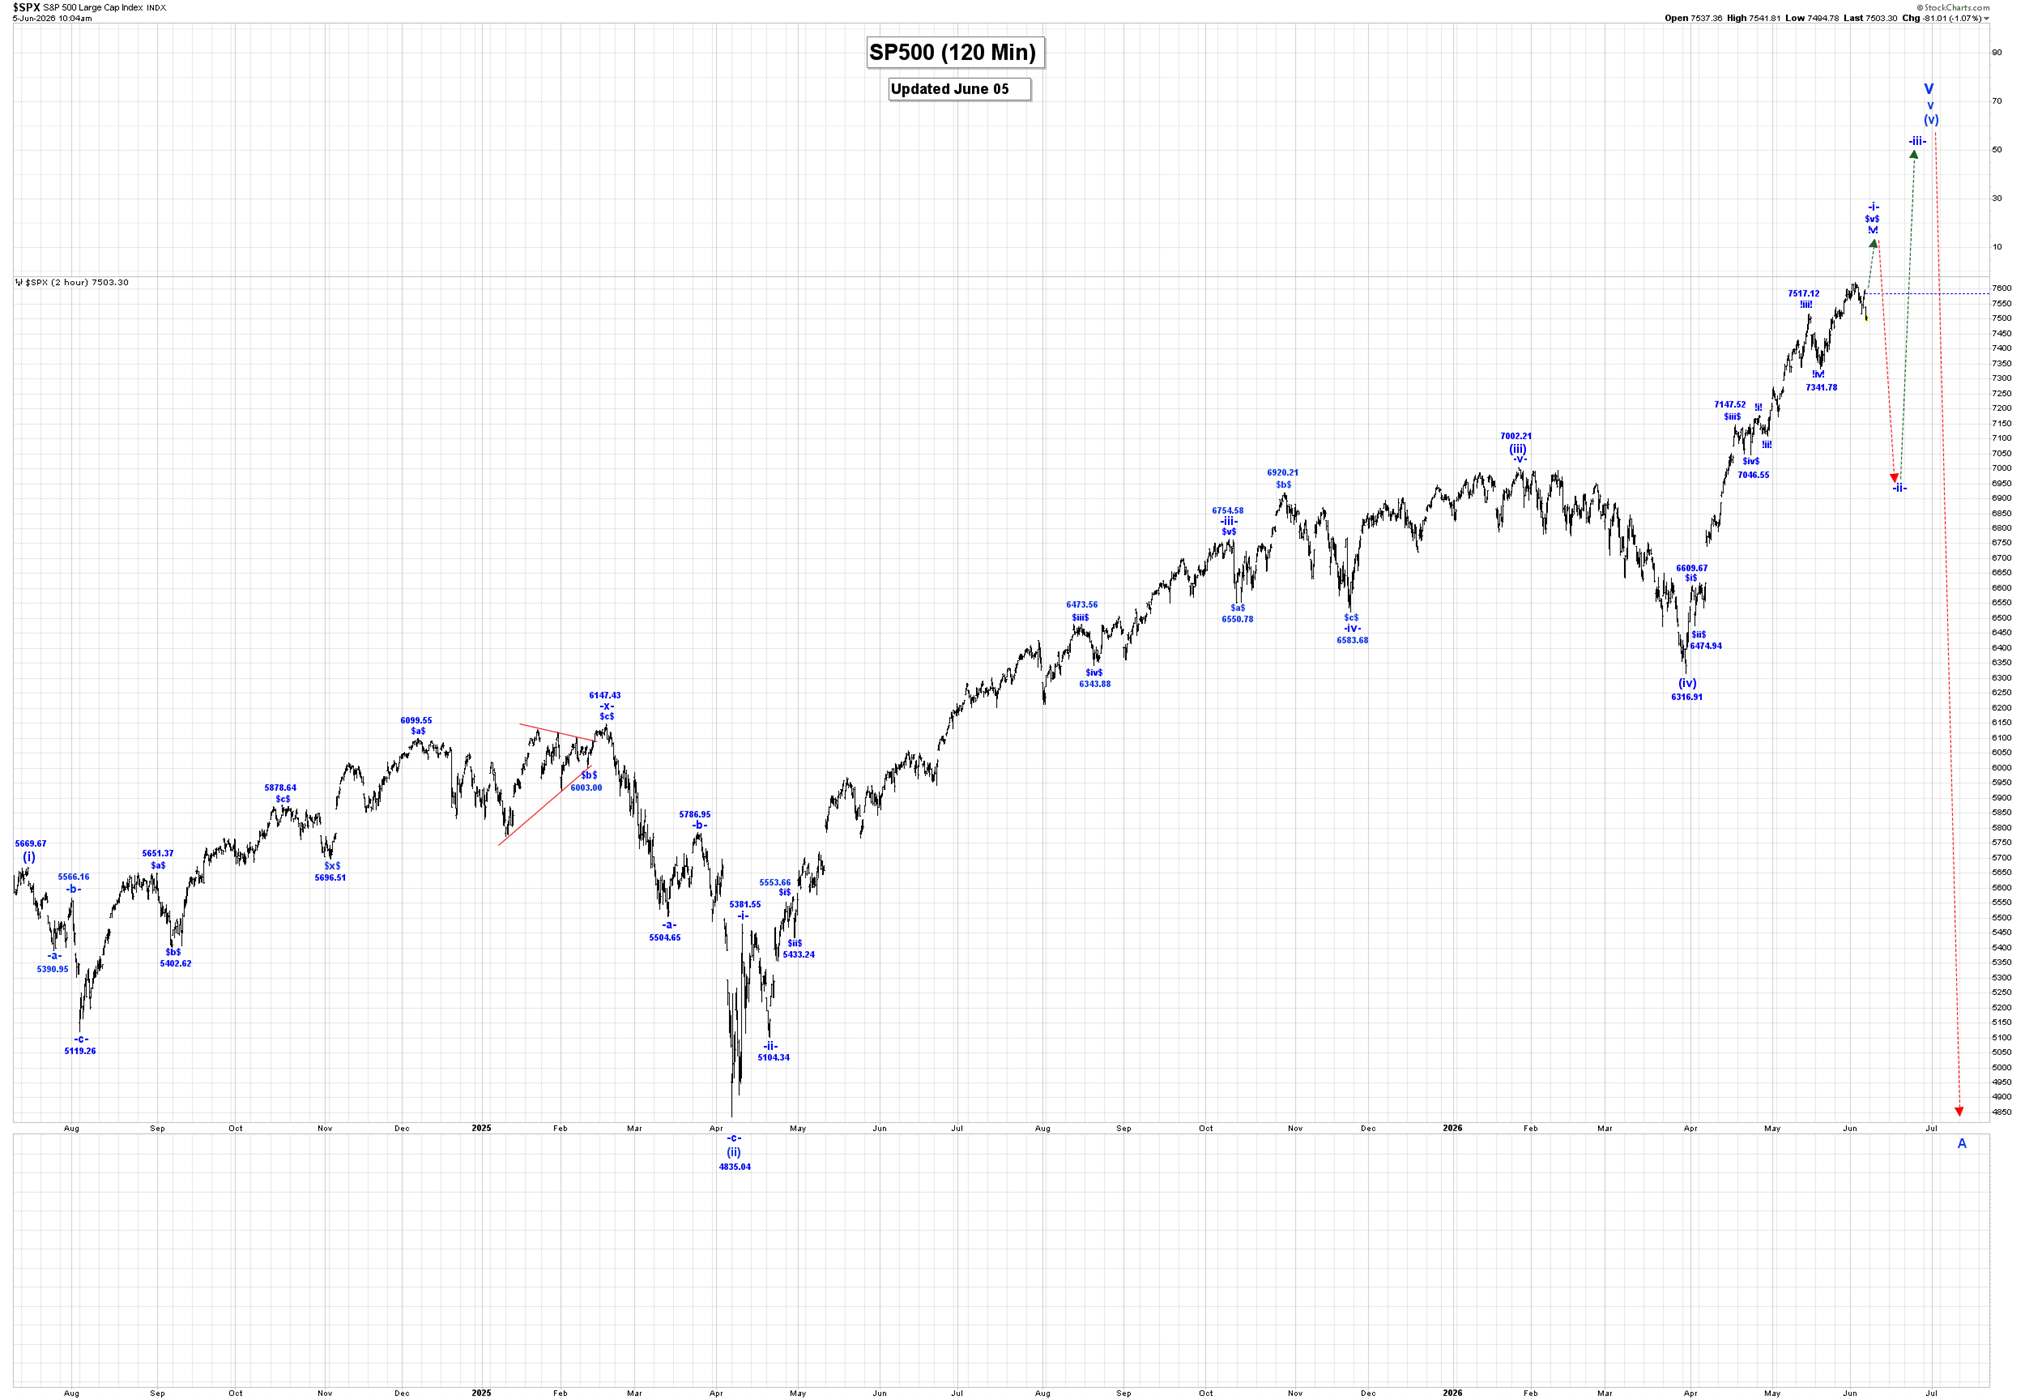
The Captain’s 120 Minute SP500 Chart.
Analysis:
We have updated our internal wave count for wave v as follows:
(i) = 5669.67.
(ii) = 4835.04.
(iii) = 7002.28.
(iv) = 63.1601.
(v):
-i- = 7620.90.
-ii- drop after wave -ii- ends.
As a minimum we completed wave -i- of (v) at the 7620.90 high and we are now falling in wave -ii-, which has the following retracement levels:
50% = 6968.46.
61.8% = 6814.48.
The other very bearish option is that all of wave (v), v and V are complete at the 7620.90 high and we have started a multi-year/decade bear market!
Active Positions: Flat!
Oil
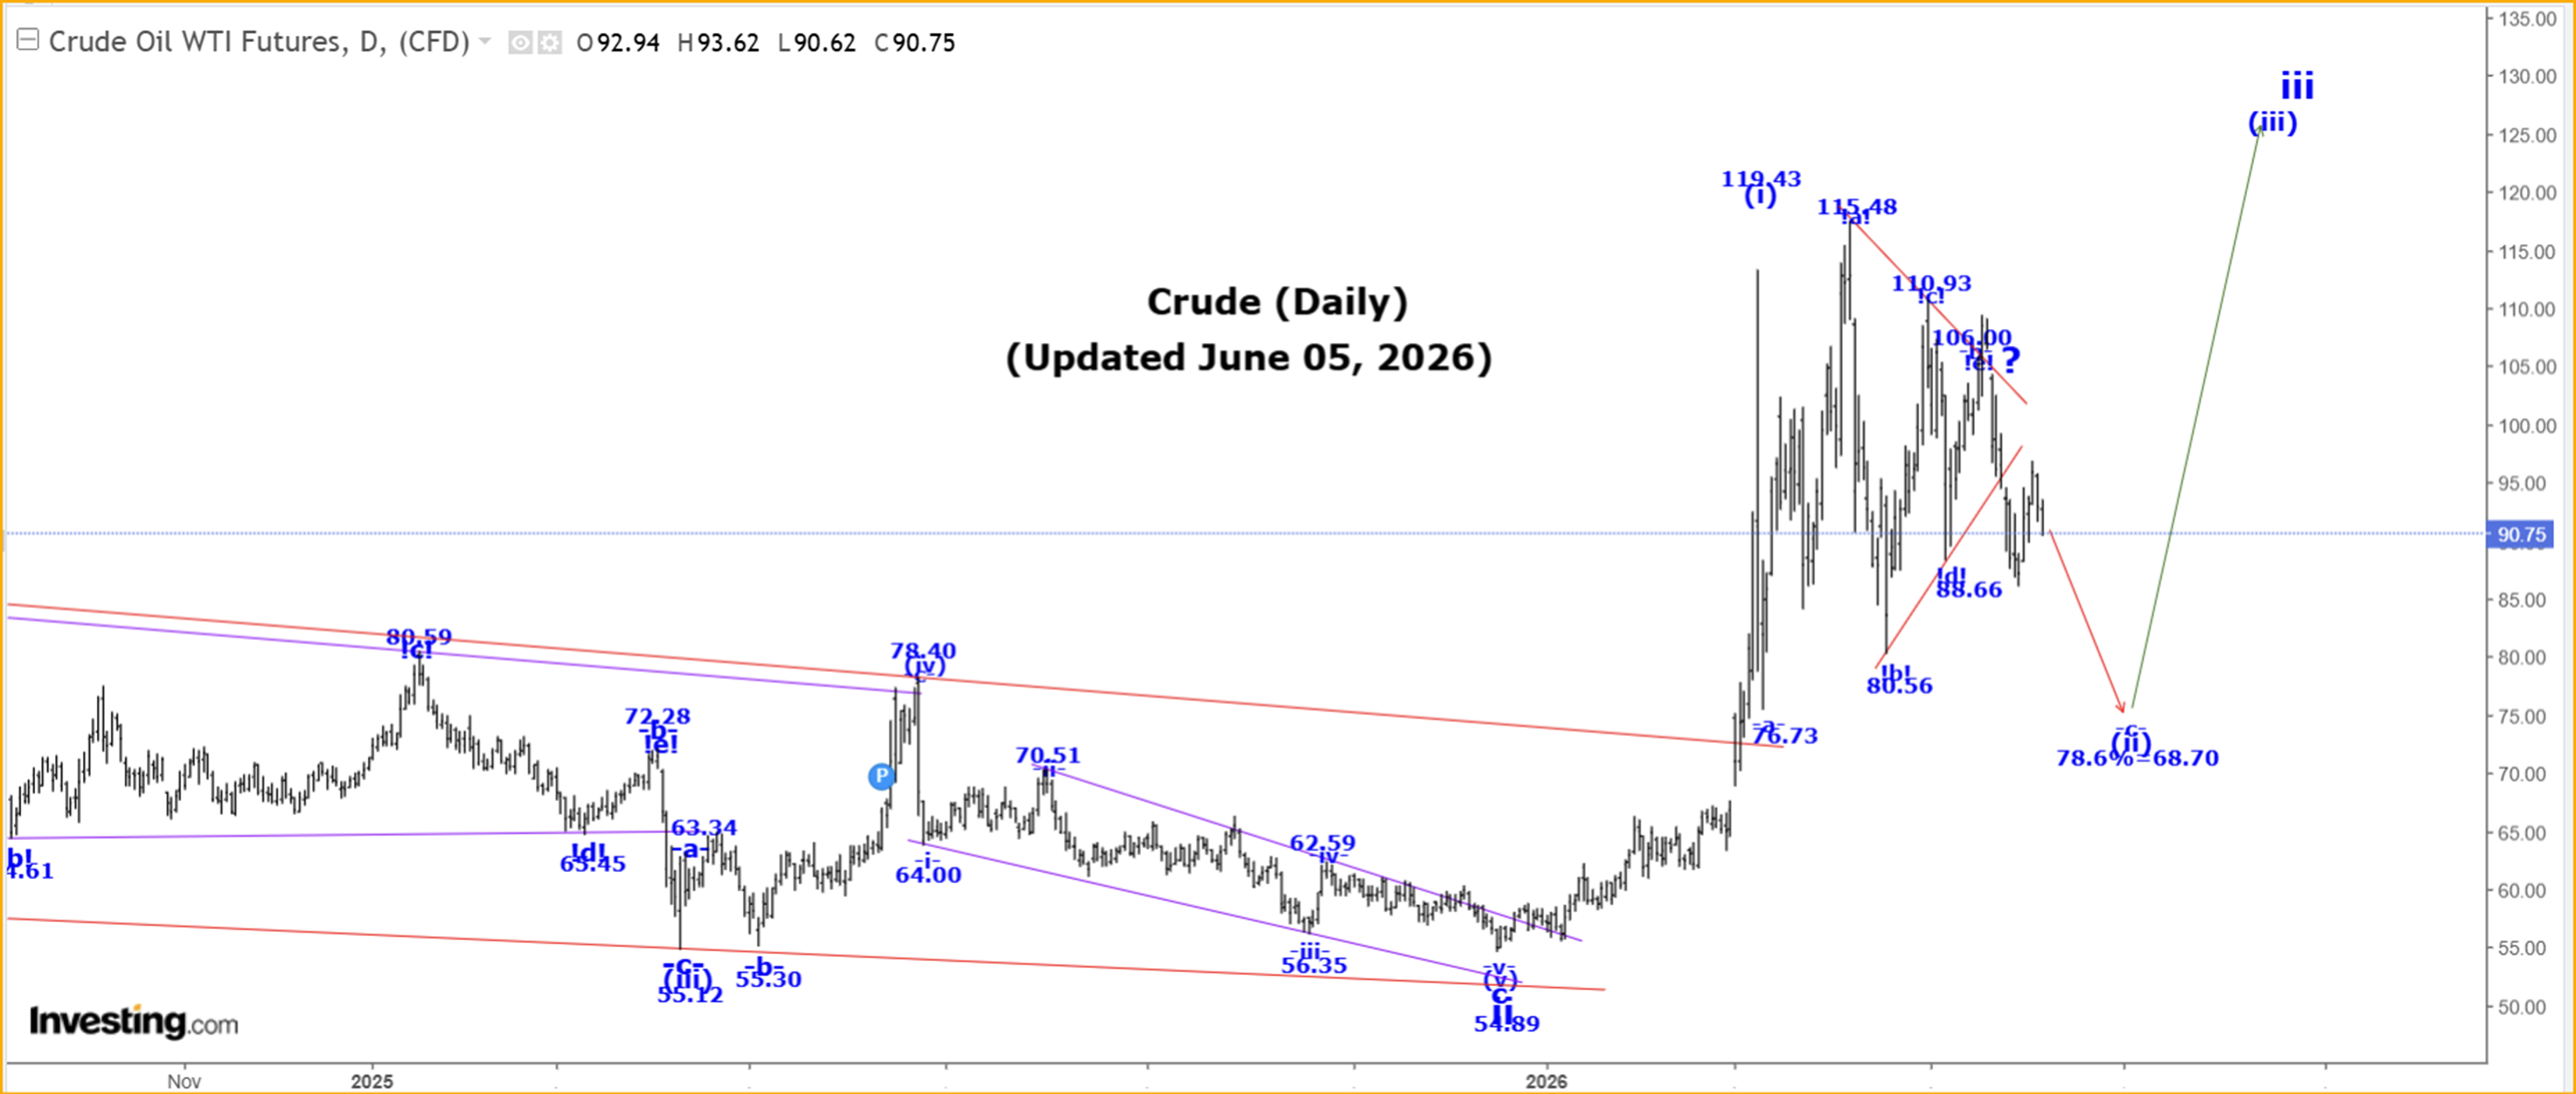
The daily chart.
Analysis:
Wave ii ended at the 54.89 low and we now moving sharply higher in wave iii. Within wave iii, we have completed wave (i) at the 119.48 high and we are now correcting in wave (ii), which has retracement levels as shown in our Daily Posts.
Within wave (ii) we completed wave -a- at 76.73 and we are now going to adopt our alternate count for our wave -b- bearish triangle, which is suggesting that it ended at the 97.00 high. If that is the case, then we should be starting to fall in wave -c- to complete all of wave (ii).
After wave (ii) ends we expect a sharp move higher in wave (iii).
Our initial projection for the completion of wave iii is:
iii = 1.618i= 331.28.
In the long term we are now rallying in wave C that has the following projections:
C = A = 153.77.
C = 1.618A = 244.78.
Gold
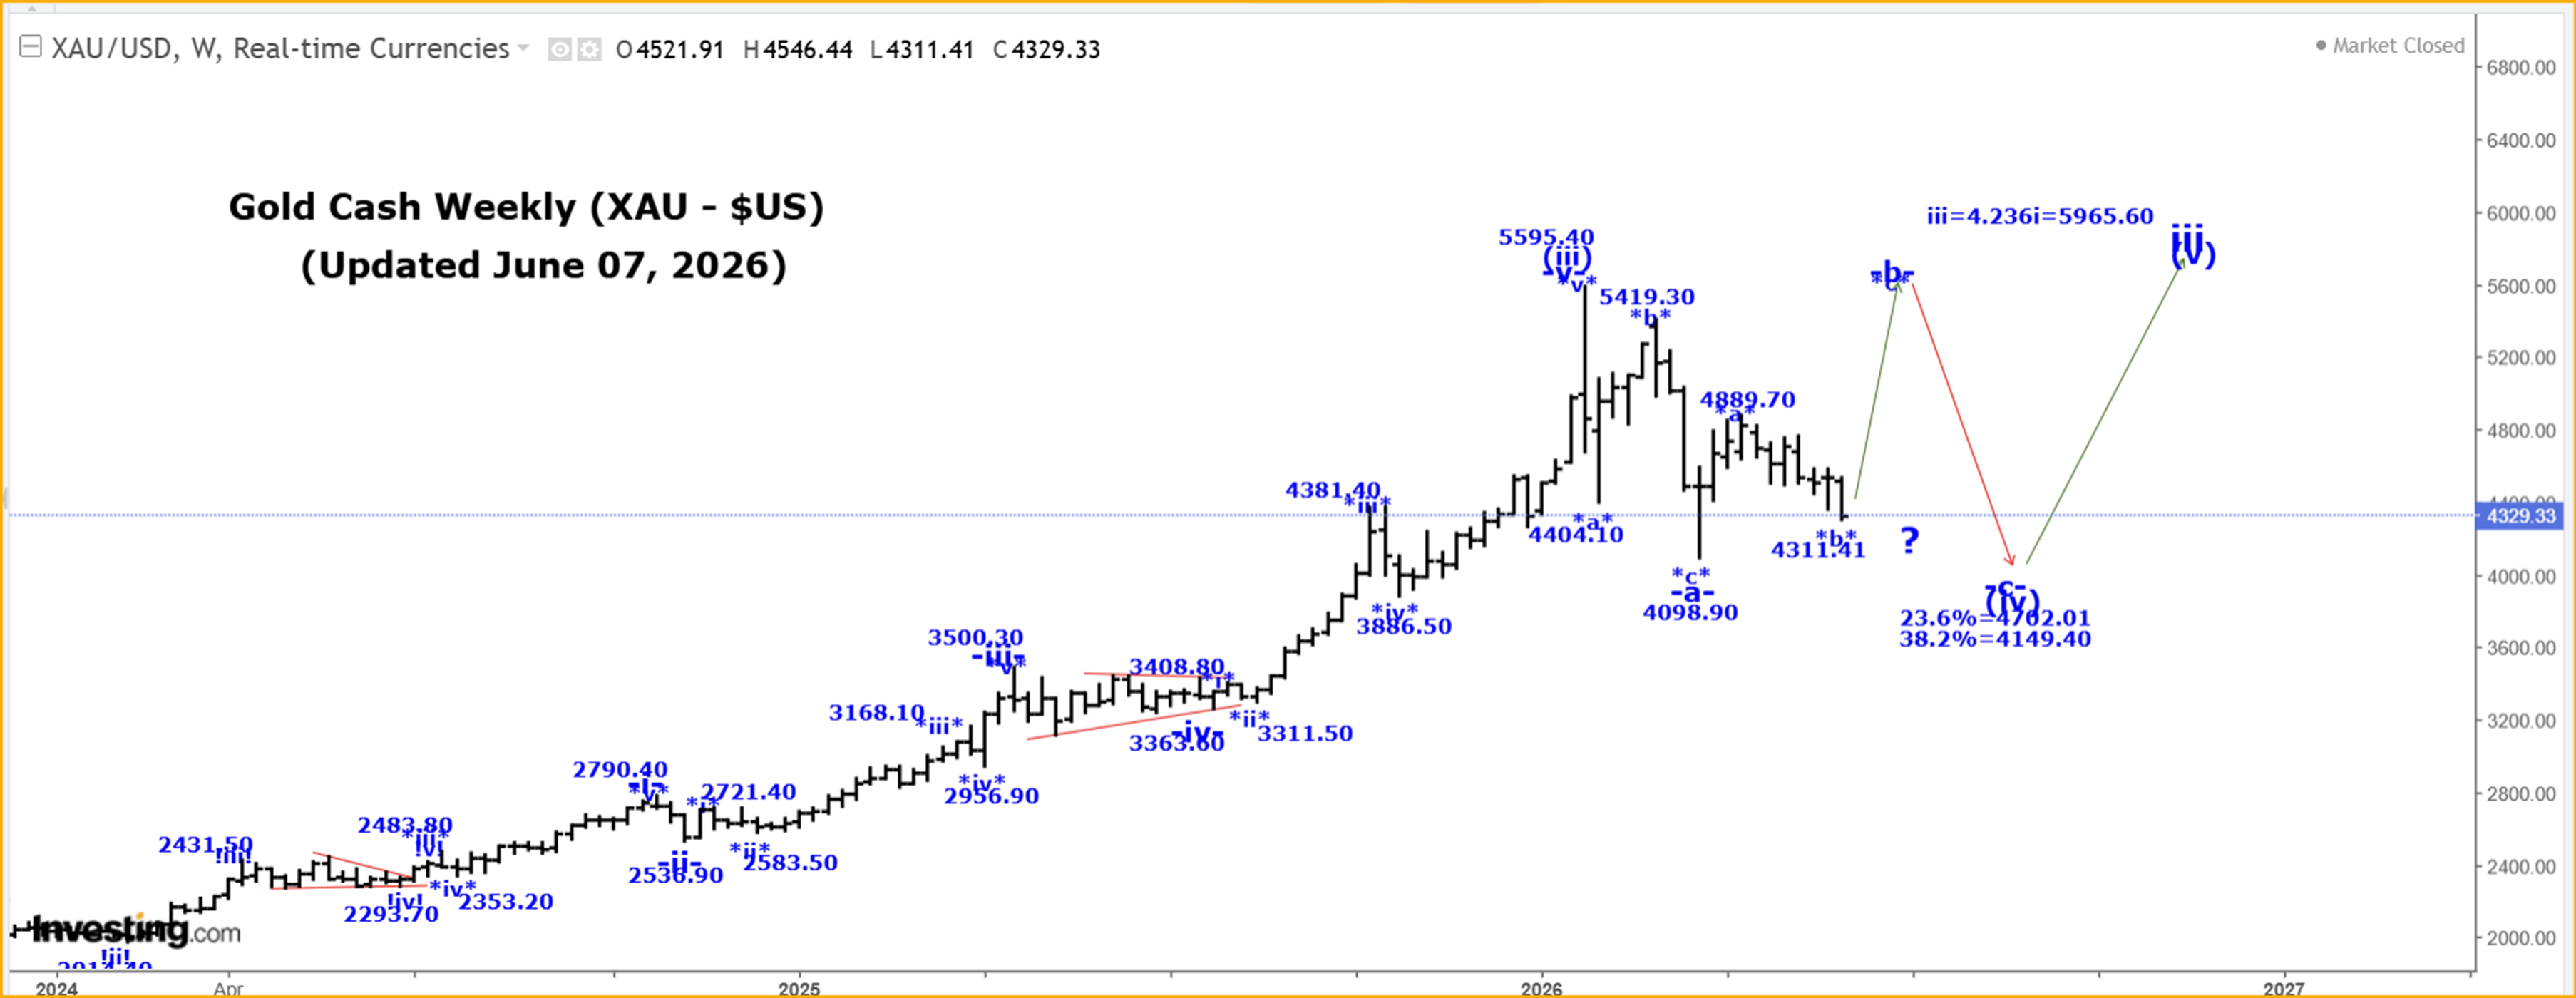
The Captain’s weekly gold chart.
Analysis:
Our current long-term gold count starting from the 35.20 low made back in 1971, which remains incomplete, is as follows:
1 = 1920.80.
2 = 1046.20.
3:
i = 2073.40.
ii = 1614.40.
iii:
(i) = 2073.30.
(ii) = 1810.10.
(iii):
-i- = 2790.40.
-ii- = 2539.90.
-iii- = 3500.30.
-iv- triangle = 3363.60.
-v- = 5595.40, to complete all of wave (iii).
(iv):
-a-:
*a*= 4404.10.
*b* = 5419.30.
*c* = 4098.80, to complete all of wave -a- of (iv).
-b-:
*a* = 4889.70.
*b* = 4311.40, if complete.
*c* rally above wave *b* ends.
A very powerful wave (iii) of iii is now complete at the 5595.40 high and we now falling in a multi-month wave (iv), correction that has the following retracement levels:
23.6% = 4702.00
38.2% = 4149.40.
Within wave (iv), we still believe it is going to take some time for it to be complete, so we are suggesting that only wave -a- of (iv) ended at 4098.80 and if that is the case than we are moving higher in wave -b-. Since wave -a- was a three-wave pattern then we expect wave -b- to rally back to at least near the all-time high or perhaps even exceed it before it ends.
If wave (iv) becomes a flat or irregular type correction than after wave -b- ends we expect a wave -c- drop back to at least the wave -a- low of 4098.80 before all of wave (iv) ends. If wave (iv) becomes a large bullish triangle then it will consist of 5 legs, and we will NOT return to the wave -a- low, before all of wave (iv) ends.
Within wave -b-, we likely completed wave *a* at 4889.70 and most or all of wave *b* at 4311.40. After wave *b* ends we expect another rally higher in wave *c* to complete all of wave -b-. We will provide our initial projections for the end of wave *c*, after we believe that wave 8b8 is complete.
In all cases, we should expect gold to move higher in wave -b- over the next couple of weeks. Wave -b- must consist of at least 1 three wave pattern, but it could have up to 3 such patterns, separated by a wave *x*.
Projections for the end of wave 3 are:
3 = 2.618(1) = 5936.00.
3 = 4.236(1) = 9033.60.
Active Positions: Flat!
Thank-you!
Captain Ewave & Crew
About the author
