
There are many signals we can use in our search for THE bottom in COMEX gold's seven-month consolidation. Let's explore a few of those today.
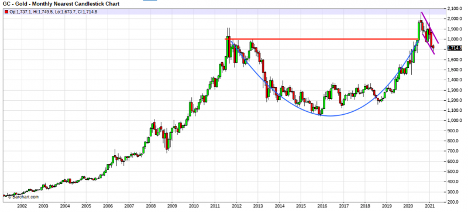
First, let's note that the current consolidation, though long and grueling, is just a simple basing and flagging phase on the long-term charts. While the past few months have been no fun at all, the long-term picture remains very solid and projects gains to at least $2300 per ounce in the next up leg.
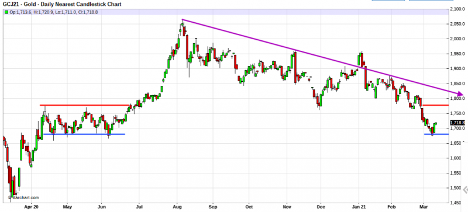
On the daily chart, note that price bounced from the same $1680 level that had served as strong support from April-June in 2020. Be sure to also note that $1780 served as stout resistance during that same time period, so any decisive move now back above $1780 and the purple "bull flag" line should indicate that THE bottom has been reached.
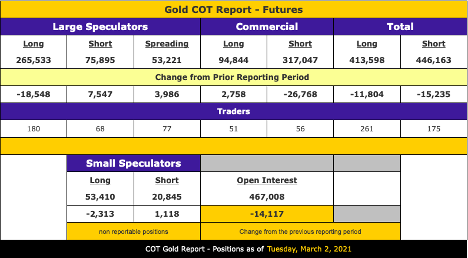
What else should we consider in searching for THE bottom and turn in price? Well, first of all, we should always be aware of the positioning within the Commitment of Traders Report. As of last Tuesday, March 2, the Large Speculators in COMEX gold were NET long just 189,638 contracts. That's their smallest NET position since the survey dated June 11, 2019—taken just days before the June 2019 FOMC meeting, where The Fed formally changed course and began cutting the fed funds rate. COMEX gold that day was trading near $1320 and then began a breakout charge to $1550 by August in a move that caught many by surprise.
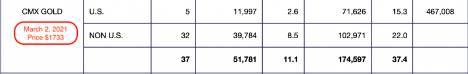
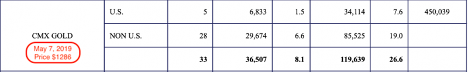
Next, we should check the monthly Bank Participation Report. This report summarizes the positions of the Banks that are most active in trading COMEX gold. With a reported NET position of 122,816 contracts short, this is the smallest combined short position since the report surveyed May 7, 2019.
And finally, on a day-to-day basis, let's watch the spread between the front-month futures contract (currently the Apr21) and the spot price. A normal situation finds these two prices in "contango", where the futures price is a few pennies to a dollar above the spot price. At present, however, we find these prices in "backwardation", where the futures price is below the spot price. See below:
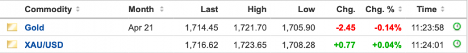
That this backwardation has been ongoing for over a week is indicative of heavy, relentless Bank and HFT selling in the COMEX derivative market—the type you'd see at a capitulating bottom. When price finally turns higher again, you'll see this situation turn, too, and price will move back into contango. As you can see, this hasn't happened...yet. However, when it finally does, you'll know that we have very likely seen THE bottom of this current consolidation phase.
So there you have it. Have we seen A bottom? Yes. However, have we seen THE bottom? Maybe, but with all major trend changes, one can only be certain with the benefit of hindsight. In the meantime, keep an eye on this space. All of us regular writers for Sprott Money are on the lookout for this key trend change. We'll be sure to keep you posted on a weekly basis.
About the author


Our Ask The Expert interviewer Craig Hemke began his career in financial services in 1990 but retired in 2008 to focus on family and entrepreneurial opportunities. Since 2010, he has been the editor and publisher of the TF Metals Report found at TFMetalsReport.com, an online community for precious metal investors.