When the CEO of a homebuilder admits publicly that “demand clearly slowed” during Q3 and was “even more challenging in October,” you know the market is in trouble. Unfortunately for the CEO of $PHM, the housing market is in worse shape that just “challenging.” But I’m sure he knows…I’ll be reviewing Pulte Homes in the next issue of the Short Seller’s Journal. The commentary below is from the October 23rd issue.
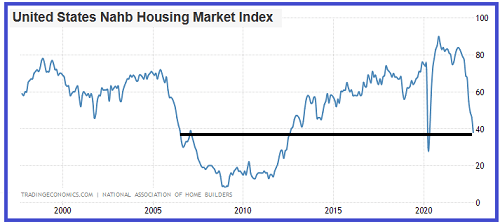
The housing market appears to be dissolving quickly. The National Association of Homebuilders sentiment index fell for the 10th straight month to 38 vs expectations of 43.

The chart above (sourced from Tradingeconomics.com) shows the index over the last 25 years. The index is based on a monthly survey of homebuilders regarding the rate of current sales of single-family homes, sales expectations for the next six months and prospective buyer showings. The sales expectations sub-index fell to 35. Except for the pandemic plunge, it’s the lowest reading since August 2012. However, in August 2012 the Fed’s QE was in full-swing and the index was rising.
To put the chart above in the context of homebuilder valuations, The last time the index was at 38 and headed further south was late 2006. The DJUSHB had declined about 37% from its then-ATH in 2005. It eventually bottomed in March 2009 after falling another 78%. The total decline over the nearly four-year period back then was 86%. Currently the DJUSHB has declined 37% from its ATH in December 2021. This is why I have been arguing that homebuilder valuations do not remotely reflect that coming carnage in the housing sector and homebuilder stocks. There’s still a considerable amount of downside that remains
On Friday the base interest rate for a 30-year fixed rate conforming mortgage hit 7.37%, the highest in 22 years. But that’s the base rate for a borrower with a 740 FICO and a 20% down payment. The mortgage rate for a sub-740 FICO and less than 10% down will exceed 8%. These numbers won’t help mortgage purchase applications, which declined again last week. The purchase apps index dropped to 164.2 from 170.5 the previous week. It’s back to where it bottomed and drifted sideways between late 2010 and 2015. The mortgage purchase applications index is down over 53% from its peak in early 2021. The base 30-year fixed mort-gage rate a week ago was 6.94%. The jump to well over 7% should translate into another weekly decline in purchase apps.
Housing starts in September also fell 8.1% from August and were below Street expectations (-7.2%). Permits rose 1.4% but this was attributable to rental unit permitting which rose 8.2%, as single-family permits dropped 3.1%. Most homebuilders build single-family homes and some townhomes. The decline in starts and permits for single-family homes should not surprise, as homebuilders currently are working on a record number of homes in various stages of inventory, many of which have had contract cancellations. This is going to get very ugly both for homebuilders and home prices.
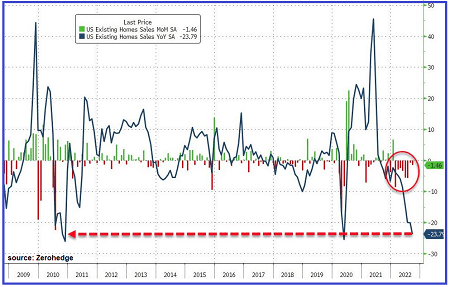
Existing homes for September fell on a SAAR basis (seasonally adjusted annualized rate) for the eighth month in row, falling 1.5% from August. The single-family sales component fell 0.9% on a SAAR basis. But the not seasonally adjusted monthly numbers show a 9.2% decline from August and a 20.8% cliff-dive from September 2021. While the August to September change would have seasonal variances, the YoY comp is likely a decent barometer for the degree to which home sales are contracting. The National Association of Realtors data shows an 8.1% price increase from September 2021 but 7.1% decline from the peak in June.

The chart above puts the current housing bear market in context with the bear market that followed the previous housing bubble. It took trillions in Fed money printing and a near-zero Fed funds rate policy to revive home sales after the last bubble. In addition, it took a series of changes to the parameters for a Fannie/Freddie guaranteed mortgage, starting with reducing the down payment requirements to 3% from 5%, and increasing the size limit of the mortgage, making it easier to qualify. This also lowered by quite a bit the credit quality of the homebuyer pool. It also took trillions and a near-zero interest rate policy after the pandemic crash to juice home sales.
I continue to believe that, barring a sudden sharp reversal in the Fed’s monetary policies, the homebuilders are a no-brainer short. I still own LGIH ($78) puts of various “flavors.” I most recently booked profits on my December 95’s and added March $80s. While I think any of the homebuilder tickers are good shorts, LEN and DHI have not dropped as much as the most of the others, in case you are looking for some names to short. I also continue to really like BLDR and BECN. I think both stocks will be cut in half, at least, before this bear cycle is complete. Note: LGIH reports on 11/1 (before). Keep in mind its Q3 closings were down 23.6% from Q2 and 38% YoY.
Another name that I like as a short that continues to puzzle me is ABNB ($119). I presented the idea a few months ago. It performed well as a short but then shot higher during the June-August market rally. Between August and September, it tested the $125 level and turned lower. It traded down to $100 in September but now appears to be headed for another test of $125.
On an Airbnb Superhosts community chat, several hosts complained about a big drop in bookings: “We went from at least 50% occupancy to literally 0% over the last two months.” Another post said “What’s going on with Airbnb? No bookings at all.” Marketwatch published a report Friday in which it cited several hosts who were experiencing a sudden decline in bookings that began during the summer.
There’s a few factors at play. The number of ABNB hosts soared after the pandemic. A not unmeaningful percentage of home sales since June 2020 were by mom & pop investors who played the housing bubble by chasing investment properties and renting them out through ABNB. The travel boom after the Covid restrictions were lifted fueled this boom. But the most probable cause of the drop in bookings is a widespread and deep cut-back in household discretionary spending. Airlines started reporting a decline in bookings starting in mid-July.
ABNB reports its Q3 numbers on November 1st after the close. I have to believe that the Company either will disappoint vs forecasts or issue a warning. The fate of the stock between now and the earnings release will depend in part on the short term direction of the stock market. For now, I’m going to wait to see if ABNB trades up to test the $125 resistance level again. But I will likely put on some puts ahead of earnings to play a “miss.” I also think there’s a good chance that a material number of ABNB property investors will be forced to sell their homes/apartments, which will put further pressure on the housing market.

