
Relief provided by an easing October CPI ‘inflation’ report the trigger
It was bound to happen sooner or later. October finally showed an easing comp in what most people think of as inflation (CPI)* and markets that were ripe to rally for other reasons used the ‘CPI inflation’ report as the trigger.
NFTRH has been on alert for a potentially positive Q4, 2022 to Q1, 2023 seasonal play since first uncovering the post mid-term election cycle’s positive implications over a month ago (NFTRH 725).
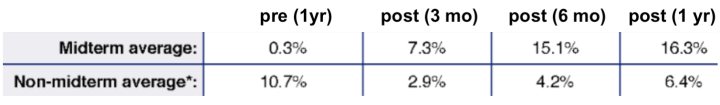
Here are the averages of all pre and post mid-term elections since 1962. Sure, nothing is ever guaranteed in the markets, including historical facts, averages, comps and analogs. But as we have noted it is considered a tailwind. Pre-election is consistently weak compared to non-election years and post-election is consistently strong compared to those same non-election years.
Some prime elements for such a play (and this is all it is indicated to be as those celebrating a fade in inflation today will not be too happy down the road when inflation signals fall uncomfortably low) we’ve been tracking have been as follows:
- With a cyclical bear market for all of 2022 the tax loss selling was expected to be significant in Q4. As would be the relief to follow.
- The aforementioned election cycle.
- Mainly bullish seasonal averages beginning in November and lasting to a specific end point in Q1 (projection reserved for NFTRH).
- A negative divergence to the US dollar (the global asset market counterparty) by the Gold/Silver ratio (GSR). As advised repeatedly in NFTRH, it has been important to keep an eye on silver, which has been out-performing gold indicating a phase of market liquidity relief. The GSR is leading the US dollar to a breakdown from its intermediate uptrend (but not its major uptrend, which will come into play later).
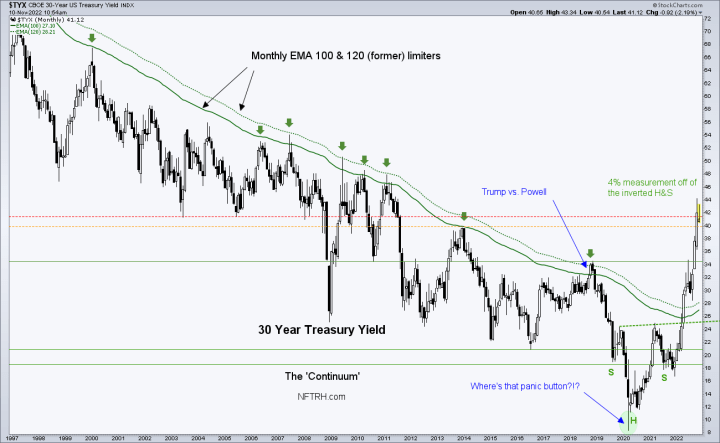
- Last but not least, the upside target area having been dinged and slightly exceeded to the elegant ‘Continuum’ chart of the 30 year Treasury bond yield. Oh, how elegant it is to my eye.
This was a pure expression of ‘equal and opposite’ dynamics to the Q1, 2020 deflationary fear fest. How poetic for inflationary hysteria to follow deflationary terror as represented by such a beautiful picture. A picture of excessive momentum in the opposite direction to 2020’s excessive momo.
As for ways to ‘play’ the relief phase, detailed information is reserved for NFTRH Premium. But think about these elements:
- What equities have manufactured big losses for investors in 2022, thereby becoming tax loss seasonal ‘buy’ candidates?
- While many segments may rally, think more about those negatively correlated with rising bond yields (i.e. positively correlated with disinflation and firmer bonds).
- Here is also where inflation-centric gold bugs may want to finally change their views by casting aside the influential and promotional leader bugs and realizing that gold mining does NOT benefit from inflation. But of course, they will not cast aside the dogma.
- With a US dollar in correction, global markets to which it is a firm counterparty (e.g. Emerging Markets) could outperform.
- Cash is a position, now along with bonds. It is paying dividends and will again provide safety when the time is right.
Bottom Line
Realize that the odds were in favor of a relief phase in Q4-Q1, and bear market relief can be strong. But also realize that there are upside technical parameters well north of here that would need to be taken out before TA can call a new bull market. Realize also that today’s celebration about a fade in ‘inflation’ * will likely become tomorrow’s (or Q1, 2023’s) swing toward an uncomfortable drop in inflation expectations. These are the volatile considerations that your heroes at the market micromanaging Federal Reserve have created.
I invite you to check out a 2 week free trial to NFTRH Premium during the Q4 to Q1 window. It may be even more important to get the markets right as the window closes than it would be to be correct today about the opening of the window.
* CPI and other lagging ‘inflation’ reports represent the effects of the inflation created by ramping money supplies, courtesy of the US Federal Reserve and its central banking fellows. But they are not ‘inflation’. That happened in 2020.
For “best of breed” top down analysis of all major markets, subscribe to NFTRH Premium, which includes an in-depth weekly market report, detailed market updates and NFTRH+ dynamic updates and chart/trade setup ideas. Subscribe by Credit Card or PayPal using a link on the right sidebar (if using a mobile device you may need to scroll down) or see all options and more info. Keep up to date with actionable public content at NFTRH.com by using the email form on the right sidebar. Follow via Twitter@NFTRHgt.
About the author
