
Read the full article on SilverSeek.com
In gold, the commercial net short position increased by an eye-watering 19,606 COMEX contracts...1.96 million troy ounces...and did so for the same reason as it happened in silver.
They arrived at that number by increasing their long position by 277 contracts, but also increased their short position by 19,883 contracts -- and it's the difference between those two numbers that represents their change for the reporting week.
Under the hood in the Disaggregated COT Report, all the big buying was done by the Managed Money and Other Reportables...as the former increased their net long position by 16,578 contracts -- and the latter by 4,017 contracts. The Nonreportable/small traders went in the other direction by reducing their net long position by a smallish 989 contracts.
Doing the math: 16,578 plus 4,017 minus 989 equals 19,606 COMEX contracts, the change in the commercial net short position, which it must do.
The commercial net short position in gold now sits at 21.47 million troy ounces, up from the 19.51 million troy ounces they were short in last week's COT Report.
The Big 8 are short 21.15 million troy ounces of gold in this week's COT Report, compared to 20.54 million troy ounces they were short in last week's report...so they increased their short position by 610,000 troy ounces/6,100 COMEX contracts.
But the commercial net short position increased by 19,606 COMEX contracts so, like in silver, it was Ted's raptors, the small commercial traders other than the Big 8 that were the biggest sellers...as they sold the difference, around 13,100 contracts worth...also for a decent profit.
And also like in silver, their long selling has the mathematical affect of increasing the commercial net short position.
The Big 8 traders are short just under 99 percent of the commercial net short position in gold, down from the 105 percent that they were short in last week's COT Report -- and that's entirely because of the long selling that the small commercial traders did during the reporting week.
So, for all intents and purposes, the Big 8 are short the entire amount of the commercial net short position in gold.
Here's Nick Laird's 3-year COT chart for gold, updated with Friday's data -- and the weekly change is worth noting. Click to enlarge.
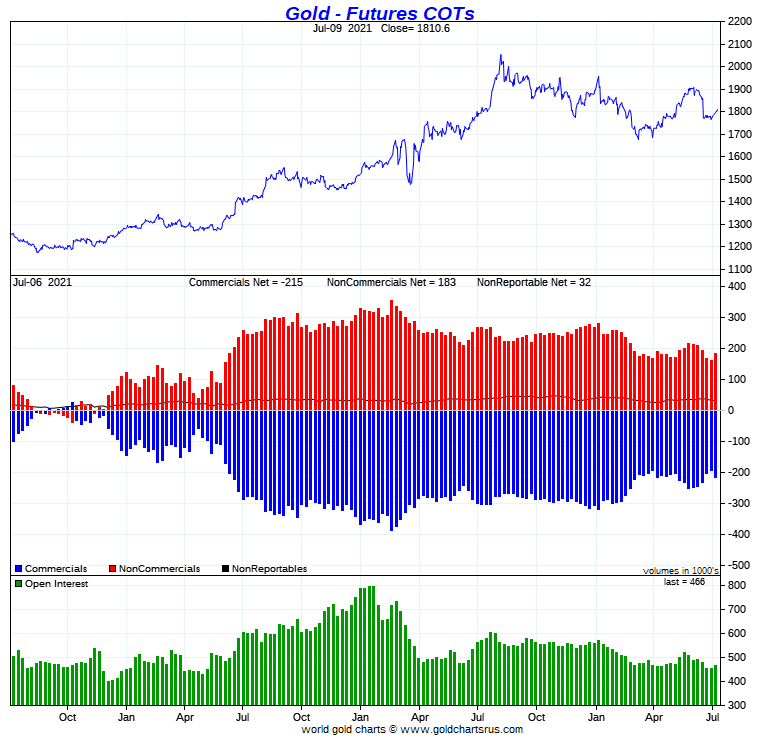
Ted mentioned on the phone that the Big 4 traders increased their net short position by about 4,700 contracts during the reporting week. So, like in silver, it was the long selling by the smaller commercial traders that made up the bulk of the increase in the commercial net short position.
As Ted pointed out in his mid-week commentary on Wednesday..."Increases of commercial selling in both gold and silver shouldn’t radically alter the market structures in each and, of course, what the big 4 did in silver will be my primary concern."
So yes, the headline numbers sucked...but that was mostly because of raptors selling longs. The Big 4, as Ted feared, did increase their short positions, but as Ted just said...it "shouldn’t radically alter the market structures in each" -- and it doesn't.
But, having said all that -- and even with a continuing very bullish COT structure in both, this past week's price action has all the hallmarks of the "same old, same old" of the past many decades to me. The precious metals are going nowhere until the Big 2/4 traders allow it.
I look forward to what Ted has to say about all of this in his weekly review to his paying subscribers this afternoon.
In the other metals, the Managed Money traders in palladium [not surprisingly] increased their net long position by a further 833 COMEX contracts during the last reporting week -- and are net long the palladium market by 3,567 COMEX contracts...around 35 percent of the total open interest...up about 5 percentage points from last week's report. In platinum, the Managed Money traders decreased their net long position by 1,607 contracts -- and are net long the platinum market by 3,050 COMEX contracts...about 6 percent of total open interest -- down about 2 percentage points from last week's COT Report. In copper, the Managed Money traders increased their net long position by a further 4,917 COMEX contracts -- and are now net long copper to the tune of 30,923 COMEX contracts...about 773 million pounds of the stuff -- and about 15 percent of total open interest...up about 2 percentage points from last week.
![]()
Here’s Nick Laird’s “Days to Cover” chart, updated with the COT data for positions held at the close of COMEX trading on Tuesday, July 6. It shows the days of world production that it would take to cover the short positions of the Big 4 — and Big '5 through 8' traders in each physically traded commodity on the COMEX.
I consider this to be the most important chart that shows up in the COT series -- and it deserves a minute of your time. Click to enlarge.
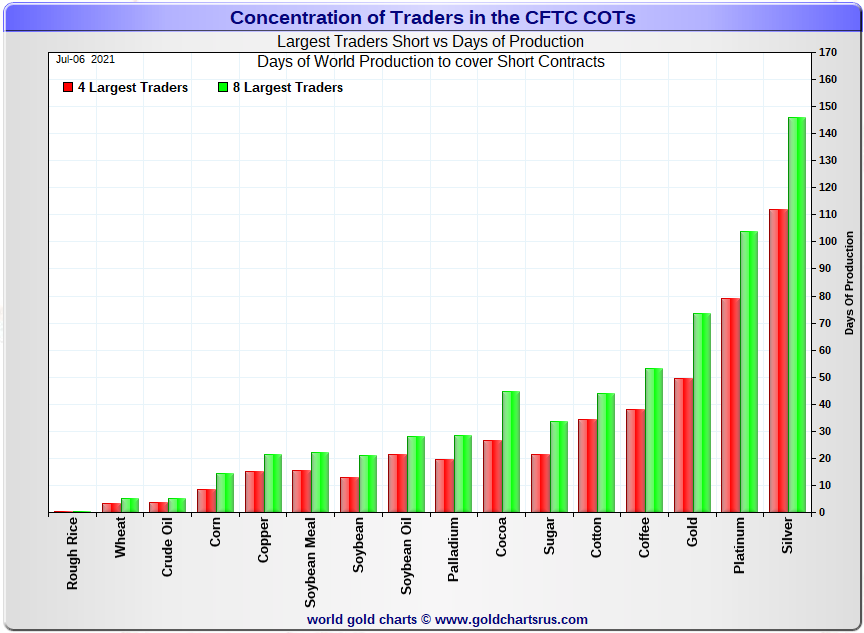
In it, the Big 4 traders are short about 112 days of world silver production, up about 8 days from the prior week's report. The ‘5 through 8’ large traders are short an additional 34 days of world silver production...down about 4 days from the prior COT Report for a total of about 146 days that the Big 8 are short...up about 4 days from last week's COT report. [In the prior reporting period they were short 142 days of world silver production.]
As Ted mentioned on the phone yesterday, the Big 4 added to their short position during the reporting week -- and the Big '5 through 8' traders decreased their short position during the same period -- and that's very apparent in the numbers above.
That 146 days that the Big 8 are short, represents just about 5 months of world silver production, or 341.1 million troy ounces of paper silver held short by the Big 8.
In the COT Report above, the Commercial net short position in silver was reported by the CME Group at 315.5 million troy ounces. As mentioned in the previous paragraph, the short position of the Big 4/8 traders is 341.1 million troy ounces. So the short position of the Big 4/8 traders is larger than the total Commercial net short position by 341.1-315.5=25.6 million troy ounces...down 20 million troy ounces/4,000 COMEX contracts from last week's report.
It was this selling that had the mechanical effect of increasing the Commercial net short position.
The reason for the difference in those numbers two paragraphs ago...as it always is...is that Ted's raptors, the 26-odd small commercial traders other than the Big 8, are net long that amount...25.6 million troy ounces.
Another way of stating this [as I say every week in this spot] is that if you remove the Big 8 shorts from the commercial category, the remaining traders in the commercial category are net long the COMEX silver market. It's the Big 8 against everyone else...a situation that has existed for almost five decades in silver, platinum and palladium -- and for almost the last three weeks, in gold as well!
As per the first paragraph above, the Big 4 traders in silver are short around 112 days of world silver production in total. That's about 28 days of world silver production each, on average...up two full days from last week's COT Report. The four big traders in the '5 through 8' category are short 34 days of world silver production in total, which is about 8.5 days of world silver production each, on average...down one full day from last week's COT Report.
The Big 8 commercial traders are short 43.4 percent of the entire open interest in silver in the COMEX futures market, which is up a bit from the 42.1 percent they were short in the prior week's COT report. And once whatever market-neutral spread trades are subtracted out, that percentage would be 50 percent, for all intents and purposes. In gold, it's 45.4 percent of the total COMEX open interest that the Big 8 are short, which is basically unchanged from the 45.3 percent they were short in Monday's COT Report -- and a bit over the 50 percent mark once their market-neutral spread trades are subtracted out.
In gold, the Big 4 are short 49 days of world gold production, up about 1 day from last week's COT Report. The '5 through 8' are short 24 days of world production -- also up 1 day from last week's report...for a total of 73 days of world gold production held short by the Big 8 -- and obviously up 2 days from the prior COT Report. Based on these numbers, the Big 4 in gold hold about 67 percent of the total short position held by the Big 8...down about 1 day from the prior week's COT Report.
The "concentrated short position within a concentrated short position" in silver, platinum and palladium held by the Big 4 commercial traders are about 77, 76 and 71 percent respectively of the short positions held by the Big 8...the red and green bars on the above chart. Silver [not surprisingly] is up about 4 percentage points from last week's COT Report...platinum is unchanged from a week ago -- and palladium is up about 6 percentage points week-over-week.
But in actual fact, very little has changed, as the Big 8 shorts are still hugely short in all four precious metals in the COMEX futures market. But it's now mostly the Big 4...or probably just the Big 2 or 3...Citigroup, Bank America and HSBC -- and the above chart tells you all you need to know about their current plight.
They're stuck on the short side -- and that's for the very simple reason that the Managed Money traders are no longer willing to go mega short like they used to in the past. Because of that, the Big 4/8 traders can't cover.
There's only two ways out for them...deliver physical metal into their short positions, or buy longs and cover that way...driving its price to the moon in the process. And as I've stated before, a far out in left field option would be to close the COMEX for futures trading in the four precious metals and let them trade in the spot market.
The situation regarding the Big 4/8 shorts continues to be beyond obscene, twisted and grotesque...especially the Big 2/4 -- and as Ted correctly points out, its resolution will be the sole determinant of precious metal prices going forward.
![]()
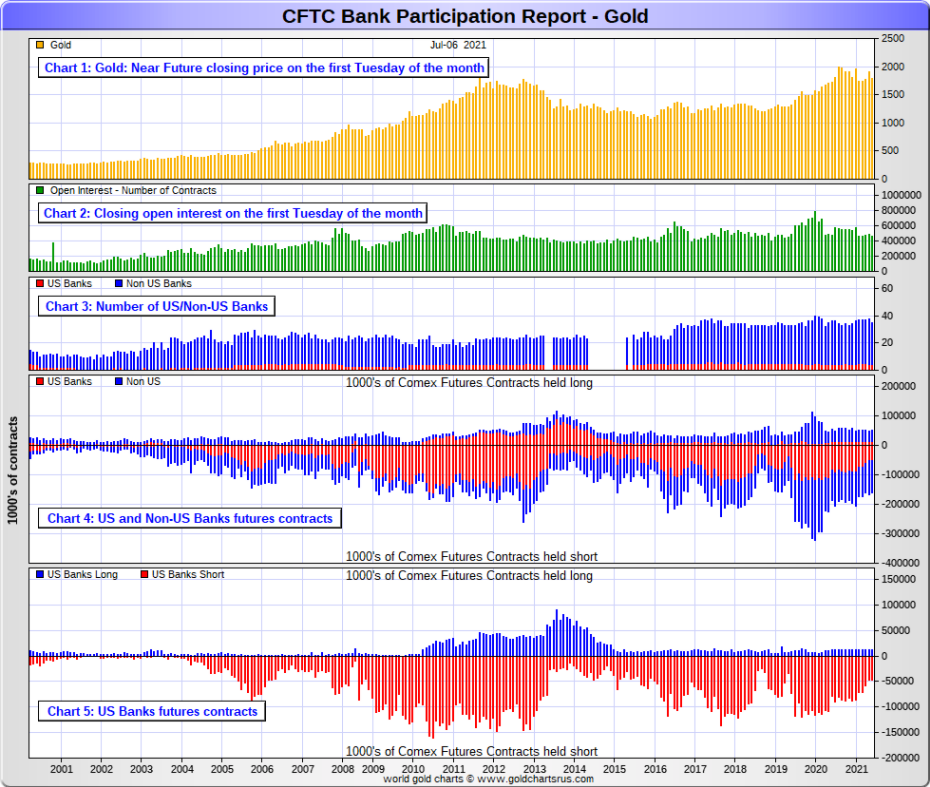
The July Bank Participation Report [BPR] data is extracted directly from yesterday's Commitment of Traders Report. It shows the number of futures contracts, both long and short, that are held by all the U.S. and non-U.S. banks as of Tuesday’s cut-off in all COMEX-traded products. For this one day a month we get to see what the world’s banks are up to in the precious metals —and they’re usually up to quite a bit.
[The July Bank Participation Report covers the time period from June 2 to July 6 inclusive.]
In gold, 4 U.S. banks are net short 34,827 COMEX contracts in the July BPR. In June’s Bank Participation Report [BPR] these same 4 U.S. banks were net short 34,543 contracts, so there was no change worthy of the name from four weeks ago.
Citigroup, HSBC USA, Bank of America and Morgan Stanley would most likely be the U.S. banks that are short this amount of gold. I still have some suspicions about the Exchange Stabilization Fund as well, although if they're involved, they are most likely just backstopping these banks.
Also in gold, 31 non-U.S. banks are net short 73,394 COMEX gold contracts. In June's BPR, 34 non-U.S. banks were net short 82,159 COMEX contracts...so the month-over-month change shows a decrease of 8,765 COMEX contracts.
At the low back in the August 2018 BPR...these same non-U.S. banks held a net short position in gold of only 1,960 contacts -- and they've been back on the short side in an enormous way ever since.
I suspect that there's at least two large non-U.S. bank in this group, one of which would be Scotiabank/Scotia Capital...plus HSBC most likely. And I have my suspicions about Barclays, Dutch Bank ABN Amro, French bank BNP Paribas, plus Australia's Macquarie Futures as well. Other than that small handful, the short positions in gold held by the vast majority of non-U.S. banks are mostly immaterial and, like in silver, have always been so.
As of this Bank Participation Report, 35 banks [both U.S. and foreign] are net short 23.2 percent of the entire open interest in gold in the COMEX futures market, which is down a tiny bit from the 23.9 percent that 39 banks were net short in the June's BPR.
Here’s Nick’s BPR chart for gold going back to 2000. Charts #4 and #5 are the key ones here. Note the blow-out in the short positions of the non-U.S. banks [the blue bars in chart #4] when Scotiabank’s COMEX short position was outed by the CFTC in October of 2012. Click to enlarge.
About the author
