
By: Plunger
The following is an opinion piece assessing whether the gold mining stocks are in a primary bull or bear market. I form my conclusion by analyzing the charts, investor sentiment and applying the principles taught by the great published analysts of the past, specifically Robert Rhea and William P. Hamilton.
Frankly, I am tired of the relentless bullish bias of this sector. It leads an investor to throw his hard earned money down the drain. Since August 2020 the gold stocks have been in decline, yet one hears only the bullish call “to the moon” or “rocket launch” from various sources. ” It’s just a correction” is what we hear. No I want to take a deep dive and examine the price action to see what’s really going on. I don’t want false promises, I want reality, I want to know what’s really happening. I have seen so many bear markets where everyone just rides them down. They stay invested due to the unceasing bullish clarion call. I am going to think for myself, I am going to leave my ego at the curb and look at the facts. If it is a bear market then I am going to be out and just trade oversold opportunities and hold the few companies that are adding value faster than the market is taking it away. GoGold would be a good example of this. So leave your bias behind and read with an open mind.
Unless a man can anticipate future events his ability to speculate successfully is limited. Speculation is a business. It is neither guesswork or gamble. It is hard work and plenty of it. —-Jesse Livermore
I will tell you right up front, it is my considered view that the gold mining stocks entered a primary bear market in August 2020 and today remain in that same primary down trend with lower lows slated for the future. Now I understand this message is akin to going to a Bitcoin convention and calling for $10,000 or lower Bitcoin prices. Not many would be buying me drinks at the bar after such a statement. But I am more interested in bringing to you an objective opinion of what I believe the market has recently revealed to us. None of this is based on pride of opinion, I just want to reveal the markets signals in an attempt to protect oneself and ultimately make money.
Everyone should know that my views are completely unsponsored by the owners of this site, but they have allowed me the freedom to express my unfettered perspective of the market. I offer no investment advice, instead I am simply sharing my alternative thoughts on the market.
Using Technical Analysis- Be careful out there
I consider Rambus to be the preeminent chartist in the world. This is not hyperbole, I simply haven’t seen anyone better. If I had his charting skills I would move to Greenwich, Connecticut tomorrow and hang out a shingle. My fee for the exclusive rights to my work would start at $1 million. Yes, that’s how good he is.
But I want to caution everyone that TA is not the end all. It’s not as simple as many may think. Typically newbies draw lines connecting high and low points calling them trend lines then claim it means something. They make up a story explaining the significance of it all. The reality however, is without the required knowledge they are just engaged in curve fitting, Technical analysis is useful, but one must also capture the language of the market. I think this picture below somewhat explains what they are actually doing:
Meteorology’s equivalent of Technical Analysis:

I hope you understand my point. Yes price action inputs all known information into the price, however interpreting that price action is another skill altogether.
So just what kind of bear market is this?
It’s a cyclical bear market. A primary down trend of cyclical nature. Not a secular bear market (long term) which would encompass multiple cycles. The decline from 1980 to 2001 was secular which took the gold mining stocks down 80-90%. The fundamentals were in decline for 20 years back then. A cyclical bear market can last less than a year to several years. The bear market from 2011-2016 was a severe cyclical bear market lasting just over 4 years. Robert Rhea stated:
The correct determination of the primary trend is the most important factor in successful speculation.
Since this bear market began last August fundamentals have actually been improving, however price action remains in a primary downtrend. Since fundamentals are improving it shouldn’t last 5 years or decline 80%+. For whatever reason however, price action continues to decline. Why?, because it’s in a bear market, that’s all one really needs to know in my opinion. I could pontificate as to the reasons, but who cares as these theories turn out being wrong more than they are right. Let’s just follow the price action and the signs Mr. Market reveals to us.
I know calling the price action since last August a bear market may seem counter to what you have been hearing. Throughout all the market opinion and analysis that I read I have not heard a single analyst describe it as a bear market. Universally, the term “correction” is assigned to the price action since August. My lone voice doesn’t give me pause labeling it as a bear market, because virtually all the public never realizes they are in either a bull or bear market until it is almost over. That’s a fact.
Gold Stock Bear Market:
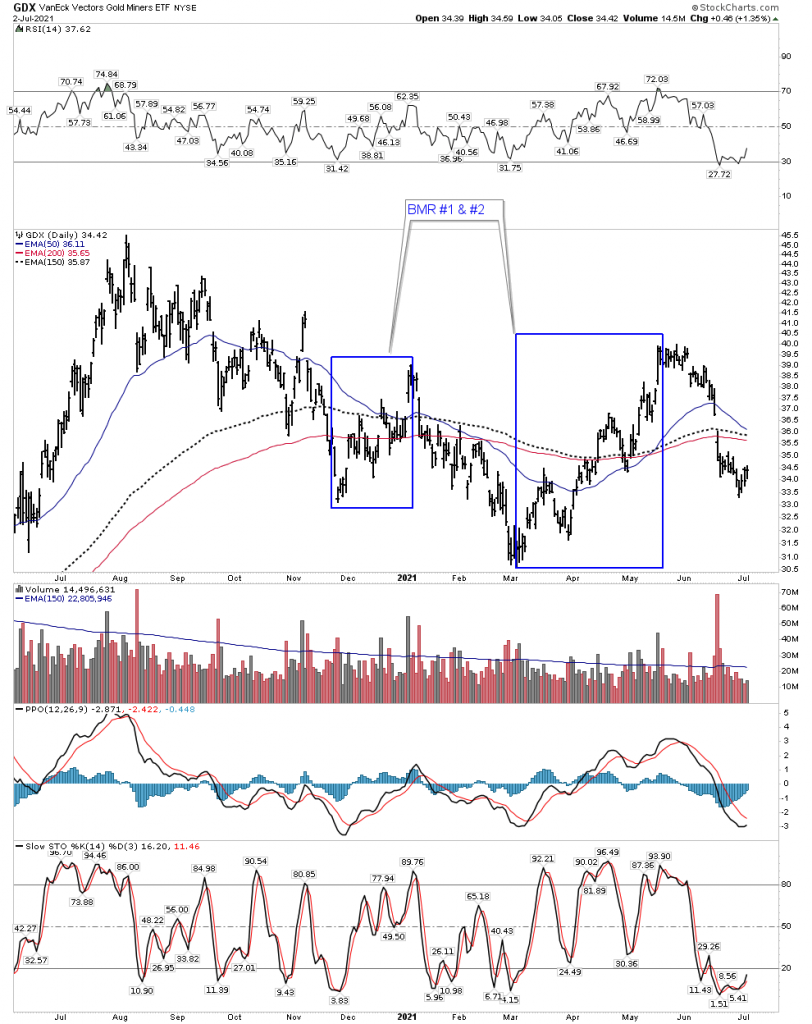
Above we see the price action defined as a bear market which began on August 5, 2020 and IMO remains in force today. I have identified two bear market rallies (BMR) which have occurred within the downtrend as noted. I will analyze these two rallies later.
The reason I categorize this as a bear market is multi-fold. It has the feel of a bear market as demonstrated by volume dynamics and price action, plus it has unfolded in the manner that bears markets do. Bear markets undergo 3 psychological phases. We are now well into phase II.
Bear Phase I – Stocks sell minus the frothy “hopes and expectations” of the previous final bull run phase. Recall what it felt like throughout the month of July last year. Gold bugs were dreaming of these stocks going to the moon and making them a fortune. The gold stocks had been in a bull market ascent for two years and typically at the end of a bull market silver makes its run and that’s just what happened. Silver went vertical in July and would not correct. Everything just seemed effortless. Gold stocks had been in a bull market for two years but it hadn’t felt like fun until the very end. The reason it didn’t seem “fun” over those 2 years is because it was still early in this secular bull market. Constant day to day fun times come in the second half of a secular bull. We are not there yet.
Those last two months last summer were the culmination of a 2-year bull market with an obligatory vertical silver run to end it all. Classic stuff actually, but it should serve to raise the question what comes next? Well a bear market of course. Just like night follows day. The previous bull had undergone all the phases including a blow-off silver top.
Bear market phase I lasted from early August until late September IMO. Gold and Silver stocks were no longer as heated and everyone was now accepting that gold was in a well deserved “correction”. It would be over soon. So far what I have described is classic modeled behavior. A 2 year bull market from Sept 2018 to Aug 2020 with an accelerated blow off top. All the signs are there, one needs to open their eyes and accept the possibility that a bear market follows next.
Bear Phase II- The market begins to discount deteriorating conditions. When the market becomes oversold a relief rally ensues or even a full blown BMR. But these rallies ultimately fail and the primary decline resumes downward. Severe panics unfold and support levels get swept away. Phase II is the longest phase. The public still believes they are in a bull market until late phase II.
So what are those deteriorating conditions? I thought fundamentals were getting better in the gold space? Well, it’s guess work but I suspect the rise of cryptos and the power of the risk-on trade simply drew money away from gold. Ultimately it’s just a flow of funds dynamic. Again, we don’t have to know, we follow the price action.
Bear Phase III – This phase is yet to come, but it ends the bear market. My view is phase III begins when (if) the price action violates the lows of early March 2021. That would be at GDX 30. If this low is broken I believe the average investor would finally realize that the gold stocks are indeed in a bear market and the final capitulation phase will begin.
Capitulations can be quite ugly. It can be fast and furious or it can develop into a grinding annihilation run. It can be a high volume climax or it can be where volume just dries up. There is no way to know, so the best course of action is to sell early and watch it from the sidelines.
Thinking about the big picture
Above I have described the ebb and flow between bull and bear markets. We can see that from 2018-2020 we had a classic early stage cyclical bull market. It started slow and had a mini blow off top in the end. This is characteristic of a cyclical bull market in the early part of a secular bull market. As it undergoes late stage blow off characteristics the next thing to look for would be a bear market to unfold. Let’s look at both gold and the GDX on a simple weekly chart:
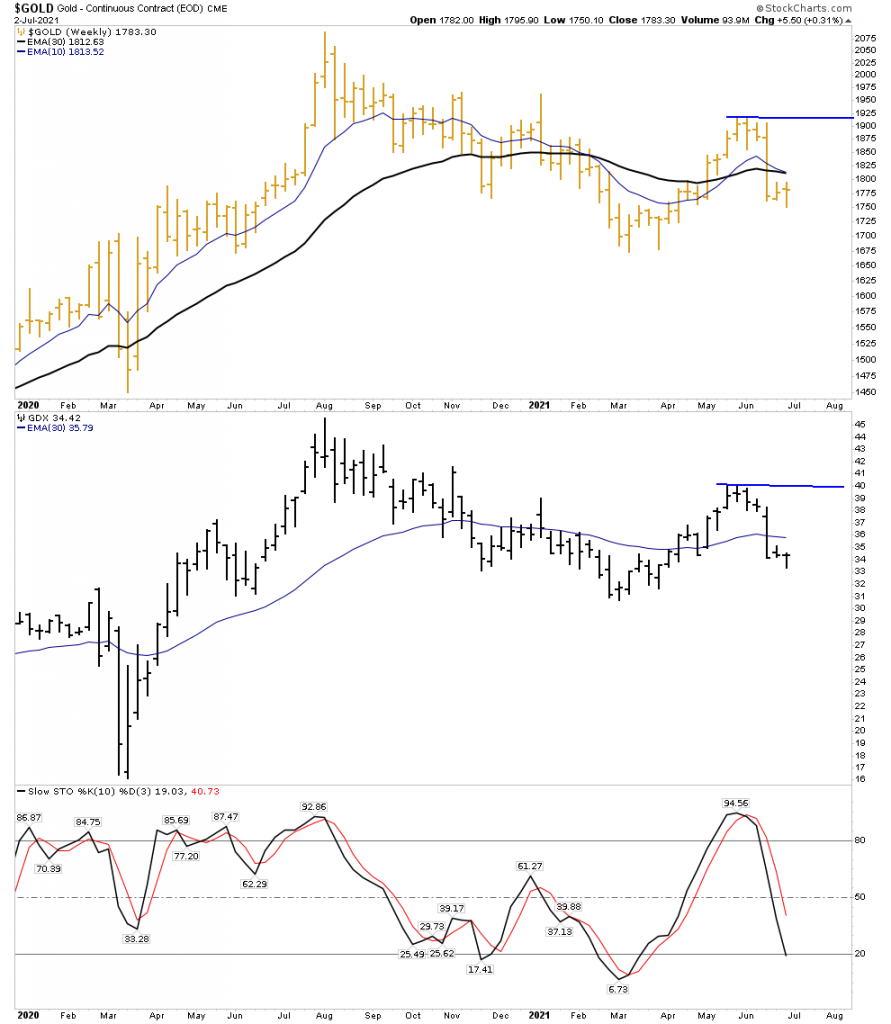
Both gold and the GDX have put in an intermediate term (BMR) top in mid-May. That is a major lower high that has now broken below a declining 30 EMA. Until price can close above the two blue lines over those tops I have to assume the bear market is still in effect.
Also note the weekly stochastic. It is still in a hard down configuration. It’s telling us that any short term rally is not sustainable. It will take a lot of positive price action and time to turn around the stochastic and establish a base before a sustained advance can begin.
Finally, I want to point out the 30 EMA. Note they both peaked over 6 months ago. They then attempted to rise again, but have now put in lower peaks. This is NOT bull market action. Quite the opposite, this is what one looks for to qualify a stock as a short candidate.
Let’s compare the 30 W EMA’s with the previous bull market from 2018-2020. Note below how the 30 EMA NEVER had a lower peak in the previous bull market, in fact it never even turned down except briefly due to the covid crash, but it quickly recovered.
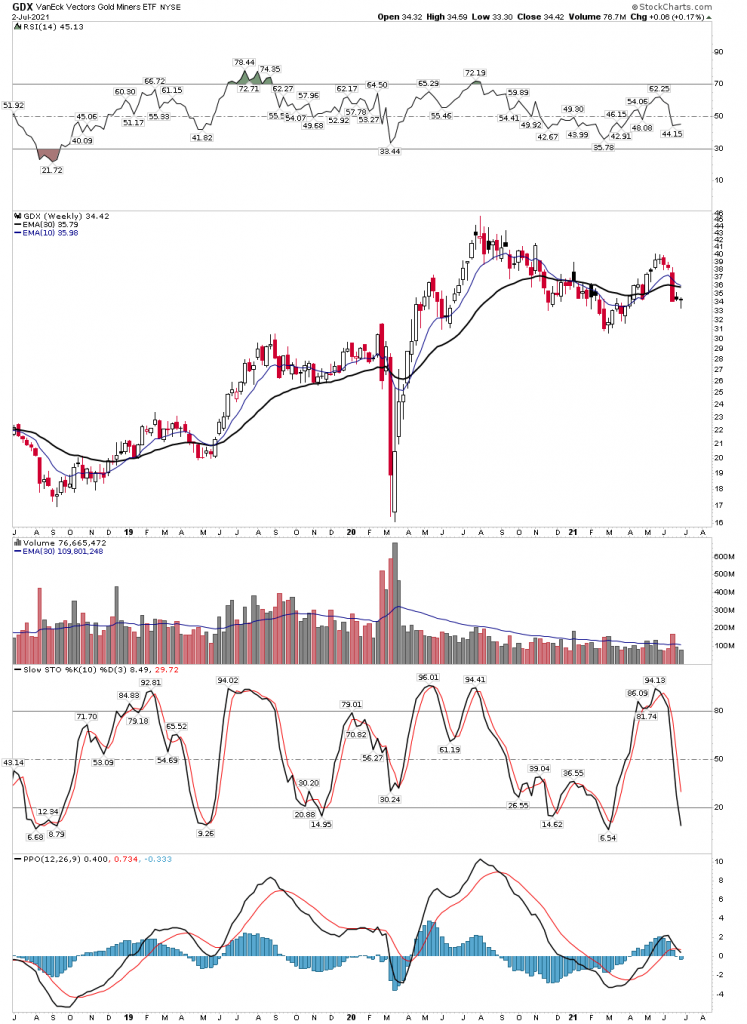
Bottom line: Until the blue lines are exceeded or a base can be built with higher highs one needs to assume the bear market remains in existence.
The Bear Market Rally
Until late February I also bought the conventional narrative that the gold stocks were in a “correction” or just a “consolidation”. But I began to realize that it was more as it had gone on for too long. Sure, corrections can last even longer, however if they are going to last 6 months or more they typically chop sideways. They don’t put in a series of continuous lower lows and lower highs. That’s what they call a bear market.
So I realized the gold stocks were in a bear market. So if this was a bear market where were the BMR’s? In late February the Hulbert Sentiment Index reached rock bottom which made me realize a BMR was likely imminent. On March 6th I posted: “I am looking for a BMR in gold, it should last 1-3 months”.
On March 9th I posted: “Looks like our BMR may have started right on schedule”
Here is what Robert Rhea taught about BMRs:
BMRs typically last from 3 weeks to 3 months. They normally retrace 33-66% of the downward swing which took many months to develop. The BMR often seems like they come out of nowhere. They do not exhibit base building usually as they often turn on a dime.
The purpose of the BMR is to reset investor psychology. By late February, investors were thoroughly battered and had sold their positions down. There was no longer enough sellers around to allow the market to drop any further. So Mr Bear’s answer to this is to reset the psychology by drawing in fresh money. He does this through a BMR. By the time the BMR is finished investor sentiment has recovered and are now bullish again, fresh money is back in the market and with Mr. Bear refueled he can resume his operation. We saw this process occur from March 3rd to May 19th… classic stuff.
On a personal note I foresaw this entire process but still fell victim to it. After selling most of my trading account in mid-April I jumped back in thinking it was indeed the real thing. Yes, I got caught up with the narrative along with others.
Analyzing the second BMR, the big one (Mar-May)
The second BMR was a big mid-bear BMR which ended up being a textbook affair IAW Robert Rhea’s principles:
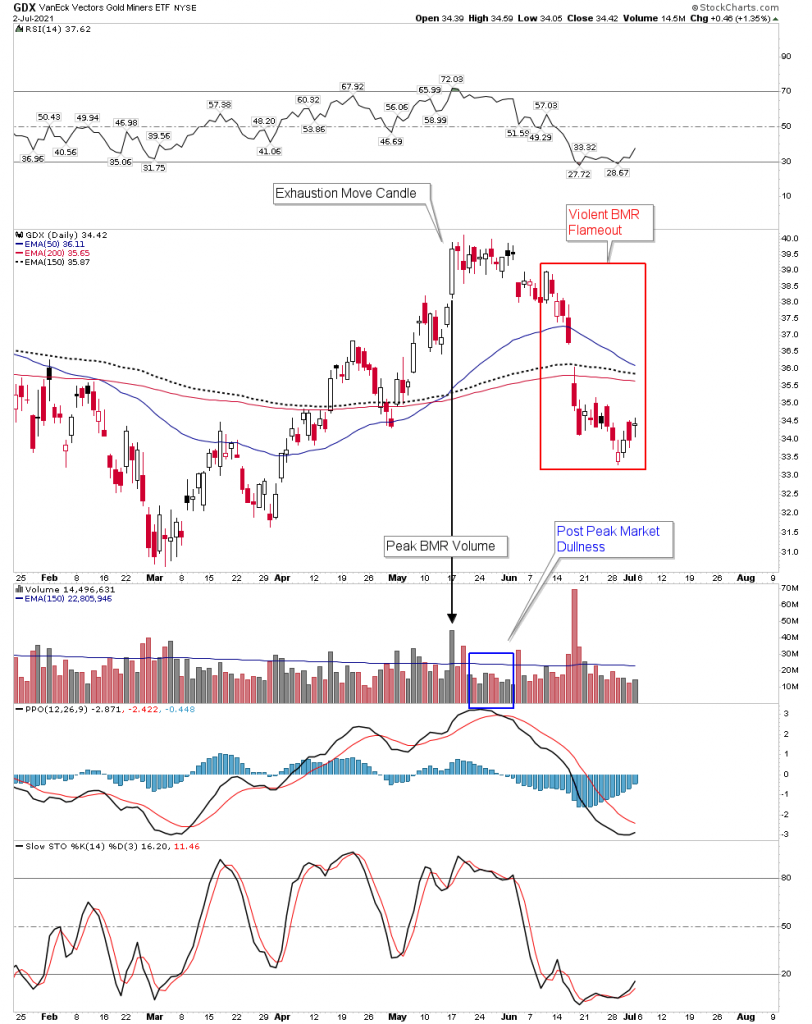
The launch occurred after a hard decline and elevated volume in late February. This flushed out the weak hands and pegged sentiment to the floor. The first leg up couldn’t hold above the 50 EMA so it corrected hard and filled its breakaway gap from the start of the move. On Mar 31 it resumed its climb until it hit predictable resistance at the 30 W EMA (150 day EMA proxy). It needed a few days to regroup and on April 15 it broke through the 30 W EMA (heavy dashed line). Note it did this on elevated volume, but not the 2-3X volume that Weinstein prefers in a bull market, this is all classic Stan Weinstein method. After a hard BT down through the 30 EMA it bounced off the 50 EMA and resumed its advance.
On May 15th price gapped up in an exhaustion end of move candle. Note it was the highest volume day of the BMR. Again, this is all textbook BMR behavior. At those highs the GDX then began to churn on low volume.
I am now going to quote directly from Rhea’s writings. Identifying the BMR top:
In such action the peak is frequently attained on a sudden increase in activity lasting a few days. After the high point has been attained , a further rally shows a definite diminution in activity, it is probable that an early resumption of the decline will occur. Dullness following the peak of a bear market rally is a common danger sign. When the primary trend is down the old adage of never sell a dull market does not apply.
It is critically important to note that after the high volume gapped exhaustion candle, the churn then began on anemic volume. This was all textbook and adds credence to the continuance of the bear market. As we will see below once volume resumed it was to the downside… again bear market action.
The Red Drop Box- BMR flameout. (above chart)
Once the BMR had exhausted itself and run its course it took about 2 weeks to bleed out its last bit of energy, then collapsed. Now here is yet another clue that the GDX is not in a bull market. It collapsed in violent fashion gapping across all significant moving averages in one fell swoop on massive volume. This is clear bear market action. The preceding rally was built on air because it was a BMR, NOT an organic upside rally with built in support levels which would have slowed its fall. Instead we witness a violent catastrophic collapse the type that one gets in a bear market.
A word on market manipulation: I am convinced gold and silver are manipulated by the big 8 bullion banks, the evidence is irrefutable. Ted Butler’s newsletter chronicles the antics of these banks in an objective believable mannor. These banks exacerbated the speed and extent of the move down, however I also recognize that manipulation is only effective if done in the direction of trend. The charts show this decline was already in the cards, any manipulation simply gave it an extra kick.
So my point is this recent collapse is a demonstration of bear market action exacerbated, but not caused by manipulation.
BMR #1 Distinct Similarities
At the time, I regarded BMR #1 as the end of the “correction” and the bull market was now resuming. But we can now see that it had the classic characteristics of any BMR. I classify this move a BMR because it lasted 5 weeks and it wasn’t just a knee-jerk move since it had drawdowns and advances within the move.
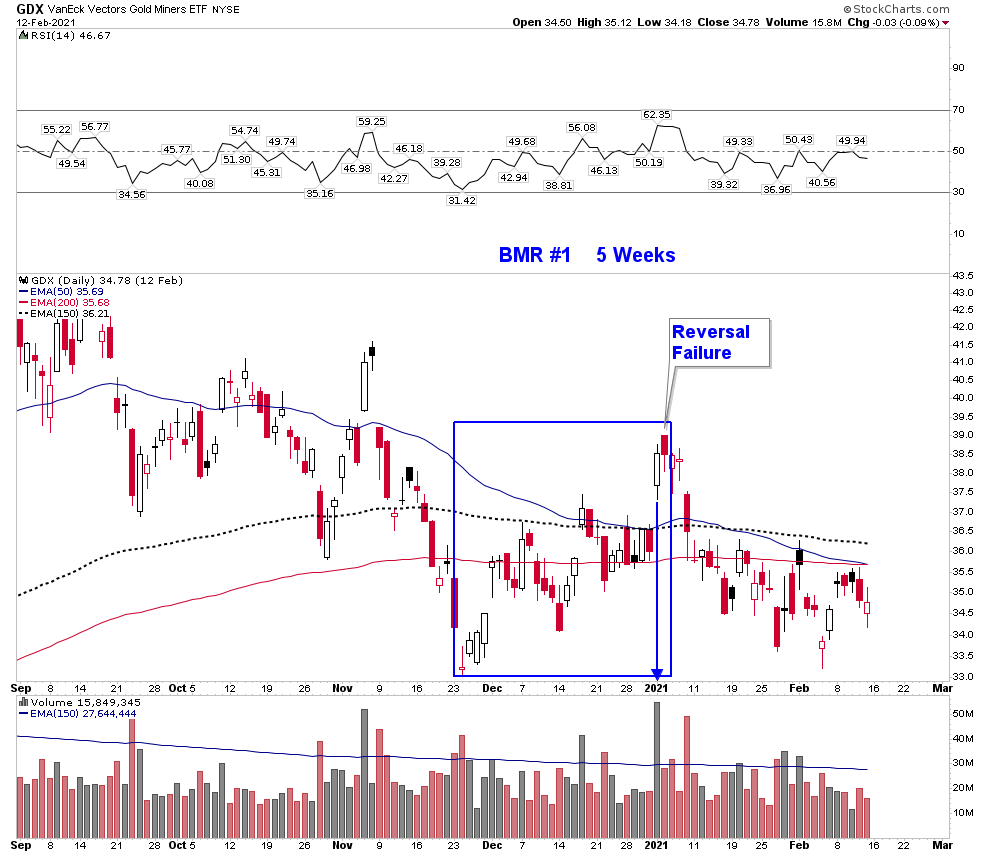
Note BMR #1 ended in similar fashion as BMR # 2. It ended in an exhaustion candle with a high volume gap powering through the 30 EMA.
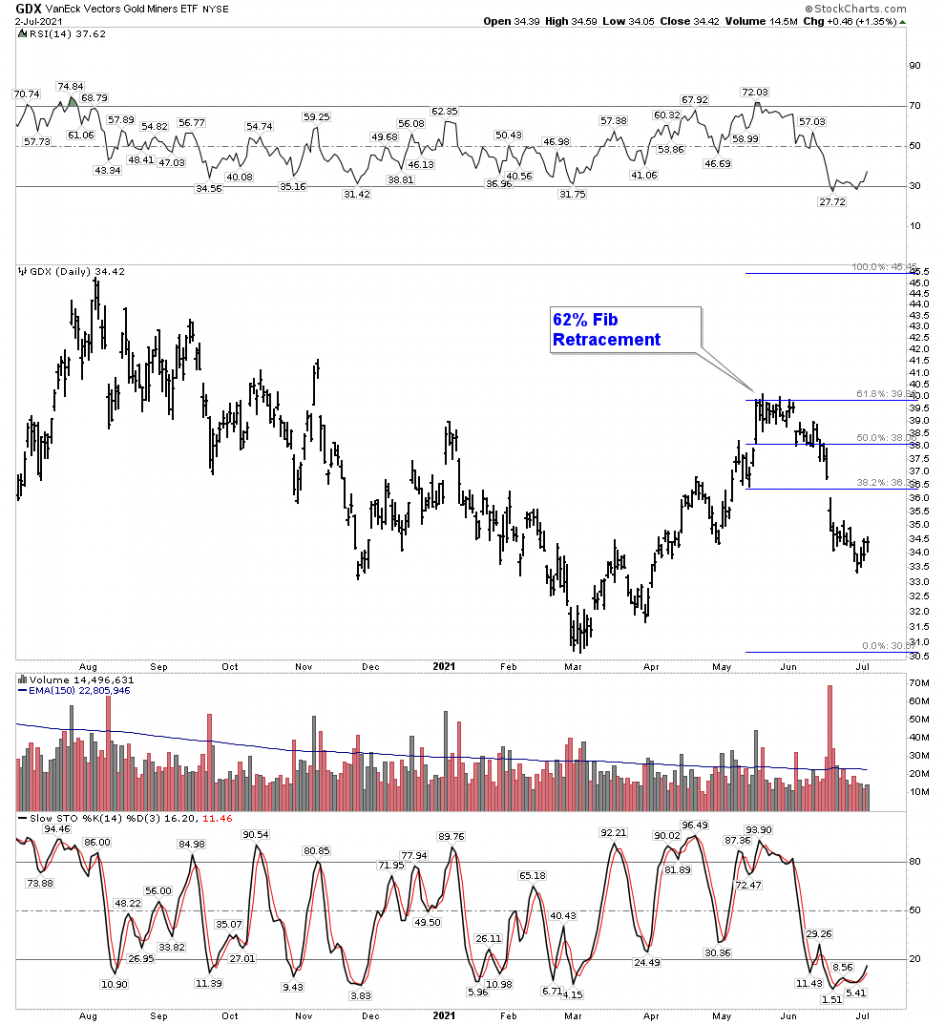
BMR classic Fib retracements
Below we see that BMR # 2 retraced 62% of the entire bear markets decline. The BMR reset the bearish sentiment and retraced a perfect 62% of the previous decline, just what one would expect from a fully developed BMR.
BMR #1 retraced exactly 50%.
So If the gold stocks are still in a bear market, what’s the likely outcome?
Phase III with lower lows is the likely outcome. But as the BMRs demonstrated a bear market doesn’t go straight down. After the recent June smash the stocks remain washed out with depressed sentiment, but in the past 10 trading sessions they have attempted to find their footing. In addition, seasonal patterns are now at the back of the gold and silver stocks at least for the next 2-3 weeks. Short term stochastics have based and are now headed up. RSI has now demonstrated a positive divergence. In short, a rally has likely begun which could last 2-3 weeks IMO.
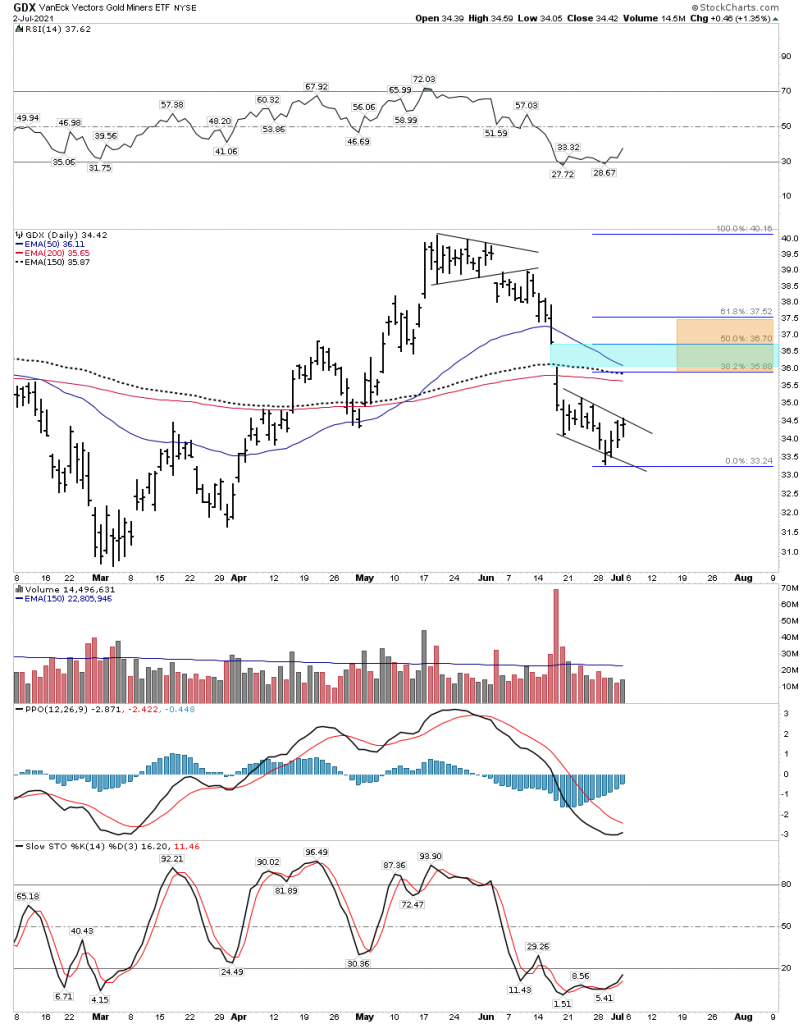
It would be normal to expect a retracement between 31-62% of the decline as shown by the tan shading. However since sentiment was higher than it was in early March I would not expect the full range of retracement. Additionally, the unfilled gap will act as a magnet to the price action. Also we see the convergence of the 3 moving averages, these will serve as a resistance cap. Myself, I just don’t see a powerful rally developing out of this set-up, but I am trying to eek a few points from it.
But once the rally exhausts itself keep in mind the GDX is entering into a mature phase II. This is where bear markets become very destructive, especially as they transition into phase III. Now that the big BMR is behind it the market will not have much energy to kick off strong rallies, instead they will be anemic. Professional traders will look for rallies to peter out and will short heavily. Neophytes hanging onto thin reeds claiming it’s still just a correction will get crushed.
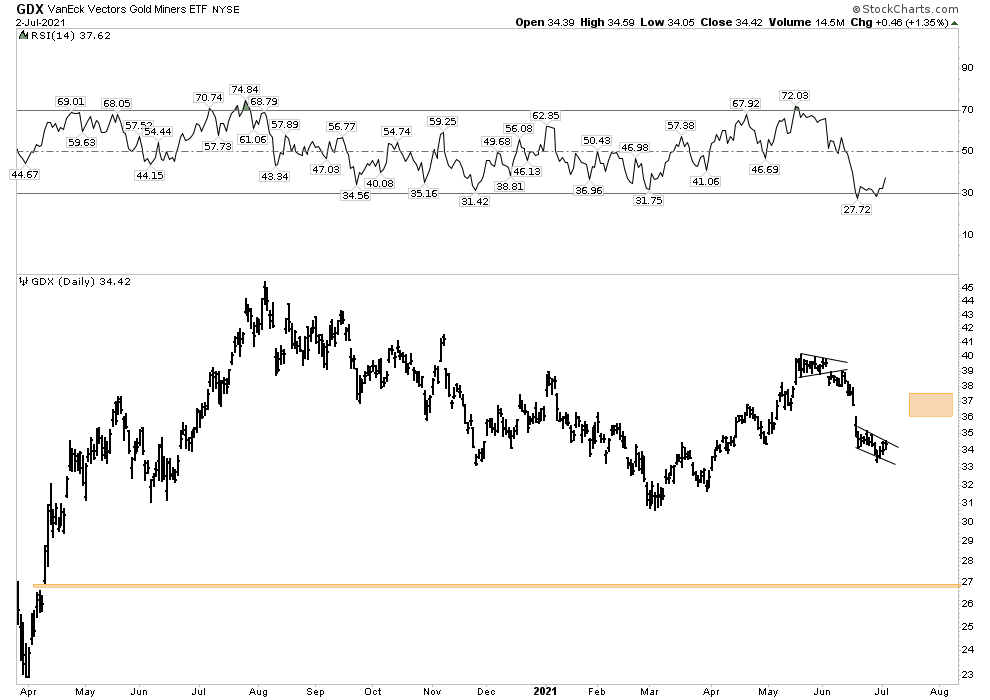
How Far Down?
For a long while now I have pointed out that the breakout gap in the GDX from early April 2020 has been patiently waiting to be filled. If the GDX eventually rolled over and returned to the March lows just above 30 that gap just under 27 comes into play IMO. This would be the ideal place to look for a final bottom in the gold stock bear market.
A break of the GDX 30 level would kick off phase III IMO. Depending on market structure it could be quick work in a flash crash style to fill that gap or it could develop into an agonizing annihilation drive. There is no way to know.
The Strategy
This entire view point could be flat out wrong. But I have identified the criteria of how to know this. If GDX and gold can close above the BMR May highs then I will have to formulate a new plan. Otherwise we look for daily clues that Mr. Market reveals to us. Honestly, I am rather upset with myself. Mr. Market gave us enough clues as I have outlined above, but I got lazy and allowed other opinions to sway my own actions.
Going forward however I see great opportunity. If I am correct the opportunity is there to acquire more shares due to lower prices and will have avoided the slaughter. I wanted to discuss the dynamics of the post bubble contraction bull market in gold stocks which I expect to arrive before the end of this year, but I’ll save that for next time.
Plunger
About the author
