“There is nothing like losing all you have in the world for teaching you what not to do. And when you know what not to do in order not to lose money, you begin to learn what to do in order to win. Did you get that? You begin to learn!”
—Edwin Lefèvre, American journalist, writer, diplomat, noted for writings on Wall Street, author of Reminiscences of a Stock Operator, 1922; 1871–1943
“Based on my own personal experiences—both as an investor in recent years and an expert witness in years past—rarely do more than three or four variables really count. Everything else is noise.”
—Martin J. Whitman, American investment advisor, founder and co-chief investment officer Third Avenue Value Fund; 1924–2018
“Change is the law of life. And those who only look to the past or present are certain to miss the future.”
—John F. Kennedy, JFK American politician, 35th President of the United States 1961–1963, author of Profiles in Courage, a book that won the Pulitzer Prize; 1917–1963
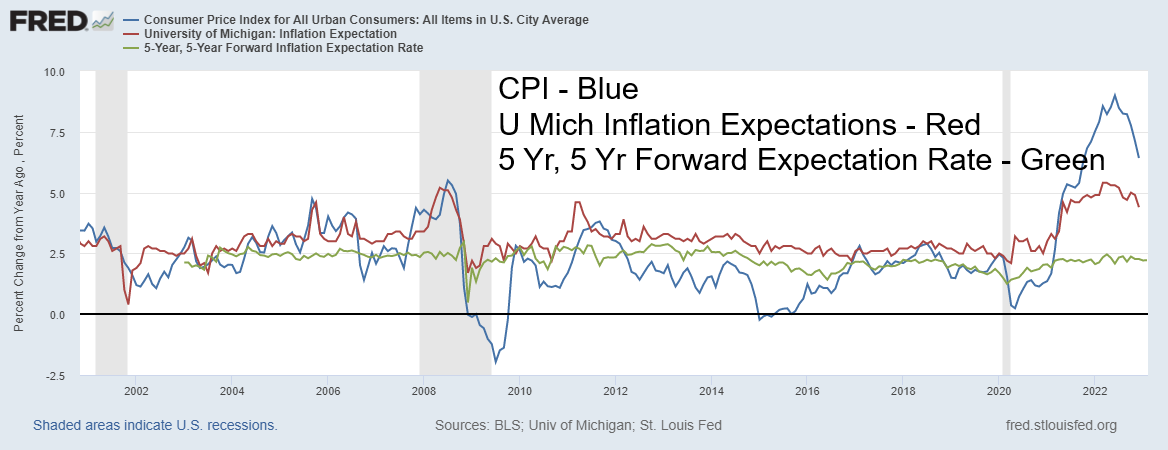
We confess we are surprised at how quickly the markets have become bullish. Yet many are proclaiming that a new bull market is underway, that there might not even be a recession or only a mild one, that inflation is coming down and soon won’t be problem. Yes, the stock market, as measured by the S&P 500, has rallied some 6.5% in 2023 after a miserable 2022 when the S&P 500 lost 19.4%. Inflation, which peaked at 9.0% in June 2022, has fallen to 6.4%. Next Tuesday, February 14, we get the January Consumer Price Index (CPI), which is expected to fall further. Inflation expectations are coming down with the University of Michigan Inflation Expectations Index last at 4.4% vs. a peak of 5.4%. Finally, the 5-year, 5-year forward inflation expectation rate has fallen to 2.22% from its peak of 2.67%. Even consumer sentiment has perked up as the most recent (preliminary) reading of the Michigan Consumer Sentiment Index rose to 66.4, above last month’s 64.9 and the expected 65. Happy days are here again, or so it would seem.
As to inflation, well, a look at inflation in the 1970s saw it also come down sharply from a peak of 12.1% in December 1974 to 5.2% in January 1977. Then it rose again, peaking at 14.6% in March 1980. Be careful what we wish for? And for the stock market, a year ago the Fear & Greed Index was recording fear at 32 (it had been even lower, below 25, showing extreme fear). Now it is last at 73, showing greed and had been over 75, showing extreme greed. Yet the S&P 500 remains over 700 points or 15% below its all-time high. Things have changed.
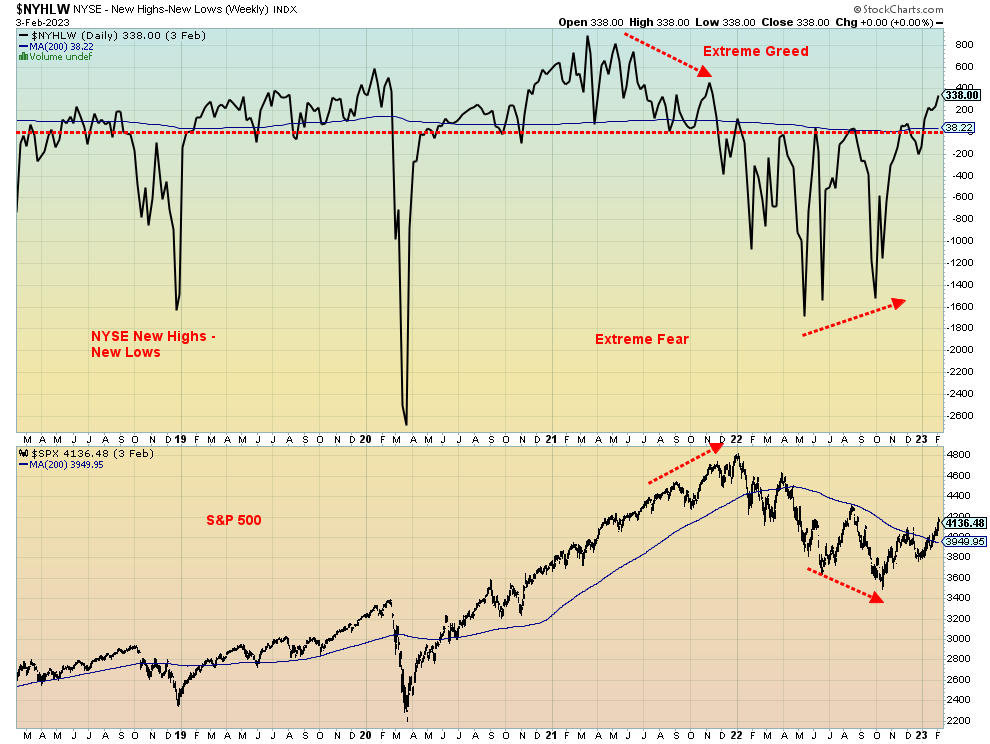
But other measurements are showing that the stock market has become quite bullish. The NYSE New Highs less New Lows ratio is currently at 338, as high as it has been since the latter part of 2022 when the market was peaking. The peak was actually seen in March 2021 at 885. By January 2022 when the S&P 500 topped, it
had fallen to 133, diverging with the index. Other measurements are the McClellan Summation Index Ratio
adjusted that has leaped to almost 1,100, levels seen during the great bull run in 2020–2022. What that means, of course, is that the stock market has not necessarily topped but things have become quite bullish. Has the market gotten ahead of itself?
US CPI, University Michigan Inflation Expectations, 5-Year, 5-Year Forward Expectations 2001–2023
Source: www.stlouisfed.org
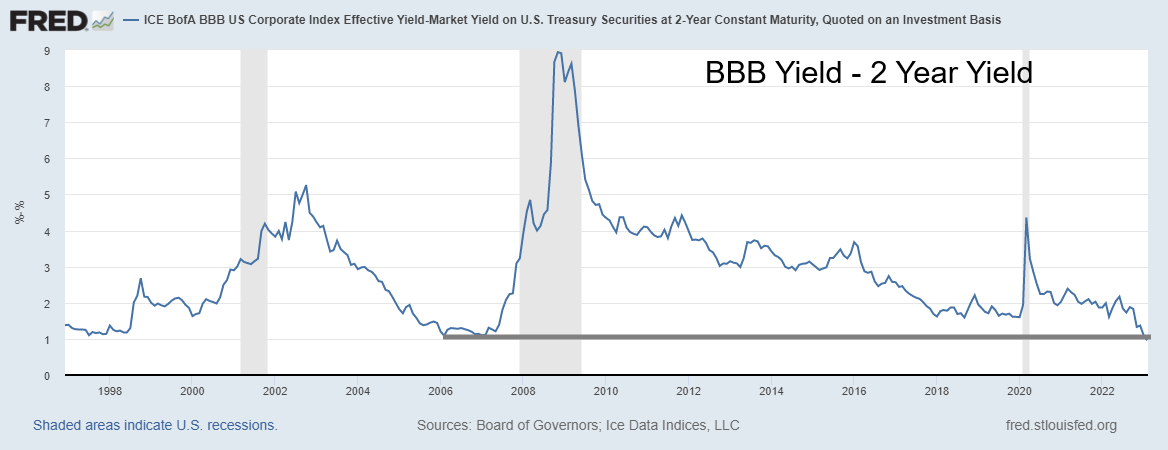
Things are so good that the weakest investment grade bond BBB yield (BBB is the lowest investment grade and where 53% of investment grade bonds are rated) is only 96 basis points (bp) more expensive than a 2-year treasury note that has no, well almost no credit risk. Even with AAA bonds (very few) the spread is virtually nil, which is also a record low. Risk, what risk?
Investment Grade BBB Bond Yield less 2-Year Treasury Note Yield
Source: www.stlouisfed.org
NYSE New Highs – New Lows Index 2018–2023
Source: www.stockcharts.com
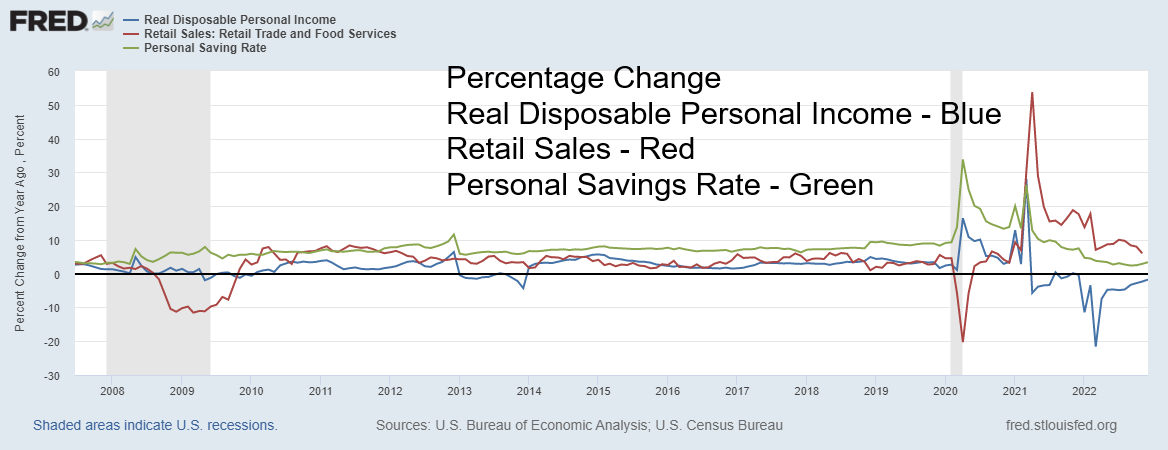
While consumer sentiment is showing signs of improvement, it is not necessarily showing up in retail sales. Retail sales have been sliding for the past two months (last down 1.1% for December), although on year-over-year (y-o-y) basis they are up; however, overall, they have turned negative. Personal disposable income has also been falling and the personal savings rate at 3.4%, while an improvement in the past month, is still near a record low. The housing market has been sliding with prices off roughly 6.5% from the peak in the U.S. In Canada it’s worse, down roughly 9%, but in a number of areas it is a lot more. The correction in the housing market has not as yet bottomed.
All these seem to belie the improving market. The Fed isn’t done yet and typically, even if the Fed decides to pause, it is historically at least six months before rate cuts might be coming (a pivot). With employment so strong (and quite strong in Canada as well), the odds of a pause are low. The stock market doesn’t tend to
bottom until the Fed pauses. According to economist David Rosenberg (rosenbergresearch.com), S&P bottoms take another 16 months before they hit bottom following a pause.
Personal Disposable Income, Retail Sales – Percentage Change, Personal Savings Rate 2007–2023
Source: www.stlouisfed.org
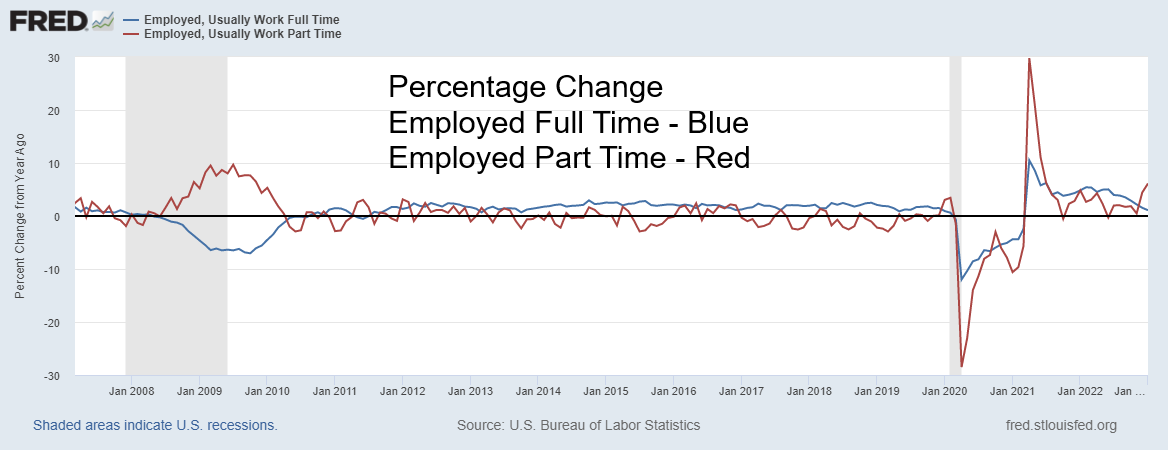
While the job market is still exhibiting strength, as seen by the most recent nonfarm payrolls, the additional jobs are mostly part-time. The percentage working full-time has been falling, while for part-time it has been rising. Since peaking last May 2022, some 444,000 fewer are employed full-time but 1,630,000 more are employed part-time in the same period.
Source: www.stlouisfed.org
The two main indicators we follow are leading economic indicators and the spreads between the 2-year treasury note and the 10-year treasury note (2–10 spread), along with the spread between the 3-month treasury bill and the 10-year treasury note (3m–10 spread). All continue to indicate a coming recession. The question is when, not if. The recession typically doesn’t get underway until the yield curve begins to normalize. At this time spreads are still quite wide with the 2–10 spread at negative 79 bp and the 3m–10 spread at negative 105 bp.
All this indicates to us that if a recession is to get underway, it won’t start until the latter part of the year. The pandemic recession occurred six months after the peak negative for the 3m–10 spread. At that time the 3m–10 spread bottomed at negative 49 bp in August 2019 and the recession was underway in February 2020. By that time the 3m–10 spread had narrowed to negative 14 bp. Despite the negative or inverted yield curve, we read that many are now questioning the validity of the inverted yield curve. But the experience is a long delay is typical between the bottom of the inverted yield curve and the start of a recession.
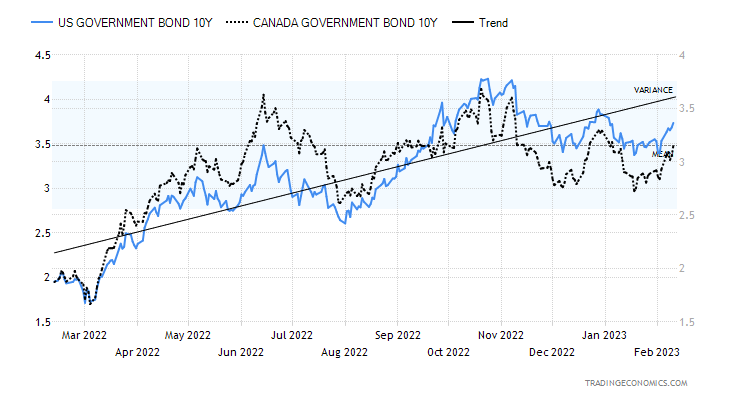
Bond yields have begun to tick higher, reflecting the concern that the Fed is not yet done and the jobs market remains so strong, at least on the surface. As well, job vacancies, while off their highs, remain elevated and well above previous periods. There would appear to be a labour shortage, even as job openings may not match skills that job-seekers are offering.
Bond Yields Ticking Higher - 10-year Treasury Bond/Canadian 10-year Government Bond (CGB)
Source: www.tradingeconomics.com, www.home.treasury.gov, www.bankofcanada.ca
On the surface, things do appear to be improving. But underneath, the rot continues. The debt ceiling has still not reached crisis proportions. As noted, bond yields are rising and that could spill further into loan and mortgage rates. Despite rising bond yields, we still have had no major failure as a result of the rise. Although Credit Suisse’s name keeps popping up as a potentially big problem area.
The situation in Europe with the war between Ukraine and Russia could still morph into something bigger as NATO/U.S. become more deeply entrenched. Oil prices could rise further as Russia cuts production oil production by 500,000 bpd in March in response price caps and sanctions. OPEC plans no action as a result of the cuts.
All the talk we’ve heard of a new bull market, collapsing inflation, and a coming “goldilocks” economy all seem to be premature. There remain too many danger zones that could see the situation change quickly. Prudence and caution are still advised, despite the recent improvement.
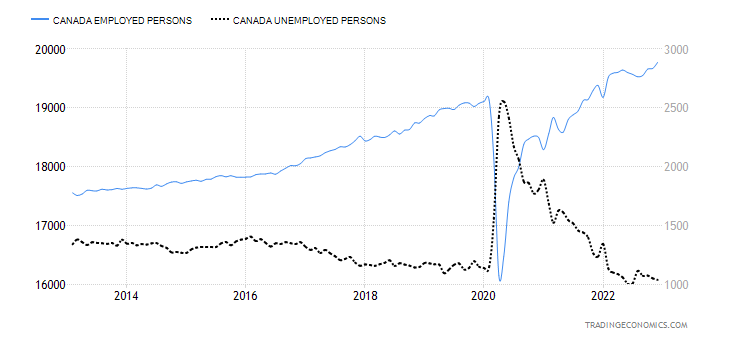
Canada’s Job Numbers
Source: www.tradingeconomics.com, www.statcan.gc.ca
Once again, Canada delivered a blockbuster employment number. Canada created 150,000 jobs in January, well above the expected 15,000 gain. In December the gain was 69,200 jobs. It’s the largest increase since a year ago February. Full-time employment jumped 121,100 while part-time was up 28,900. The employment rate rose to 62.5%, up from 61.8% while the labour force participation rate was 65.7 vs. 65.4 in December. The unemployment rate was 5%, the same as December but below the expected 5.1%. It wasn’t all good news as the R8 unemployment rate (which includes discouraged searchers and the waiting group portion of involuntary part-timers) rose to 7.4% from 6.3%. It is the highest R8 since August 2022; the last time it was over 7%.
All of this raises questions as to what the Bank of Canada (BofC) will do. They announced a pause in their rate hikes, but could this change it? BofC Governor Till Macklem has indicated that he expects Canada’s growth rate to be close to zero over the first three quarters of 2023. With continued job growth there could be further upward pushes on wages and that in turn could keep inflation high. The Government of Canada is just beginning to negotiate with the civil service and they appear to be far apart. As well, provinces such as Ontario are also facing wage growth pressure. Job vacancies remain high.
Chart of the Week
Source: www.stockcharts.com
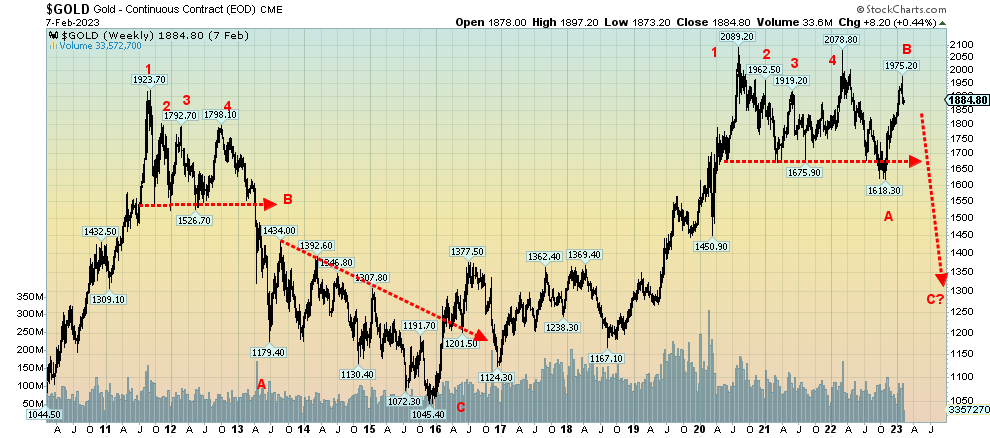
Last week we showed you a chart of gold centering on what appears as a huge potential topping pattern for gold over the period 2020–2023. This is a different view. What struck us is what appear to be similarities between the topping pattern of 2011–2013 and the current potential topping pattern. No, these patterns are never exactly the same, but there does appear to be some rhyming.
Yes, the 2011–2013 topping did occur in a shorter period of time. Setting aside absolutes, we note the top in September 2011 (1) at $1,924, a three-pronged correction with the top in November 2011 (2) at $1,804, another drop followed by another rebound and top in February 2012 (3) at $1,792 followed by another drop, then a rebound again to a top in October 2012 (4) at $1,798. Each time a drop came, support was found in the $1,525 range. Then, in April 2013 we dropped through the bottom of $1,525 and, just like that, gold prices fell viciously to a low in June 2013 (A) at $1,179. That was then followed by a rebound rally to a high in August 2013 (B). That recovered roughly 40% of the collapse. The collapse under $1,525 caught a lot of people by surprise. Gold then began a long irregular descent to its final low of $1,045 (C) in December 2015. As we have noted, that low was also an important 7.83-year cycle low measured from the last one in October 2008, a period of 7.2 years.
The current pattern is spread out over a longer period of time from August 2020 to the present. The top came in August 2020 (1) at $2,089. We had a decline, then a rebound rally that took us to $1,962 in January 2021 (2). Another drop followed and this time the rebound took us to June 2021 (3) at $1,919. Once again a drop followed to a low at $1,675 in August 2021 which was roughly equivalent to the low seen a only a few months earlier at $1,673 in March 2021. Another rebound followed, taking us to a potential double top at $2,079 in
March 2022. Then another decline got underway and this time we broke support that had formed at $1,675 and hit a low of $1,618 in November 2022 (A). Now another rebound has developed and so far, it has only taken us to a top in February 2023 (B) at $1,975. That rebound has recaptured 78% of the most recent decline.
The collapse under support at $1,675 did not result in a complete meltdown as occurred in 2013 when $1,525 support broke. That doesn’t invalidate the breakdown. And the rebound has been impressive. But as we have noted, silver, unlike gold, has not been making new highs along with gold. Gold made those highs at $2089 and $2079 but silver’s high of roughly $50 has barely been approached. While gold was making new highs, silver topped out at $29.92 and $27.50. Not even close. Second, last week we saw an outside reversal week with new highs for gold followed by a sharply lower close. Silver fared worse—not only did it not make new highs but its close was even more sharply lower.
While we cannot eliminate the potential for new highs, the reality is only new highs will tell us that the November 2022 low was our 7.83-year cycle low. That low came 6.9 years after the December 2015 low. A more ideal time frame for our 7.83-year cycle low would be centered on October 2023 +/- 6 months. Targets could be anywhere from $1,200 to $1,500. The trouble only starts once gold breaks back under $1,675/$1,700, but a break under $1,775/$1,800 would be the first real sign of trouble. Again, only new highs above $2,089 could change this scenario. There are reasons that could happen including more twists in the ongoing Russia/Ukraine/NATO war.
Markets & Trends
|
|
|
|
% Gains (Losses) Trends
|
|
||||
|
|
Close Dec 31/22 |
Close Feb 10/23 |
Week |
YTD |
Daily (Short Term) |
Weekly (Intermediate) |
Monthly (Long Term) |
|
|
Stock Market Indices |
|
|
|
|
|
|
|
|
|
`S&P 500 |
3,839.50 |
4,090.64 |
(1.1)% |
6.5% |
up |
up |
up (weak) |
|
|
Dow Jones Industrials |
33,147.25 |
33,869.27 |
(0.2)% |
2.2% |
up (weak) |
up |
up |
|
|
Dow Jones Transport |
13,391.91 |
15,042.93 |
(3.1)% |
12.3% |
up |
up |
up |
|
|
NASDAQ |
10,466.48 |
11,718.12 |
(2.4)% |
12.0% |
up |
up |
neutral |
|
|
S&P/TSX Composite |
19,384.92 |
20,612.12 |
(0.7)% |
6.3% |
up |
up |
up |
|
|
S&P/TSX Venture (CDNX) |
570.27 |
613.42 |
(1.1)% |
7.6% |
up (weak) |
neutral |
down |
|
|
S&P 600 (small) |
1,157.53 |
1,265.61 |
(3.5)% |
9.3% |
up |
up |
up |
|
|
MSCI World Index |
1,977.74 |
2,134.53 |
(1.0)% |
7.9% |
up |
up |
up (weak) |
|
|
Bitcoin |
16,535.23 |
21,698.30 |
(8.1)% |
31.2% |
neutral |
up (weak) |
neutral |
|
|
|
|
|
|
|
|
|
|
|
|
Gold Mining Stock Indices |
|
|
|
|
|
|
|
|
|
Gold Bugs Index (HUI) |
229.75 |
235.59 |
(3.4)% |
2.5% |
down |
up (weak) |
neutral |
|
|
TSX Gold Index (TGD) |
277.68 |
281.41 |
(3.4)% |
1.3% |
down |
up |
neutral |
|
|
|
|
|
|
|
|
|
|
|
|
% |
|
|
|
|
|
|
|
|
|
U.S. 10-Year Treasury Bond yield |
3.88% |
3.74% |
6.3% |
(3.6)% |
|
|
|
|
|
Cdn. 10-Year Bond CGB yield |
3.29% |
3.16% |
8.2% |
(4.0)% |
|
|
|
|
|
Recession Watch Spreads |
|
|
|
|
|
|
|
|
|
U.S. 2-year 10-year Treasury spread |
(0.55)% |
(0.79)% |
(2.6)% |
(43.6)% |
|
|
|
|
|
Cdn 2-year 10-year CGB spread |
(0.76)% |
(0.93)% |
(3.3)% |
(22.4)% |
|
|
|
|
|
|
|
|
|
|
|
|
|
|
|
Currencies |
|
|
|
|
|
|
|
|
|
US$ Index |
103.27 |
103.54 |
0.7% |
0.3% |
neutral |
down |
up |
|
|
Canadian $ |
73.92 |
74.90 |
0.3% |
1.3% |
up |
down (weak) |
down |
|
|
Euro |
107.04 |
106.81 |
(1.1)% |
(0.2)% |
down (weak) |
up |
down |
|
|
Swiss Franc |
108.15 |
108.27 |
0.2% |
0.1% |
neutral |
up |
neutral |
|
|
British Pound |
120.96 |
120.58 |
flat |
(0.3)% |
down |
up |
down |
|
|
Japanese Yen |
76.27 |
76.08 |
(0.2)% |
(0.3)% |
neutral |
up |
down |
|
|
|
|
|
|
|
|
|
|
|
|
|
|
|
|
|
|
|
|
|
|
Precious Metals |
|
|
|
|
|
|
|
|
|
Gold |
1,826.20 |
1874.50 |
(0.1)% |
2.6% |
neutral |
up |
up |
|
|
Silver |
24.04 |
22.08 |
(1.5)% |
(8.2)% |
down |
up (weak) |
up (weak) |
|
|
Platinum |
1,082.90 |
951.80 |
(2.9)% |
(12.1)% |
down |
neutral |
up |
|
|
|
|
|
|
|
|
|
|
|
|
Base Metals |
|
|
|
|
|
|
|
|
|
Palladium |
1,798.00 |
1,524.90 |
(5.8)% |
(15.2)% |
down |
down |
down |
|
|
Copper |
3.81 |
4.02 |
(1.1)% |
5.4% |
neutral |
up |
up (weak) |
|
|
|
|
|
|
|
|
|
|
|
|
Energy |
|
|
|
|
|
|
|
|
|
WTI Oil |
80.26 |
79.72 |
8.6% |
(0.7)% |
up (weak) |
down |
up (weak) |
|
|
Nat Gas |
4.48 |
2.51 |
4.2% |
(44.0)% |
down |
down |
down (weak) |
|
Source: www.stockcharts.com
Note: For an explanation of the trends, see the glossary at the end of this article.
New highs/lows refer to new 52-week highs/lows and, in some cases, all-time highs.
Source: www.stockcharts.com
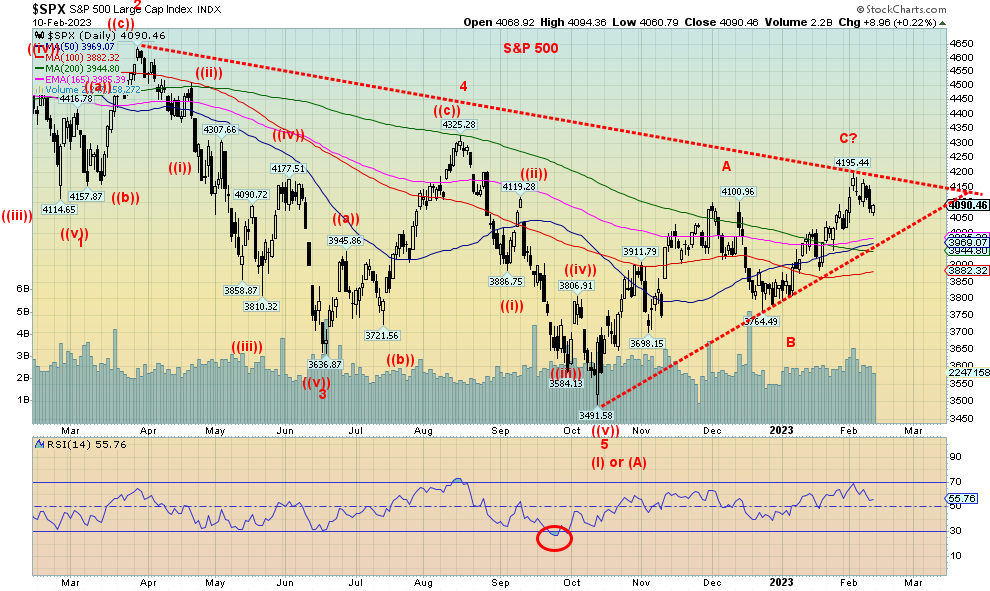
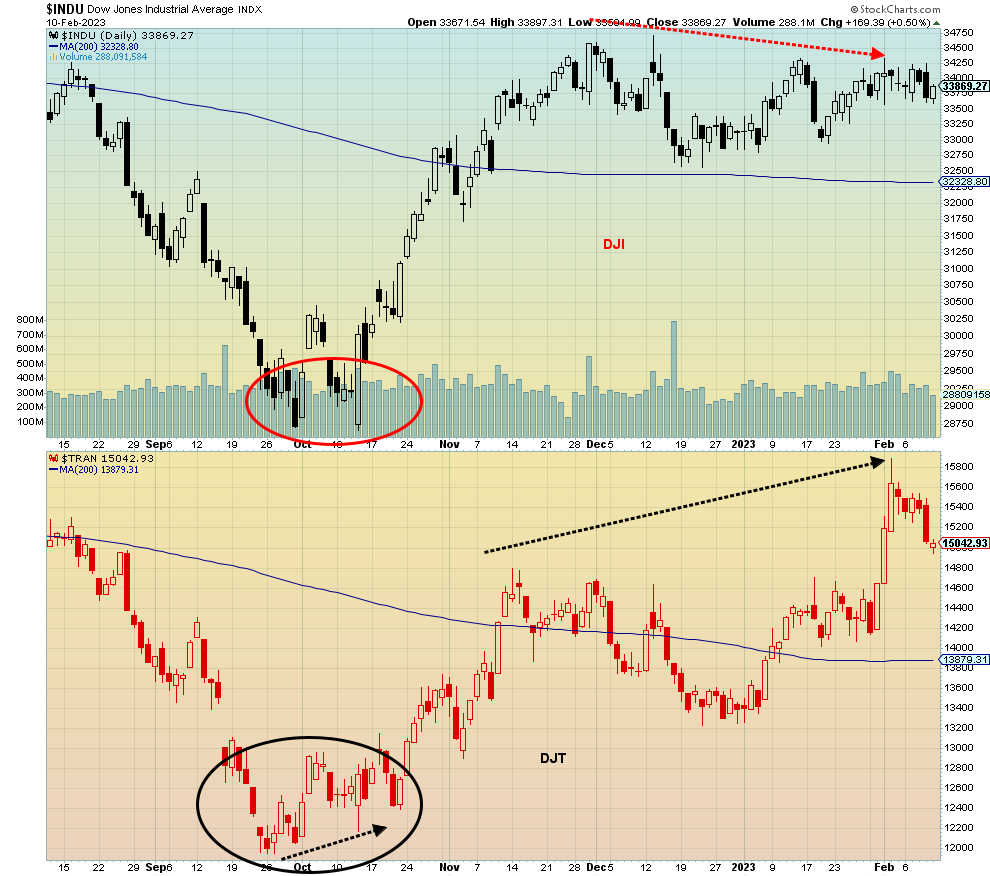
After rising for six of the past seven weeks, the S&P 500 faced the fear of rising interest rates and lost 1.1% this past week. The Dow Jones Industrials (DJI) suffered less, off 0.2% But the Dow Jones Transportations (DJT) fell 3.1% and the NASDAQ was down 2.4%. The DJT recently made new highs but the DJI did not, a divergence. The Bitcoin bloom may also be coming off as it fell 8.1%.
In Canada, the TSX Composite was off 0.7% and the TSX Venture Exchange (CDNX) fell 1.1%. In the EU, the London FTSE was off 0.4%, the EuroNext dropped 1.2%, the Paris CAC 40 was down 1.4%, and the German DAX dropped 1.1%. In Asia, China’s Shanghai Index (SSEC) was down a small 0.1%, the Tokyo Nikkei Dow (TKN) was a gainer, up 0.6%, but Hong Kong’s Hang Seng Index (HSI) dropped 2.2%.
The uptrend for the S&P 500 remains intact with the uptrend line below near 3,975. A drop under that level and especially under 3,900 could set up further declines to 3,800. Below 3,800, the uptrend is over and under 3,700 a new decline would be well under way. Below 3,650, new lows are probable. The only thing that could change at least a temporary pullback is new highs above 4,200. Next week’s CPI data could prove pivotal for the stock market. We note that bond yields were rising this past week as fears that the Fed might hike a lot more crept into the market. The U.S. 10-year treasury note rose this past week to 3.74%, up from 3.52% the previous week. We either get a rising stock market and falling bond yields or rising yields and a falling stock market. February is not noted for stock market gains. It is the weakest month in the so-called “best six
months.” February ranks as the second worst month of the year for the S&P 500. The January barometer says 2023 could be a strong year, but February has a history of not being a good month. A 50% gain for even a bear market rally, as we believe this is, is not impossible. That could ultimately take the S&P 500 up to new highs near 5,200. We’ve seen B waves, as we believe this is, make new highs before. Regardless of this, the key areas to achieve at minimum are the 50% retracement near 4,155 (achieved last week) and the 61.8% retracement near 4,300. Above 4,500, new highs become possible. Below 3,650, it’s the opposite as new lows loom.
Source: www.stockcharts.com
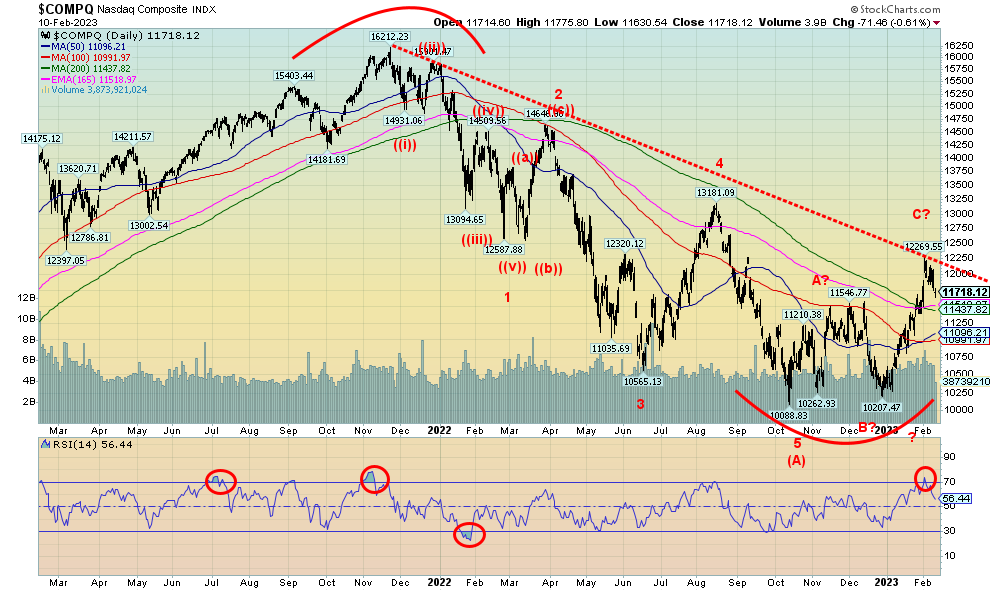
After six consecutive weeks to the upside, the NASDAQ fell this past week by 2.4%. It wasn’t a good week for the FAANGs as the NY FANG Index lost 3.3%. Leading the way to the downside was the downsizing Google, off 9.9%. Meta, after a strong run, was down 6.6%. Winners were Microsoft, up 1.8%, and Tesla as it continued its recent recovery, gaining 3.6%. The NASDAQ hit a downtrend line from the November highs. That means it is important to take out 12,300 if we are to move higher. Only new highs could change the negative run seen this past week. Still, the NASDAQ has considerable support down to 11,400 and 11,000. Below 10,900, however, the NASDAQ would turn decidedly bearish. We are coming off overbought conditions when the RSI hit over 70. New highs would end any discussion of the potential for a sharp pullback.
Source: www.stockcharts.com
We couldn’t help but notice the potentially negative divergence between the DJI and the DJT. The DJT continued higher to new highs for the recent up move, but the DJI did not confirm and, instead, appears to be rolling over. The averages must confirm each other, a key tenet of Dow Theory. When they don’t, we get suspicious. The most likely next move, according to Dow Theory, is down. Note how, at the October bottom, the DJT was making a higher bottom while the DJI was not.
Source: www.stockcharts.com
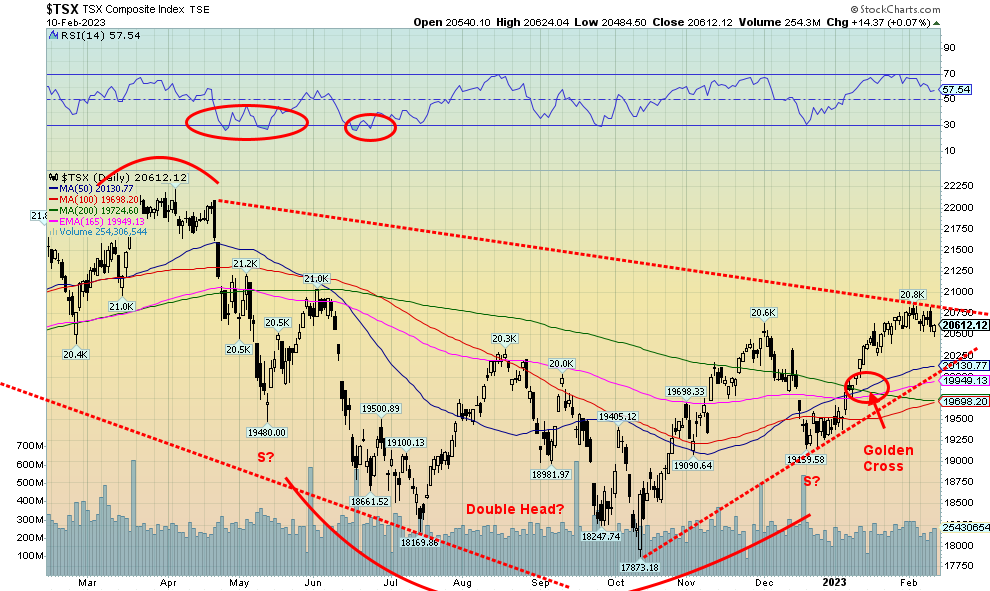
The TSX rolled over last week along with the U.S. market. The TSX lost 0.7%. The junior TSX Venture Exchange (CDNX) was down 1.1%. Twelve of the 14 sub-indices were down on the week. But the one big gainer was Energy (TEN) that was up 4.2%. Consumer Staples (TCS) was the only other gainer, up 1.9%. Energy is the second largest component of the TSX behind Financials, which makes up some 31.7%. Energy is distant second at 13.5%. Leading the losers was Health Care (THC), down 8.4%. Consumer Discretionary (TCD) came off its highs, losing a sharp 6.0%. Other major losers were Golds (TGD), down 3.4%, Metals & Mining (TGM), off 3.1%, and Materials (TMT), down 3.7%. Information Technology (TKK) lost 3.4%. With China reopening it was surprising to see the materials down. Friday saw an up day after opening lower, so this might be positive going into the coming week. There is definitive support down to 20,100, but below 20,000 it becomes more difficult and under 19,500 the rebound is most likely over. Below 18,500, new lows are very likely. What’s problematic is that the market is looking like it is rolling over. Only new highs above 21,000 could change a potential drop underway. Friday’s up close might help us in the early going this week, but will it last?
Source: www.stockcharts.com
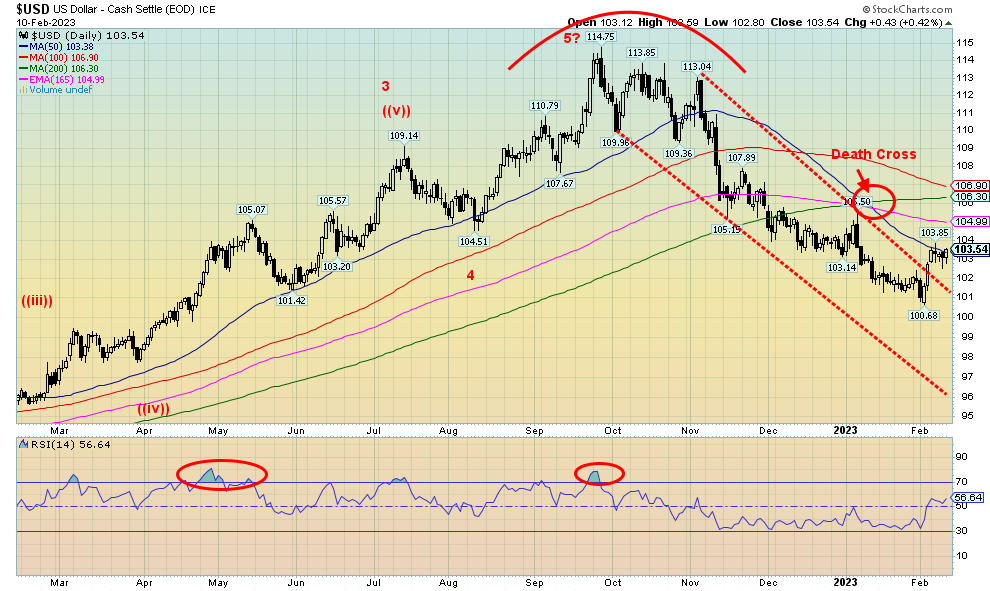
Has the US$ Index broken out? We appear to have broken out of a long downtrend line for the US$ Index. Then we stalled at the first resistance point of the 50-day MA near 103.85. Over 104 would tell us we could be heading higher toward major resistance at 106/107. This past week the US$ Index rose 0.8%. The euro lost 1.1%, but the Swiss franc was up 0.2%, the pound sterling was flat, but the Japanese yen fell 0.2%. The Canadian dollar gained 0.3%, thanks to higher oil prices. The currencies appear to be headed for trouble so that would be positive for the US$ Index and negative for gold. Only a breakdown under 101 would change this emerging upward scenario. However, we are at a level where either we proceed higher or we reverse and go back down. Next week, the release of the January CPI is important as it could determine the next direction for the US$ Index. A higher-than-expected CPI could be bullish for the US$ Index and conversely bearish for gold, stocks, and interest rates. But a much lower-than-expected CPI could be bearish for the US$ Index and positive for gold, interest rates, and the stock market. The market is expecting a gain of 0.4% m-o-m and 6.2% y-o-y. Last month saw a gain of 6.5% y-o-y.
Source: www.stockcharts.com
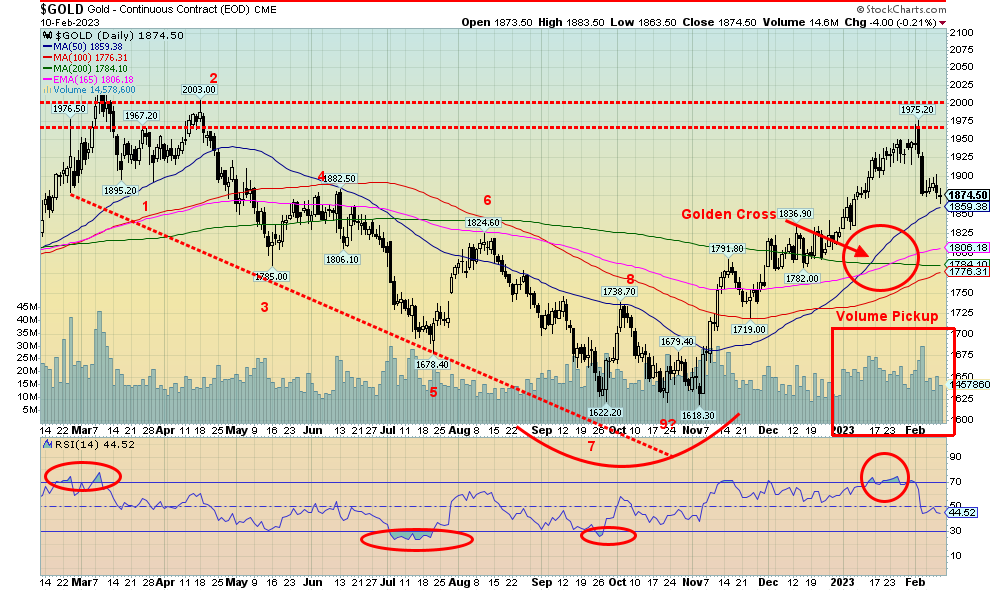
Following last weeks outside week reversal, gold continued its downward ways this past week, although the loss was a small 0.1%. The others weren’t so lucky. Silver fell 1.5%, platinum was down 2.9%, palladium dropped 5.8%, while copper fell 1.1%. The gold stocks followed with the Gold Bugs Index (HUI) and the TSX Gold Index (TGD) both off 3.4%. It was the second week of sharp losses for the gold stocks. Despite proclamations from the gold bugs that we are headed into the stratosphere for gold prices, it defies them and falls instead. The supercharged job numbers did that, along with fears that the Fed will continue to hike interest rates. While volume had increased on the recent upswing, the volume on those two down days last week when gold lost $100 was even higher. So far, we have what may be a spike top for gold. We’ve seen that before.
In the interim, we have fallen to an area of support from $1,860/$1,880. Under $1,850, further losses could be seen down to $1,775/$1,800. Below $1,775, we’d declare the bull run over. Under $1,700, new lows are highly probable. Setting aside gold making new highs in a host of other currencies, that’s all built on the rising US$ Index that appears to have broken its downtrend. Gold failed at a key resistance zone near $1,975. Above lay the final key resistance zone near $2,000. Once over $2,000, the odds of making new highs increase. A key for gold might come on Tuesday with the release of the January CPI. What gold really needs is a sign that the CPI is staying high but the economy is slowing—stagflation. As well, we need the Fed to pause its rate hikes. If that happens, gold could take off. Despite our bearish outlook for gold as we note in our Chart of the Week, gold
has still not broken down under any major zones. So, we remain hopeful that gold could still recover here. A rebound rally back to $1,925 would not be that surprising, but we’d need to break out over $1,925 to convince us that we could go higher. No argument that gold rising over $350 from its November low could easily face a one-third correction. We are now down $100 from the recent high. But if we are to move to the next level, breaking out over $1,975 could send us on our way. A breakdown under $1,775/$1,800 would be a sign that the gold rally is probably over.
There is no COT this week as the CFTC has been experiencing an apparent ransomware attack and the issues are still not resolved.
Source: www.stockcharts.com
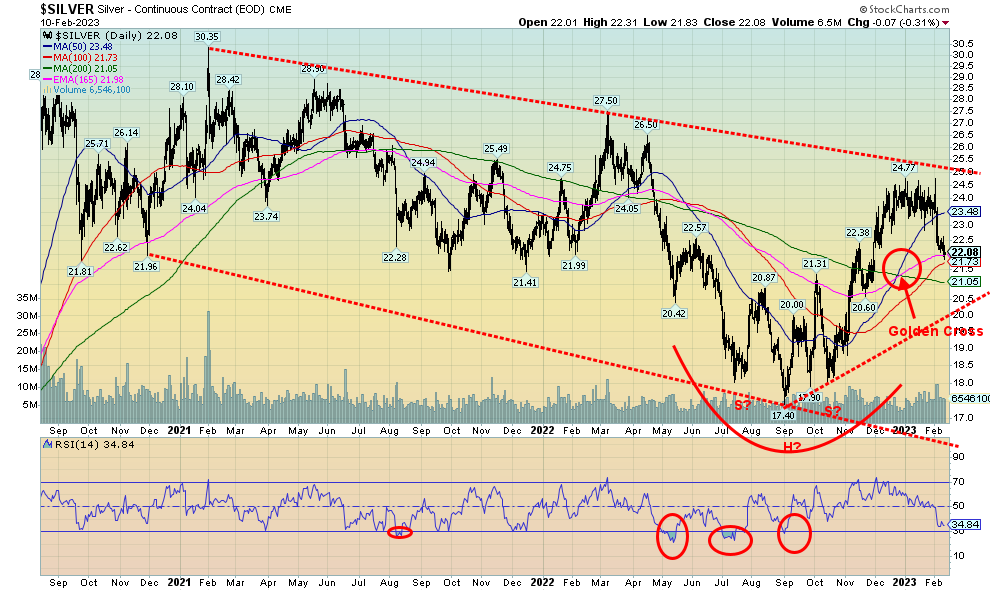
It was another miserable week for silver as it fell 1.5% and is now down 8.2% so far in 2023. The pattern that had formed since mid-December turned out to be a top rather than a flag or pennant pattern. We note that we failed just below a downtrend line currently near $25. We never did take out $25. We are now down roughly 11% from the recent high. That sounds strange in a world where we are supposed to be facing silver shortages. But, as we have often said, the paper market rules the physical market for both gold and silver. We even had the golden cross to the upside which was supposed to confirm the uptrend. Instead, we are in the throes of a selloff that could take us to the bottom of that wide channel. Currently that lies around $16. Note
how the golden cross was seen back in March 2022, but barely two months later in May 2022 we were whipsawed with a death cross. The signal is not a be-all that many proclaim.
As with gold, there is no COT report this week. Silver needs to regain back above $23.50 to convince us that we could regain the recent highs and take out $25. There is uptrend line support down to $20, but below that level the bottom of the bear channel looms. The good news is with an RSI of 34 we are fast approaching oversold levels that could at least give rise to a bounce.
Source: www.stockcharts.com
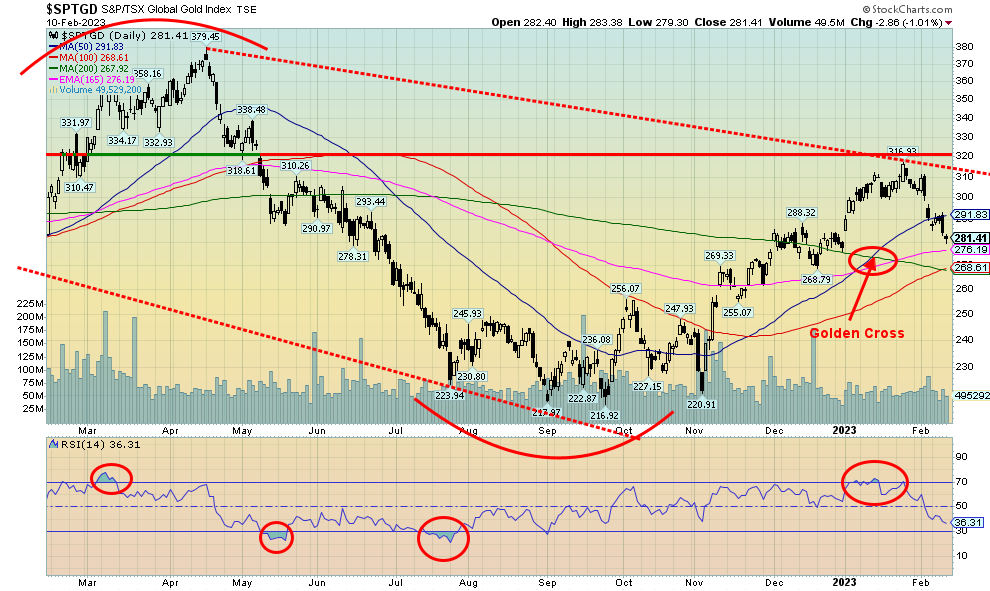
It has not been a good two weeks for the gold stocks. They fell again this past week with both the TSX Gold Index (TGD) and the Gold Bugs Index (HUI) losing 3.4%. The good news is, both still cling to gains for 2023 with the HUI up 2.5% and the TGD up 1.3%. However, at this rate that could be wiped out in no time. The TGD failed just above a resistance zone at 310. If we had been able to take out 320, we’d be in a better position to move higher towards 340, the next key zone of resistance. But we failed (high was 316) and down we go. We are now approaching a decent area of support at 275/280. But a firm breakdown under 270 would be negative and under 240 new lows become probable.
We never saw the gold stocks get particularly bullish. The Gold Miners Bullish Percent Index reached a recent high of only 55%, not exactly super-bullish. Currently it is 48%. This stands in contrast to gold itself that reached a daily sentiment index (DSI) of 92%, which is quite bullish. With an RSI at 36 and falling, the TGD is fast approaching oversold levels. While we had the famous golden cross that showed the upward trend for the TGD, it doesn’t mean they just keep going up. The 50-day MA should start to flatten out and could roll over if the TGD were to continue lower. But it would give the sell/whipsaw signal only if we were to get the death cross. So far, we see this pullback as a retracement within the context of a bull up move. Our minds might be changed on that if we were to firmly break under 270. On the way to record highs for the TGD in 2008–2011 there were six pullbacks of 15% or more. There was even a 22% pullback along the way from the lows of March 2020 to a high August 2020. Gold stocks can be volatile.
Oil and gas on the next page
Source: www.stockcharts.com
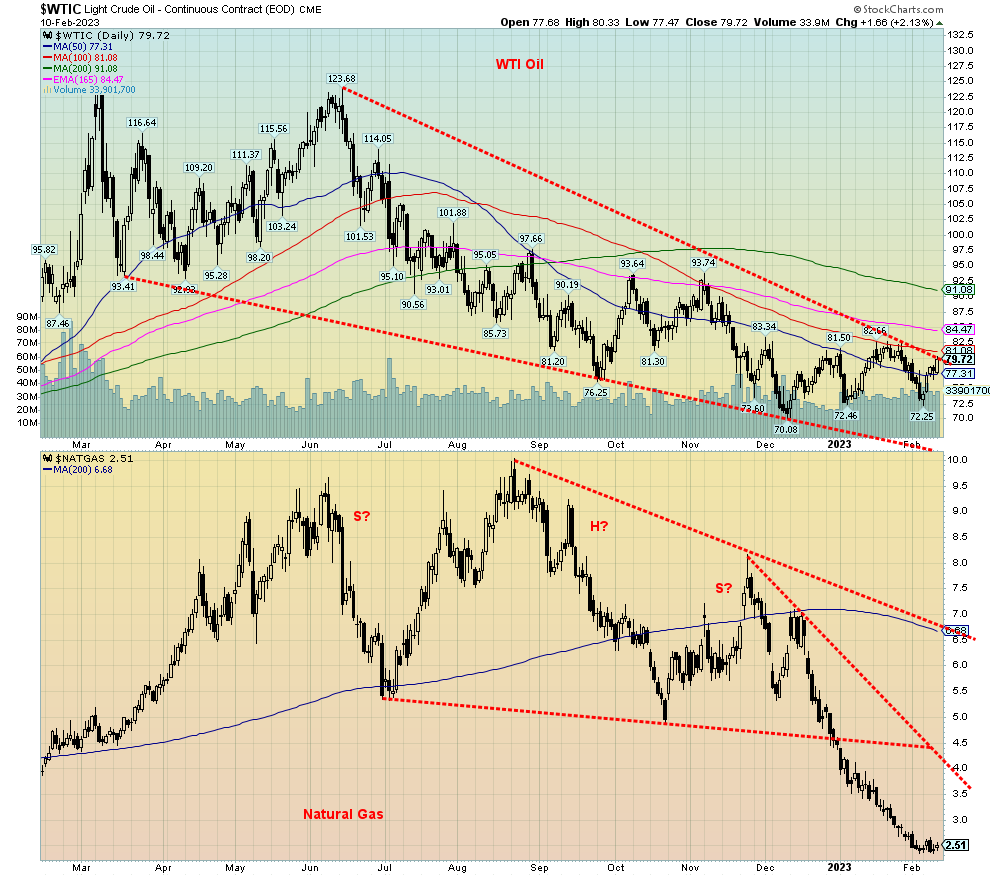
Russia has announced a 500,000-bpd cut in production as a result of price caps and sanctions. OPEC has said they won’t pick up the difference. Russia had promised not to sell any oil to anyone involved with price caps. There could be more cuts coming from other sources that are friendly to Russia. This has put some upward pressure on oil prices, leading to a jump of over $6 for WTI or an 8.6% rise this past week. Brent crude also went up, but only $2 and 2.4%. For the first time in a while, we had a positive week for natural gas (NG) as it rose 4.2%. But NG at the Dutch Hub didn’t follow (it was actually up last week when North American NG was down) as it lost 7.3%. The energy stocks responded to the positive WTI and NG with the ARCA Oil & Gas Index
(XOI) up 6.4% and the TSX Energy Index (TEN) up 4.2%.
Is WTI oil poised to finally break out over what still appears as a descending wedge triangle? We’ll find out this coming week. A firm breakout on volume could take WTI up to a maximum target of $134. A minimum objective would be $92/$93. We wish we could say the same about the depressed NG market, but at least last week was positive after weeks of down, down, down. If NG can regain $3, then a bigger up move might get underway. That 200-day MA is a long way off at around $6.70.
In another story that broke last week, well-known veteran investigative journalist Seymour Hersch published a report saying the U.S. was behind the blowing up of Nord Stream II on orders from President Biden. While on one hand it’s easy to dismiss the ramblings of the veteran journalist, he also revealed the massacre of Mai Lai and the prison abuse of Abu Gharib, plus others that proved true. Apparently, Russia had been cleared as being behind the blowing up of the pipeline.
We are entering a friendly seasonal period for oil and gas. Indeed, so far, we are quite late in getting going. The positive period lasts at least until June. But both WTI oil and NG need to break out this coming week. A break-out over $84 would be quite positive for oil, while NG over $3.00 would be a positive development. All that would change if oil were to drop back under $72.50 and NG to new lows.
Copyright David Chapman 2023
|
GLOSSARY Trends Daily – Short-term trend (For swing traders) Weekly – Intermediate-term trend (For long-term trend followers) Monthly – Long-term secular trend (For long-term trend followers) Up – The trend is up. Down – The trend is down Neutral – Indicators are mostly neutral. A trend change might be in the offing. Weak – The trend is still up or down but it is weakening. It is also a sign that the trend might change. Topping – Indicators are suggesting that while the trend remains up there are considerable signs that suggest that the market is topping. Bottoming – Indicators are suggesting that while the trend is down there are considerable signs that suggest that the market is bottoming. |
Disclaimer
David Chapman is not a registered advisory service and is not an exempt market dealer (EMD) nor a licensed financial advisor. He does not and cannot give individualised market advice. David Chapman has worked in the financial industry for over 40 years including large financial corporations, banks, and investment dealers. The information in this newsletter is intended only for informational and educational purposes. It should not be construed as an offer, a solicitation of an offer or sale of any security. Every effort is made to provide accurate and complete information. However, we cannot guarantee that there will be no errors. We make no claims, promises or guarantees about the accuracy, completeness, or adequacy of the contents of this commentary and expressly disclaim liability for errors and omissions in the contents of this commentary. David Chapman will always use his best efforts to ensure the accuracy and timeliness of all information. The reader assumes all risk when trading in securities and David Chapman advises consulting a licensed professional financial advisor or portfolio manager such as Enriched Investing Incorporated before proceeding with any trade or idea presented in this newsletter. David Chapman may own shares in companies mentioned in this newsletter. Before making an investment, prospective investors should review each security’s offering documents which summarize the objectives, fees, expenses and associated risks. David Chapman shares his ideas and opinions for informational and educational purposes only and expects the reader to perform due diligence before considering a position in any security. That includes consulting with your own licensed professional financial advisor such as Enriched Investing Incorporated. Performance is not guaranteed, values change frequently, and past performance may not be repeated.


