Longtime precious metals observers know that positions in COMEX gold always ebb and flow with price and position extremes often mark price highs and lows. This "washing" of the Commitment of Traders report is something we should discuss this week.
First of all, the primary news event this week will be the Wednesday release of the minutes from the June FOMC meeting. You'll recall the reaction to this meeting led to a very sharp short squeeze in the Dollar Index—a short squeeze that led to a massive smashing in COMEX precious metal prices. Could a detailed look at the meeting minutes reveal a scenario where the dollar falls backward later this week? If so, the oversold COMEX metals should be due for a bounce.
At any price turn, we always look for signals. In the COMEX precious metals, one of those signals will come from the weekly Commitment of Traders reports that are generated by the CFTC. These summary reports are NOT a trading tool, but they can be used to judge sentiment when searching for tops and bottoms.
And why are these reports NOT trading tools? Because even though the CFTC collects the data at the COMEX close each Tuesday, the data is not released to the public until 3:30 pm ET on Friday. That's a delay of 74 hours! There is no doubt this is done deliberately to maintain as much opacity in these "markets" as possible. However, the information can still be helpful if applied and considered on a historical basis.
Let's consider COMEX digital gold, and for the sake of simplicity, let's only use the short-form "legacy" report. Some folks like to dig into the weeds with the disaggregated position report, but for our purposes here, the legacy report works just fine.
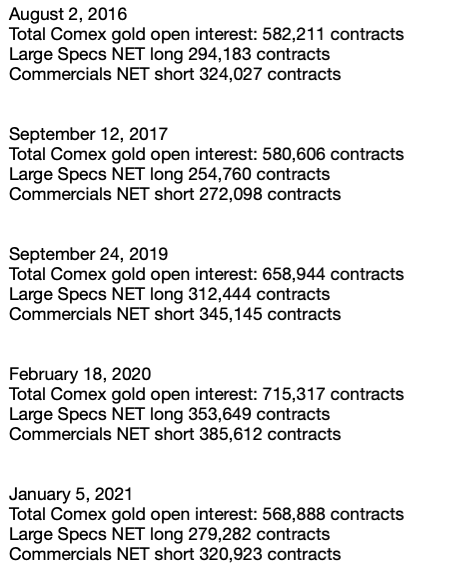
Again, often with some measure of hindsight, you can spot price tops and bottoms by measuring the current CoT positioning versus prior historical reports. The group known as the "Large Speculators" (mainly hedge and trading funds) are often heavily NET long at price tops, and the group known as "Commercials" (primarily the bullion banks) are often heavily NET short. Below are some examples:

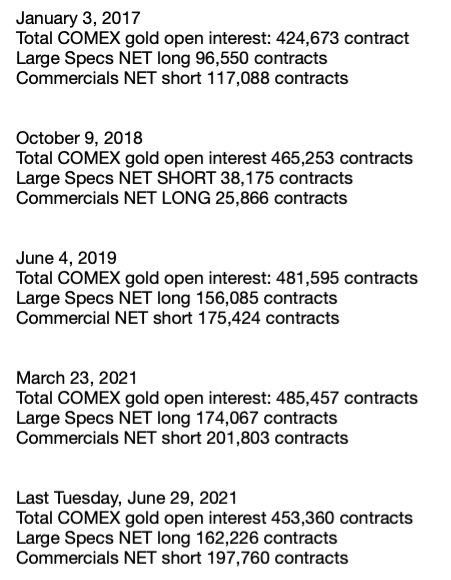
Conversely, these Large Speculator net long positions are always reduced and "washed out" at or near price lows. Below is another list:

As you can see, the CoT survey of last Tuesday, June 29, revealed the smallest Large Speculator NET long position since the survey taken on June 4, 2019. Where was price in June of 2019? Near $1300, and this was just before The Fed formally reversed course and began cutting the fed funds rate at their June 2019 FOMC meeting.
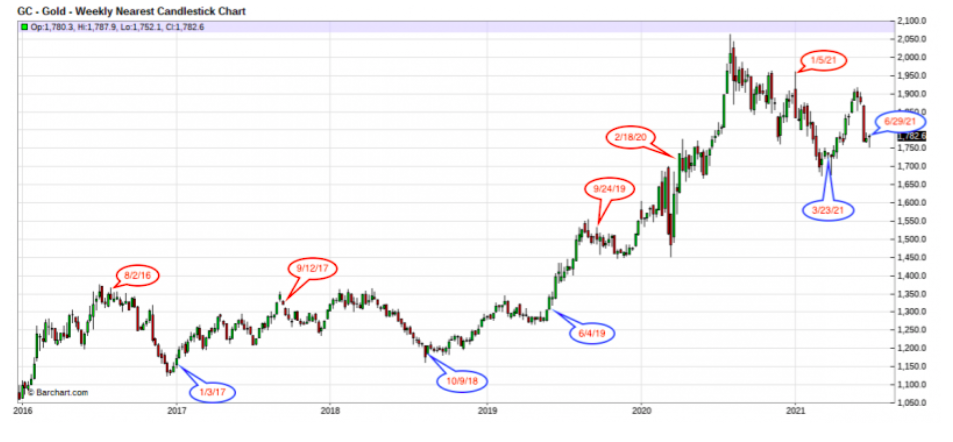
To make this even clearer, let's plot all the CoT highs and lows listed above onto a weekly price chart that goes back to 2016:

So, is the CoT for COMEX gold "washed out", and is a rally pending? Again, this CFTC-generated data is NEVER a trading tool, and it can only be helpful as a historical reference. However, as you can see, the CoT is far closer to a bullish extreme than it is a bearish extreme. Though price and positioning can always go lower, from a CoT-watching perspective it's likely that price lows for this cycle have now passed or are, at a minimum, pending for the very near future.


